| Param | Original file | Final file |
|---|---|---|
| Filename | modeM0/AS1A09_145T01_9000003866_26833cztM0_level2.evt | modeM0/AS1A09_145T01_9000003866_26833cztM0_level2_quad_clean.evt |
| Size (bytes) | 519,624,000 | 111,136,320 |
| Size | 495.6 MB | 106.0 MB |
| Events in quadrant A | 3,696,131 | 746,613 |
| Events in quadrant B | 3,753,804 | 759,584 |
| Events in quadrant C | 3,300,963 | 729,773 |
| Events in quadrant D | 4,550,934 | 682,569 |
| Mode M9 | |||
|---|---|---|---|
| Quadrant | BADHDUFLAG | Total packets | Discarded packets |
| A | 0 | 16 | 0 |
| B | 0 | 17 | 0 |
| C | 0 | 17 | 0 |
| D | 0 | 17 | 0 |
| Mode M0 | |||
|---|---|---|---|
| Quadrant | BADHDUFLAG | Total packets | Discarded packets |
| A | 0 | 15372 | 0 |
| B | 0 | 15386 | 0 |
| C | 0 | 13880 | 0 |
| D | 0 | 17876 | 0 |
| Quadrant | Total seconds | Saturated seconds | Saturation percentage |
|---|---|---|---|
| A | 6408 | 45 | 0.702247% |
| B | 6408 | 173 | 2.699750% |
| C | 6407 | 82 | 1.279850% |
| D | 6407 | 367 | 5.728110% |
Noise dominated data is calculated using 1-second bins in cleaned event files. If a bin has >2000 counts, and if more than 50% of those come from <1% of pixels, then it is considered to be noise-dominated and hence unusable.
| Quadrant | # 1 sec bins | Bins with >0 counts | Bins with >2000 counts | High rate bins dominated by noise | Noise dominated (total time) | Noise dominated (detector-on time) | Marked lightcurve |
|---|---|---|---|---|---|---|---|
| A | 7558 | 6409 | 0 | 0 | 0.00% | 0.00% | 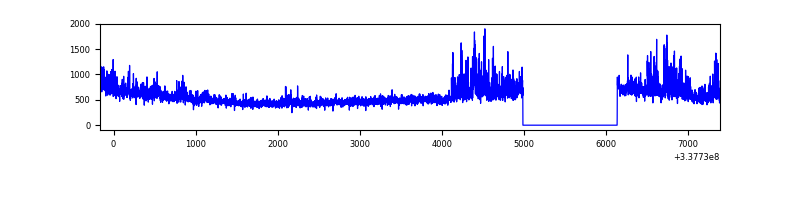 |
| B | 7558 | 6409 | 85 | 85 | 1.12% | 1.33% | 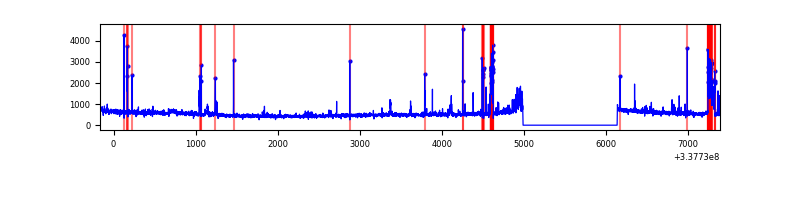 |
| C | 7557 | 6407 | 0 | 0 | 0.00% | 0.00% | 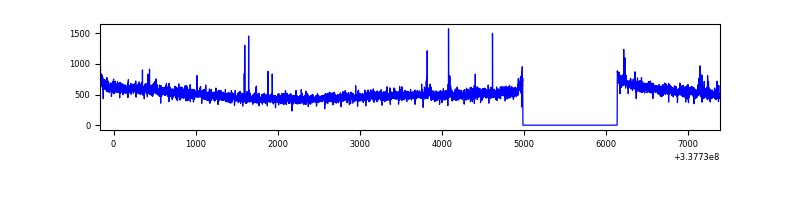 |
| D | 7557 | 6408 | 305 | 305 | 4.04% | 4.76% | 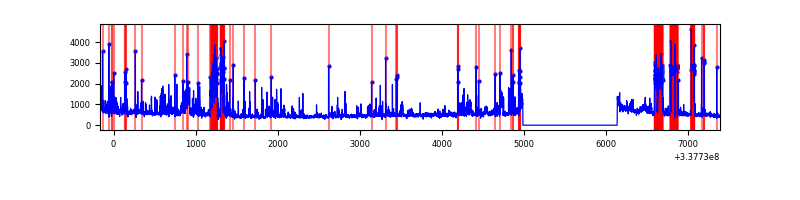 |
Top three noisy pixels from each quadrant. If the there are fewer than three noisy pixels in the level2.evt file, extra rows are filled as -1
| Pixel properties | Quadrant properties | ||||||
|---|---|---|---|---|---|---|---|
| Quadrant | DetID | PixID | Counts | Sigma | Mean | Median | Sigma |
| A | 0 | 13 | 484338 | 2866.41 | 832 | 817 | 168.7 |
| A | 13 | 254 | 11226 | 61.71 | 832 | 817 | 168.7 |
| A | 3 | 137 | 7517 | 39.72 | 832 | 817 | 168.7 |
| B | 3 | 64 | 242535 | 1537.82 | 830 | 810 | 157.2 |
| B | 0 | 189 | 157339 | 995.82 | 830 | 810 | 157.2 |
| B | 10 | 246 | 27241 | 168.15 | 830 | 810 | 157.2 |
| C | 14 | 238 | 129938 | 679.55 | 806 | 814 | 190.0 |
| C | 15 | 208 | 16243 | 81.2 | 806 | 814 | 190.0 |
| C | 2 | 16 | 14329 | 71.13 | 806 | 814 | 190.0 |
| D | 1 | 52 | 874151 | 4622.51 | 785 | 770 | 188.9 |
| D | 7 | 80 | 484077 | 2557.98 | 785 | 770 | 188.9 |
| D | 2 | 250 | 128089 | 673.86 | 785 | 770 | 188.9 |
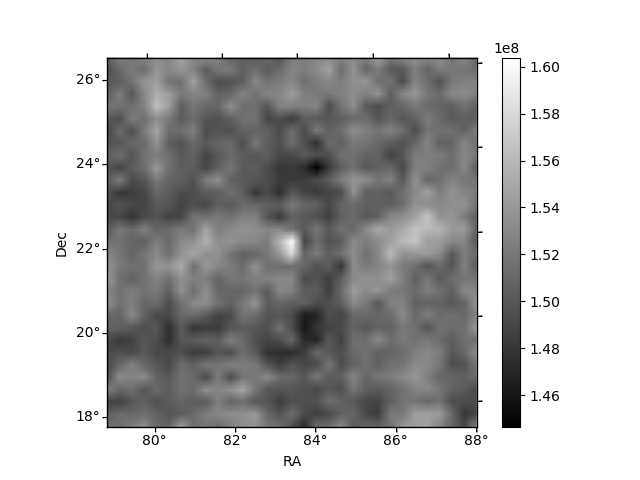
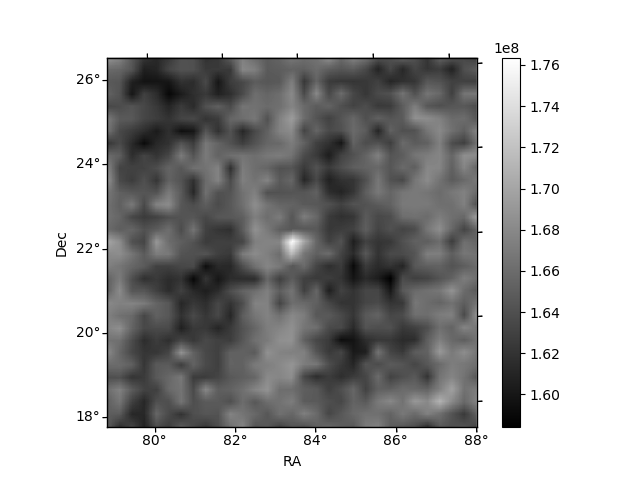
Histogram calculated using DETX and DETY for each event in the final _common_clean file
| Quadrant A | 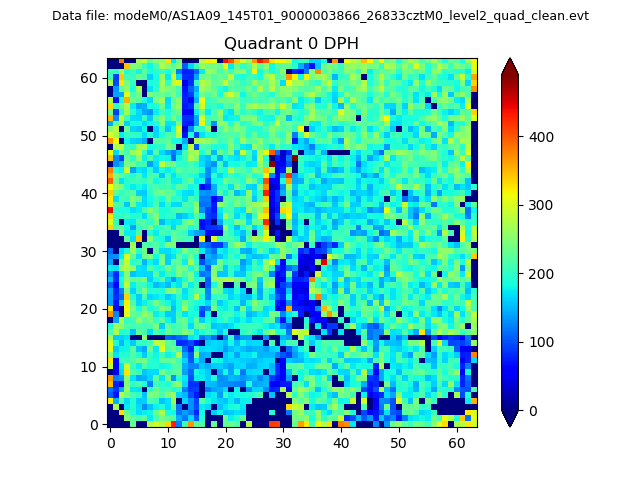 |
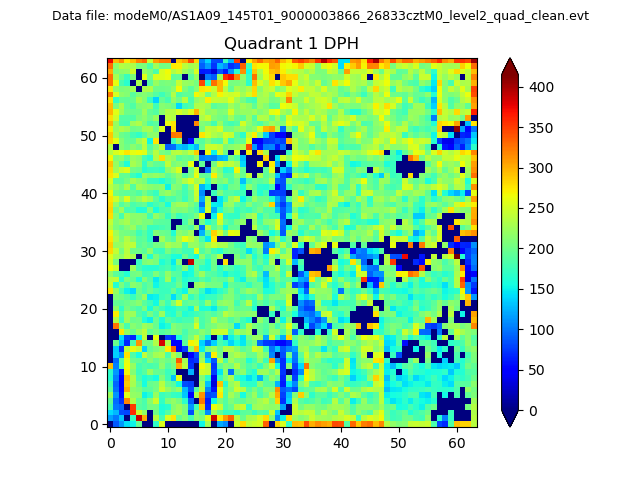 |
Quadrant B |
|---|---|---|---|
| Quadrant D | 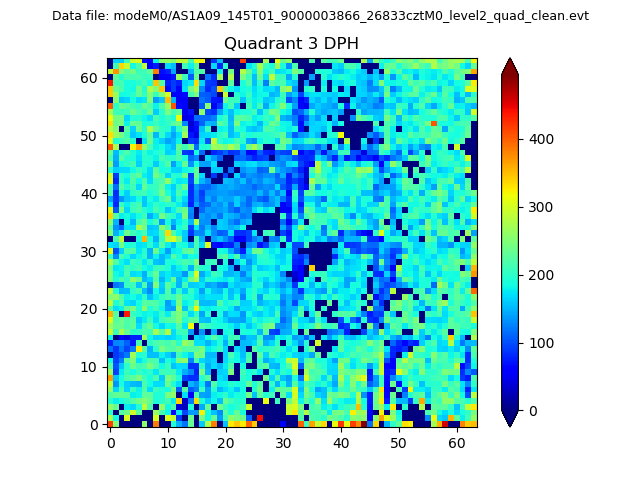 |
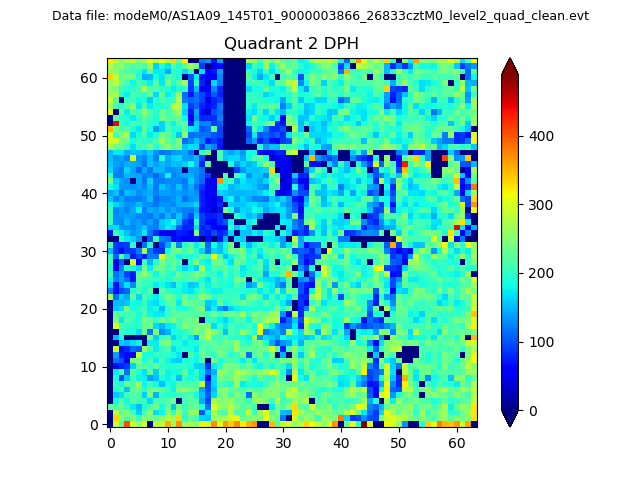 |
Quadrant C |
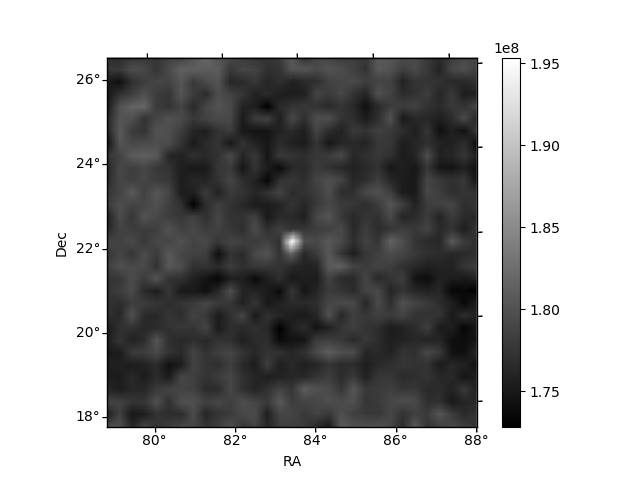
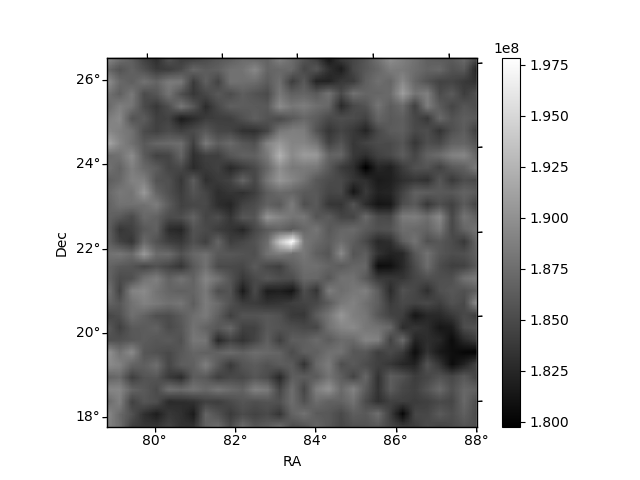
| Plot type | Count rate plots | Images |
|---|---|---|
| Comparison with Poisson distribution Blue bars denote a histogram of data divided into 1 sec bins. Red curve is a Poisson curve with rate = median count rate of data. |
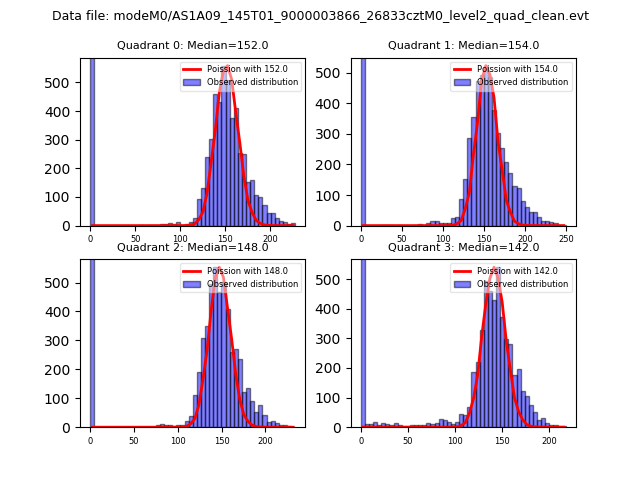 |
 |
| Quadrant-wise count rates Data is divided into 100 sec bins |
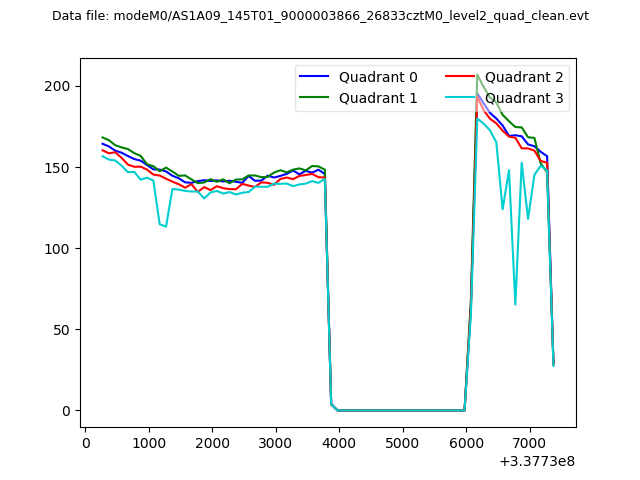 |
|
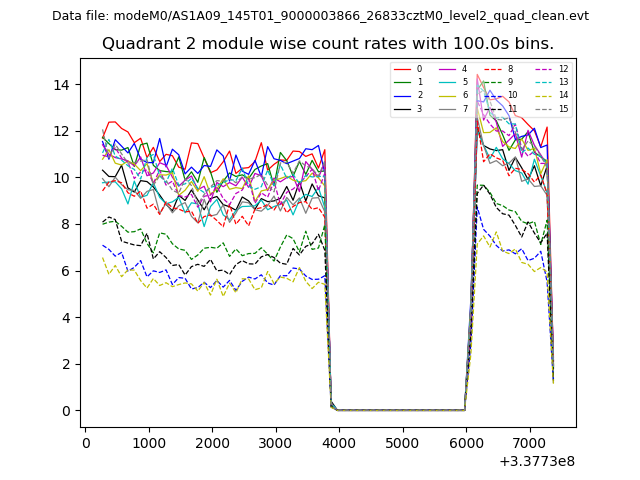
| Module-wise count rates for Quadrant A Data is divided into 100 sec bins |
 |
 |
| Module-wise count rates for Quadrant B Data is divided into 100 sec bins |
 |
 |
| Module-wise count rates for Quadrant C Data is divided into 100 sec bins |
 |
 |
| Module-wise count rates for Quadrant D Data is divided into 100 sec bins |
 |
 |
| Parameter | Plot |
|---|---|
| CZT HV Monitor | 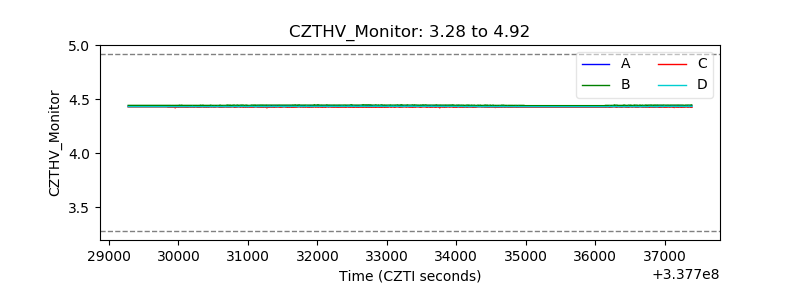 |
| D_VDD | 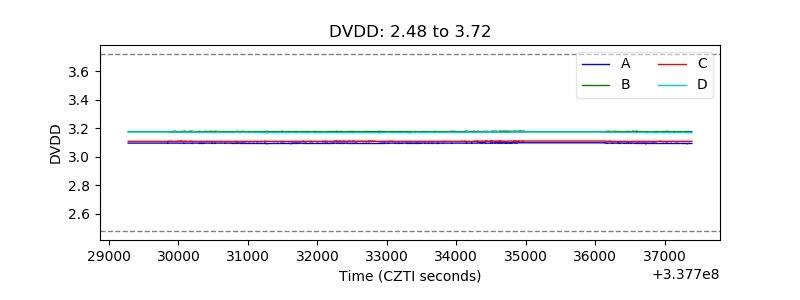 |
| Temperature 1 | 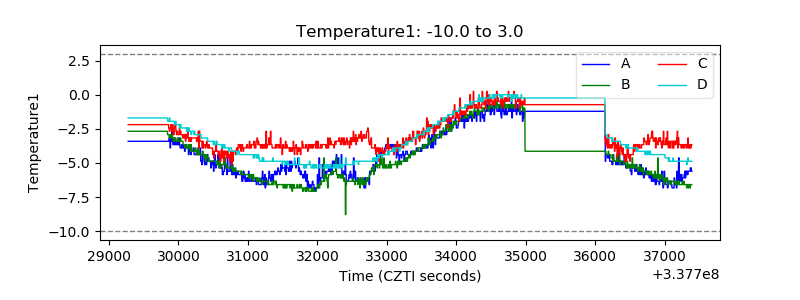 |
| Veto HV Monitor |  |
| Veto LLD | 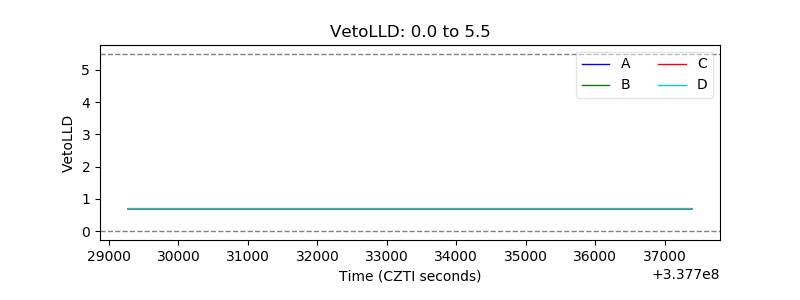 |
| Alpha Counter | 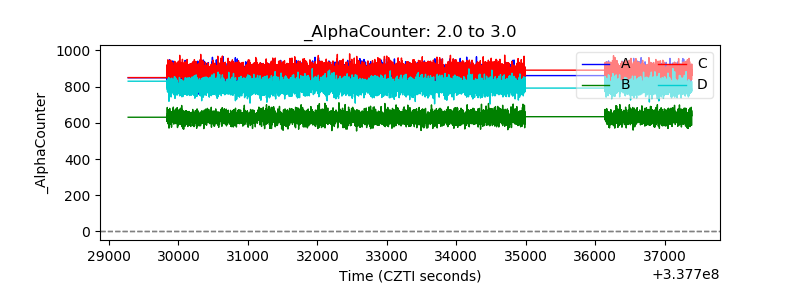 |
| _CPM_Rate | 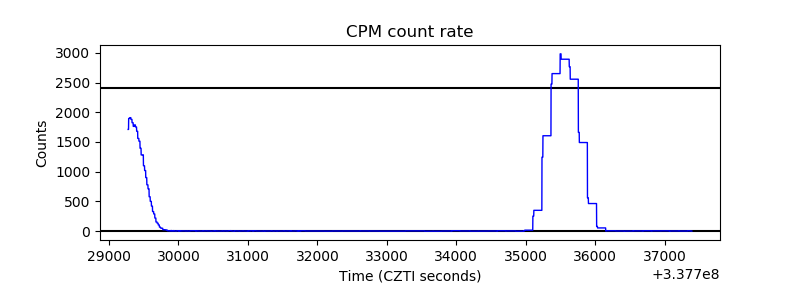 |
| CZT Counter |  |
| +2.5 Volts monitor | 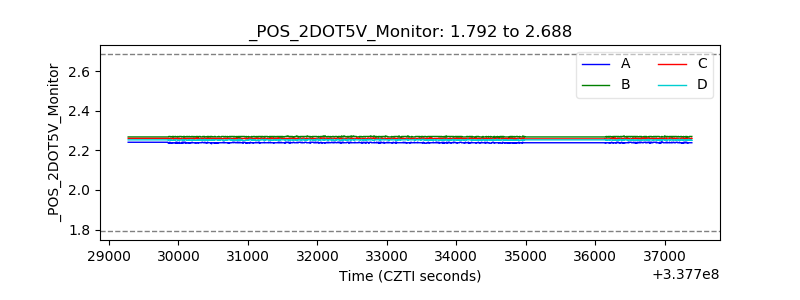 |
| +5 Volts monitor |  |
| _ROLL_ROT |  |
| _Roll_DEC |  |
| _Roll_RA |  |
| Veto Counter |  |