| Param | Original file | Final file |
|---|---|---|
| Filename | modeM0/AS1A09_145T01_9000003866_26834cztM0_level2.evt | modeM0/AS1A09_145T01_9000003866_26834cztM0_level2_quad_clean.evt |
| Size (bytes) | 643,501,440 | 116,064,000 |
| Size | 613.7 MB | 110.7 MB |
| Events in quadrant A | 4,147,108 | 806,307 |
| Events in quadrant B | 3,606,738 | 834,460 |
| Events in quadrant C | 3,323,985 | 788,031 |
| Events in quadrant D | 7,983,720 | 645,438 |
| Mode M9 | |||
|---|---|---|---|
| Quadrant | BADHDUFLAG | Total packets | Discarded packets |
| A | 0 | 13 | 0 |
| B | 0 | 14 | 0 |
| C | 0 | 14 | 0 |
| D | 0 | 14 | 0 |
| Mode M0 | |||
|---|---|---|---|
| Quadrant | BADHDUFLAG | Total packets | Discarded packets |
| A | 0 | 16700 | 0 |
| B | 0 | 14760 | 0 |
| C | 0 | 13842 | 0 |
| D | 0 | 27997 | 0 |
| Quadrant | Total seconds | Saturated seconds | Saturation percentage |
|---|---|---|---|
| A | 6313 | 67 | 1.061302% |
| B | 6313 | 108 | 1.710756% |
| C | 6313 | 68 | 1.077142% |
| D | 6312 | 1612 | 25.538657% |
Noise dominated data is calculated using 1-second bins in cleaned event files. If a bin has >2000 counts, and if more than 50% of those come from <1% of pixels, then it is considered to be noise-dominated and hence unusable.
| Quadrant | # 1 sec bins | Bins with >0 counts | Bins with >2000 counts | High rate bins dominated by noise | Noise dominated (total time) | Noise dominated (detector-on time) | Marked lightcurve |
|---|---|---|---|---|---|---|---|
| A | 7563 | 6314 | 13 | 13 | 0.17% | 0.21% | 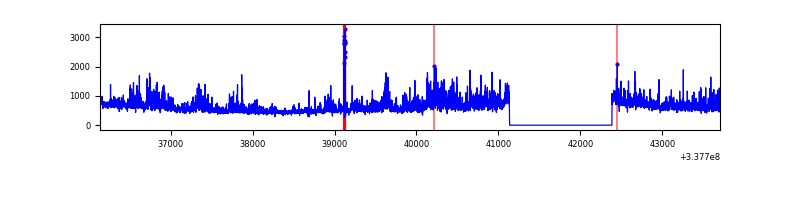 |
| B | 7563 | 6314 | 41 | 41 | 0.54% | 0.65% | 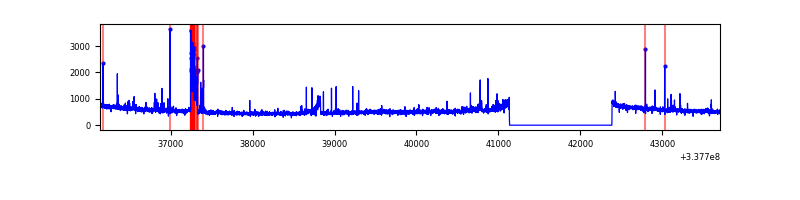 |
| C | 7563 | 6314 | 0 | 0 | 0.00% | 0.00% | 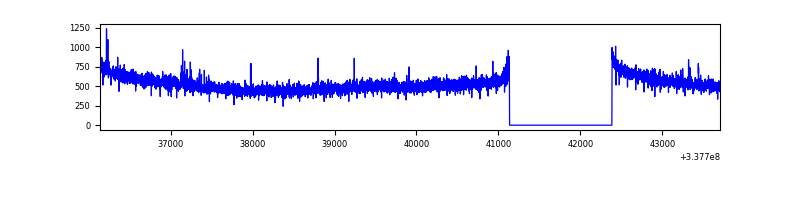 |
| D | 7562 | 6312 | 1519 | 1519 | 20.09% | 24.07% | 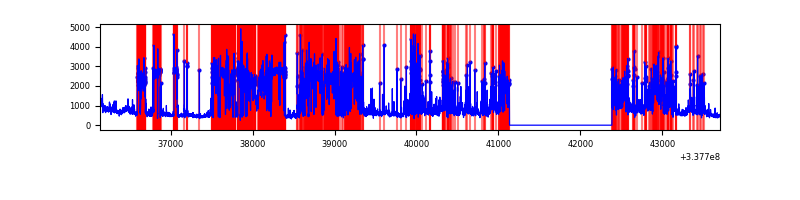 |
Top three noisy pixels from each quadrant. If the there are fewer than three noisy pixels in the level2.evt file, extra rows are filled as -1
| Pixel properties | Quadrant properties | ||||||
|---|---|---|---|---|---|---|---|
| Quadrant | DetID | PixID | Counts | Sigma | Mean | Median | Sigma |
| A | 0 | 13 | 867229 | 5141.03 | 842 | 831 | 168.5 |
| A | 12 | 96 | 35377 | 204.99 | 842 | 831 | 168.5 |
| A | 13 | 254 | 11017 | 60.44 | 842 | 831 | 168.5 |
| B | 3 | 64 | 191074 | 1189.88 | 848 | 832 | 159.9 |
| B | 7 | 205 | 36205 | 221.24 | 848 | 832 | 159.9 |
| B | 10 | 246 | 24336 | 147.01 | 848 | 832 | 159.9 |
| C | 14 | 238 | 132335 | 690.27 | 814 | 822 | 190.5 |
| C | 15 | 208 | 12178 | 59.6 | 814 | 822 | 190.5 |
| C | 2 | 16 | 8862 | 42.2 | 814 | 822 | 190.5 |
| D | 1 | 52 | 3905922 | 22804.66 | 717 | 702 | 171.2 |
| D | 7 | 80 | 1084976 | 6331.65 | 717 | 702 | 171.2 |
| D | 2 | 250 | 249926 | 1455.35 | 717 | 702 | 171.2 |
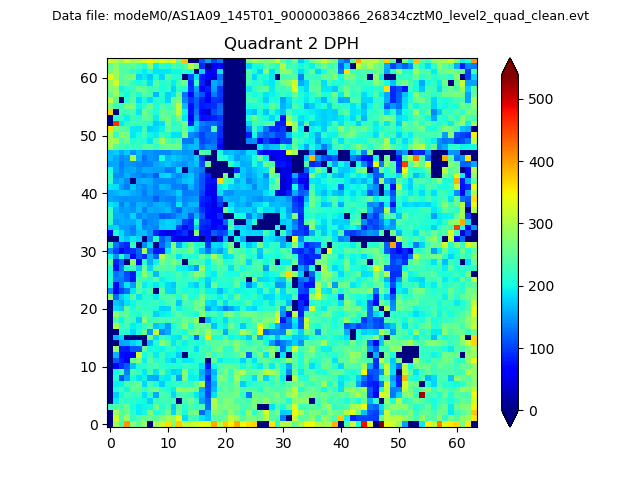
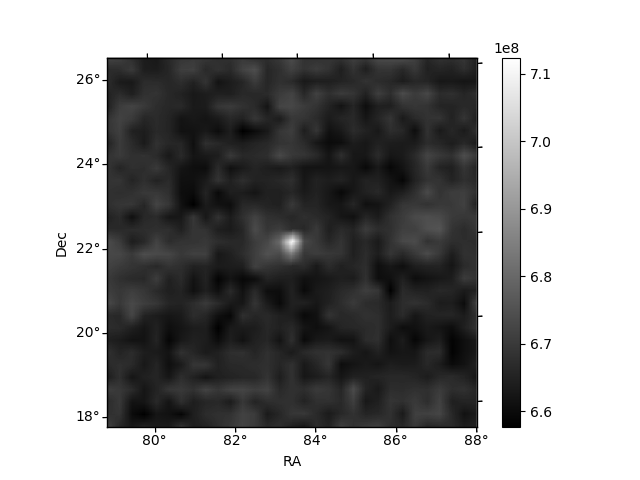
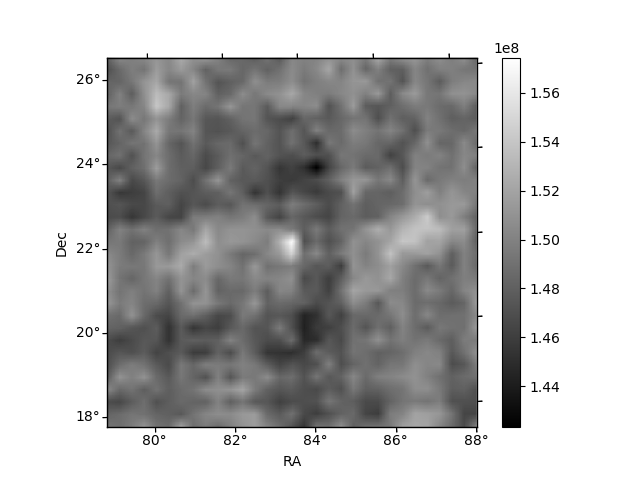
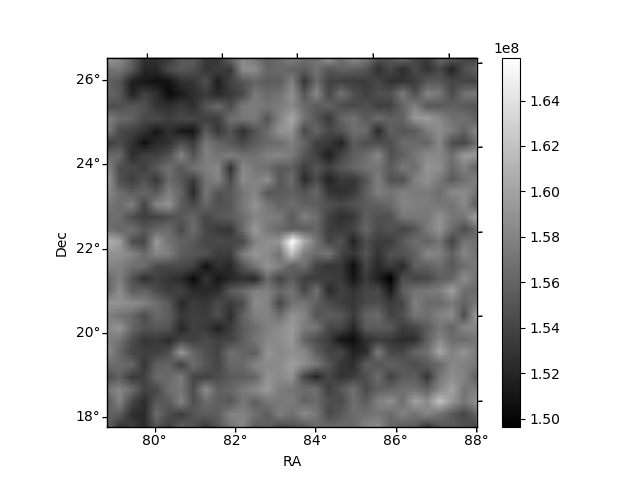
Histogram calculated using DETX and DETY for each event in the final _common_clean file
| Quadrant A | 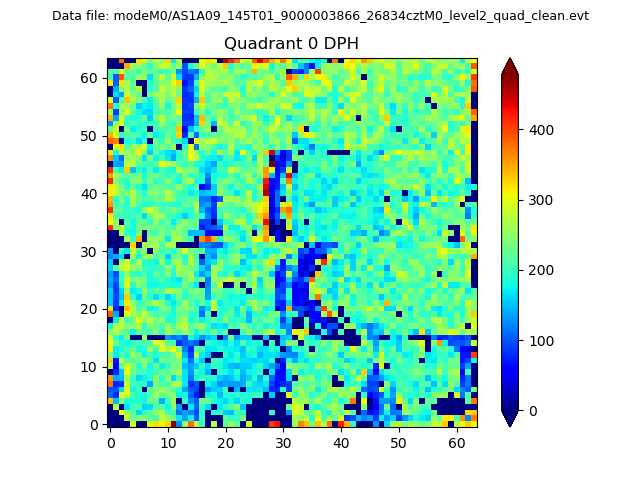 |
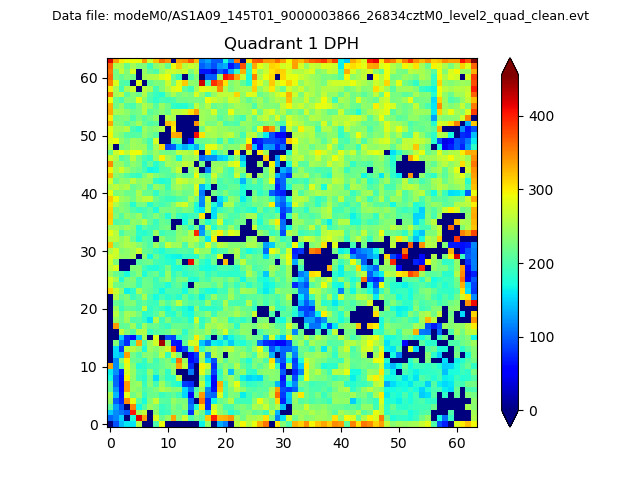 |
Quadrant B |
|---|---|---|---|
| Quadrant D | 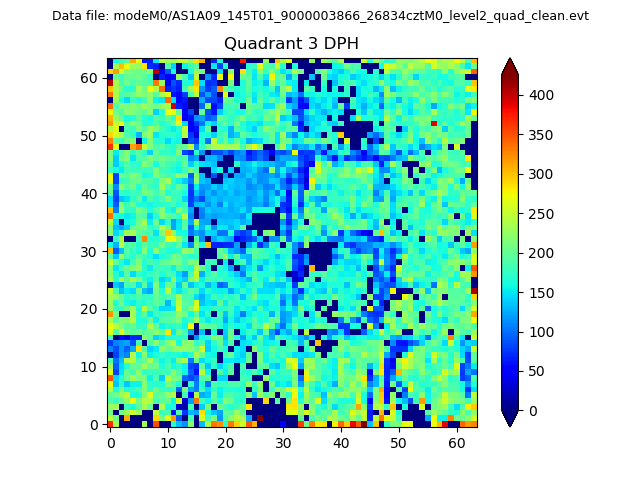 |
 |
Quadrant C |
| Plot type | Count rate plots | Images |
|---|---|---|
| Comparison with Poisson distribution Blue bars denote a histogram of data divided into 1 sec bins. Red curve is a Poisson curve with rate = median count rate of data. |
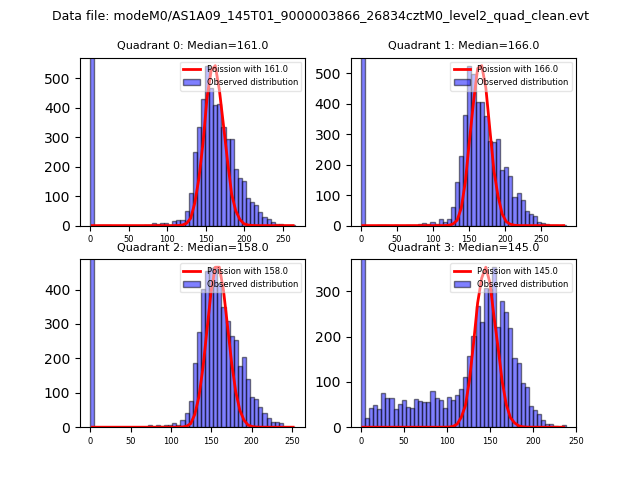 |
 |
| Quadrant-wise count rates Data is divided into 100 sec bins |
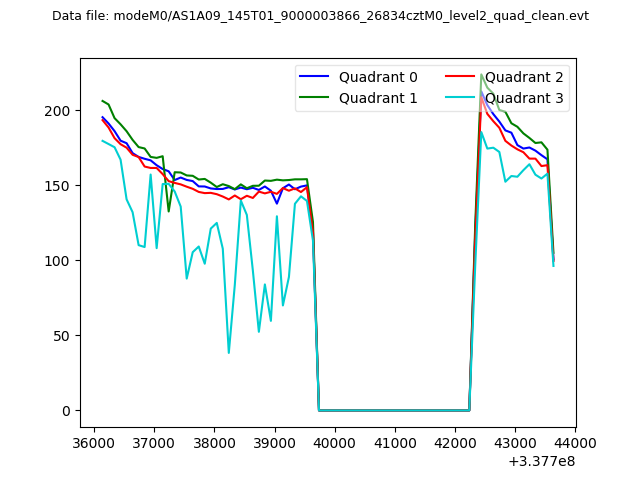 |
|
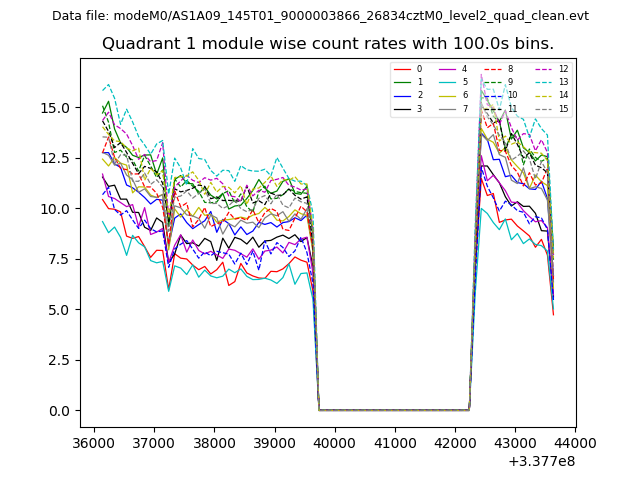
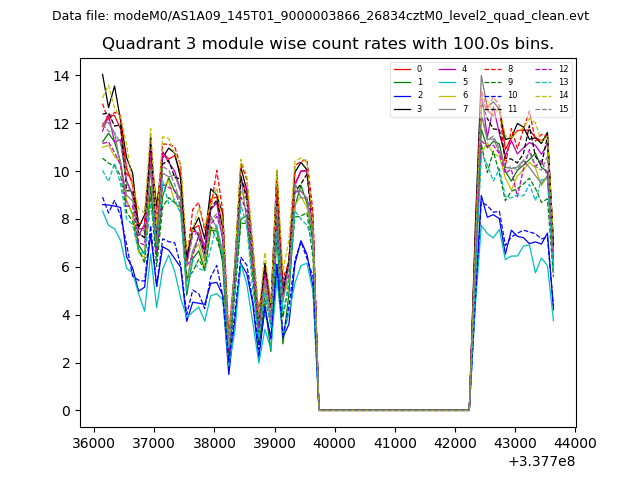
| Module-wise count rates for Quadrant A Data is divided into 100 sec bins |
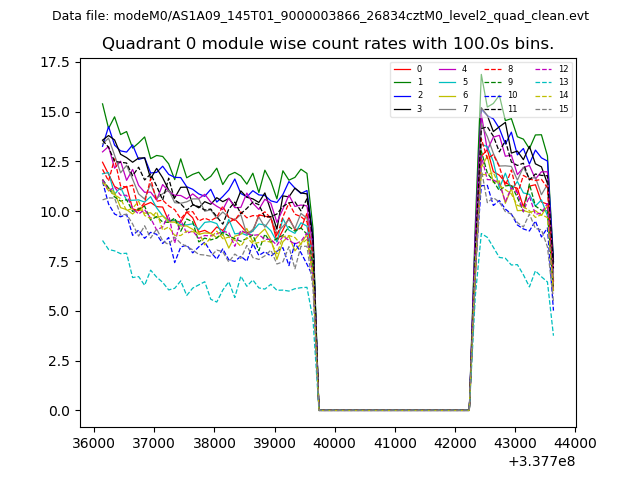 |
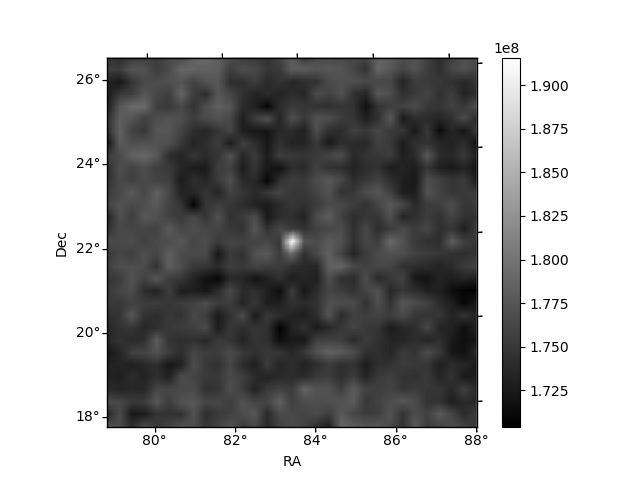 |
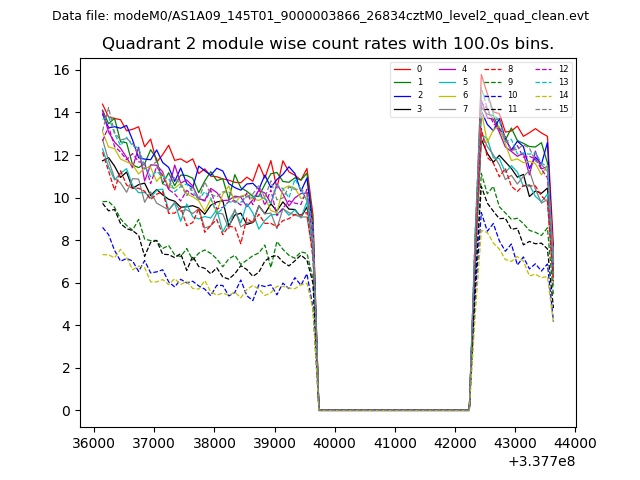
| Module-wise count rates for Quadrant B Data is divided into 100 sec bins |
 |
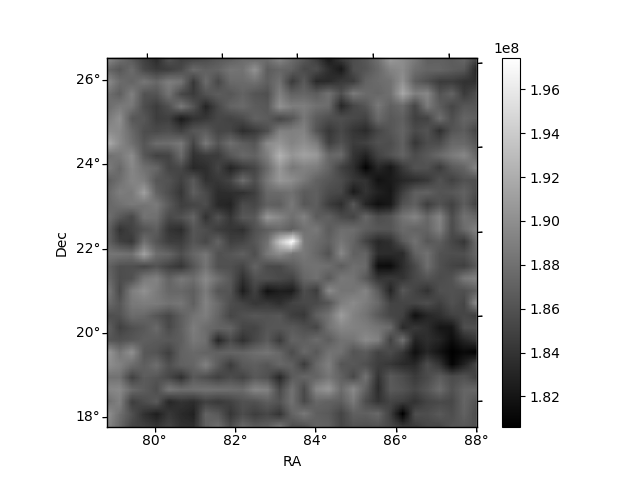 |
| Module-wise count rates for Quadrant C Data is divided into 100 sec bins |
 |
 |
| Module-wise count rates for Quadrant D Data is divided into 100 sec bins |
 |
 |
| Parameter | Plot |
|---|---|
| CZT HV Monitor | 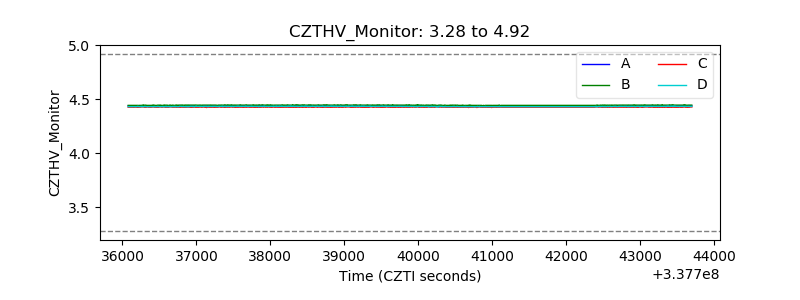 |
| D_VDD | 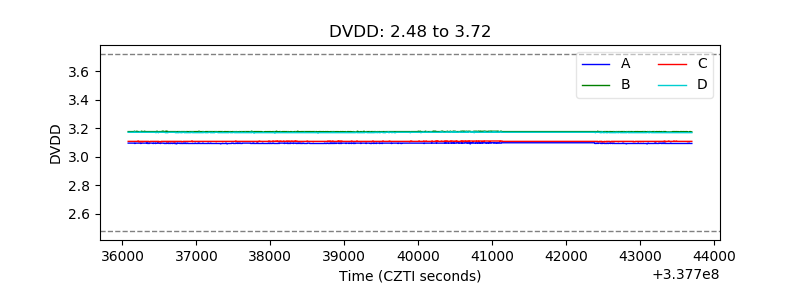 |
| Temperature 1 | 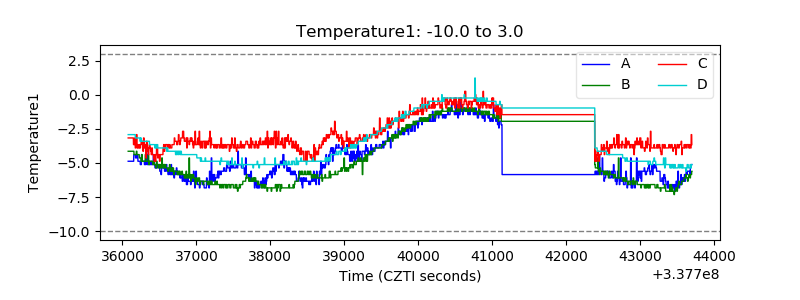 |
| Veto HV Monitor |  |
| Veto LLD | 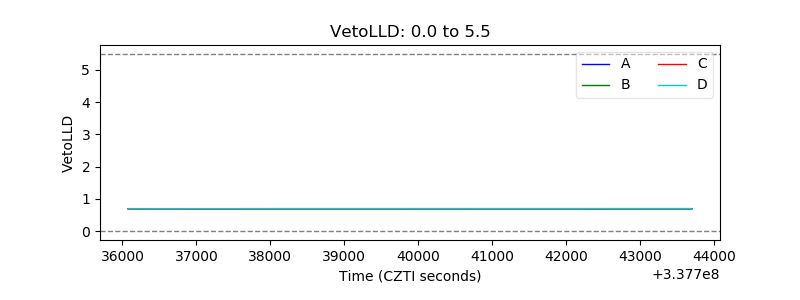 |
| Alpha Counter | 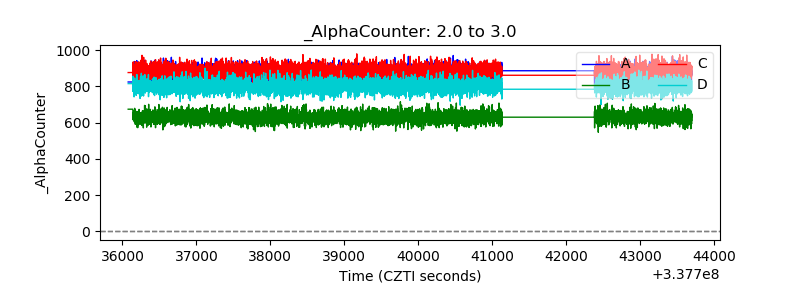 |
| _CPM_Rate | 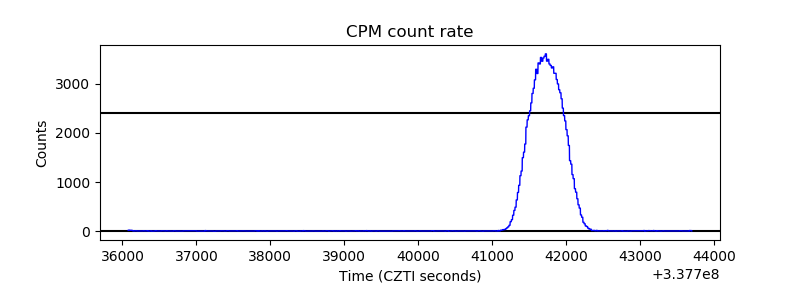 |
| CZT Counter | 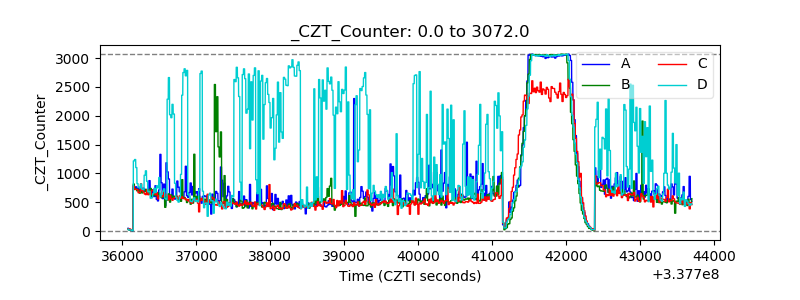 |
| +2.5 Volts monitor |  |
| +5 Volts monitor |  |
| _ROLL_ROT | 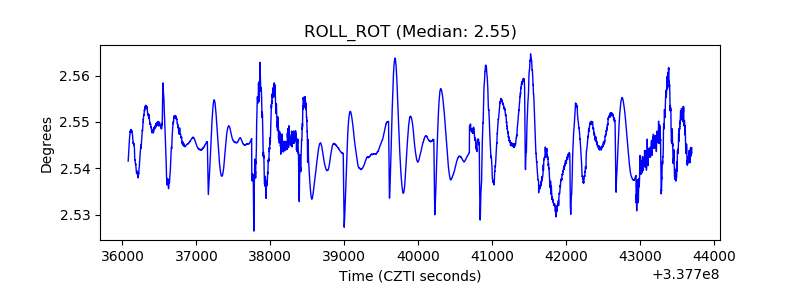 |
| _Roll_DEC | 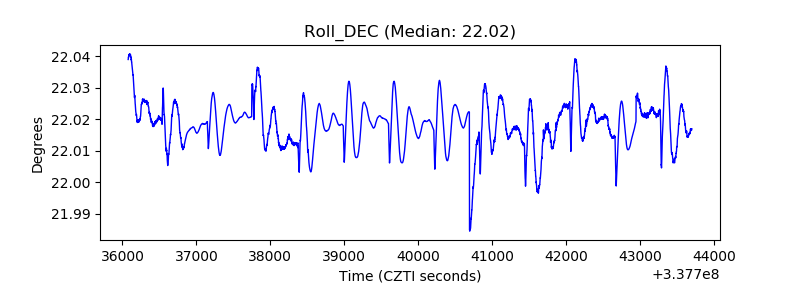 |
| _Roll_RA | 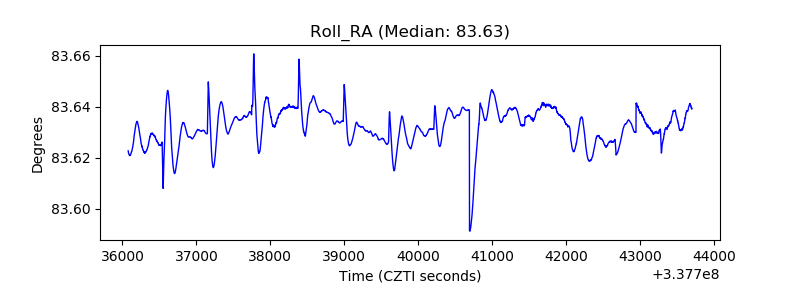 |
| Veto Counter | 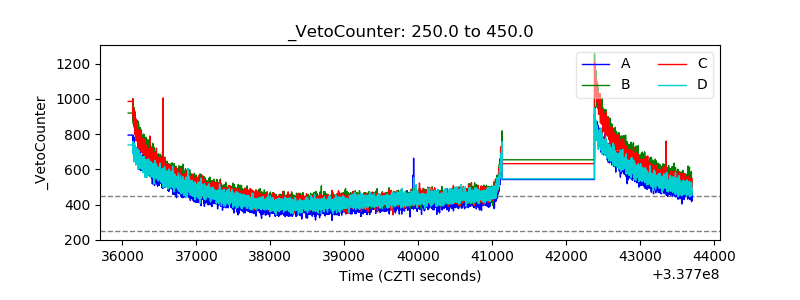 |