| Param | Original file | Final file |
|---|---|---|
| Filename | modeM0/AS1A09_145T01_9000003866_26835cztM0_level2.evt | modeM0/AS1A09_145T01_9000003866_26835cztM0_level2_quad_clean.evt |
| Size (bytes) | 581,454,720 | 123,517,440 |
| Size | 554.5 MB | 117.8 MB |
| Events in quadrant A | 4,163,328 | 838,311 |
| Events in quadrant B | 3,914,643 | 872,191 |
| Events in quadrant C | 3,609,069 | 813,967 |
| Events in quadrant D | 5,479,958 | 760,653 |
| Mode M9 | |||
|---|---|---|---|
| Quadrant | BADHDUFLAG | Total packets | Discarded packets |
| A | 0 | 15 | 0 |
| B | 0 | 16 | 0 |
| C | 0 | 16 | 0 |
| D | 0 | 16 | 0 |
| Mode M0 | |||
|---|---|---|---|
| Quadrant | BADHDUFLAG | Total packets | Discarded packets |
| A | 0 | 16718 | 0 |
| B | 0 | 15717 | 0 |
| C | 0 | 14635 | 0 |
| D | 0 | 20674 | 0 |
| Quadrant | Total seconds | Saturated seconds | Saturation percentage |
|---|---|---|---|
| A | 6542 | 34 | 0.519719% |
| B | 6542 | 98 | 1.498013% |
| C | 6542 | 90 | 1.375726% |
| D | 6541 | 434 | 6.635071% |
Noise dominated data is calculated using 1-second bins in cleaned event files. If a bin has >2000 counts, and if more than 50% of those come from <1% of pixels, then it is considered to be noise-dominated and hence unusable.
| Quadrant | # 1 sec bins | Bins with >0 counts | Bins with >2000 counts | High rate bins dominated by noise | Noise dominated (total time) | Noise dominated (detector-on time) | Marked lightcurve |
|---|---|---|---|---|---|---|---|
| A | 7877 | 6543 | 2 | 2 | 0.03% | 0.03% | 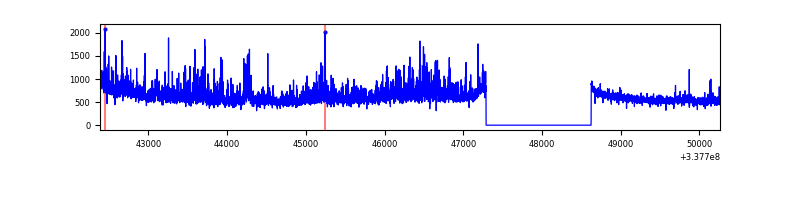 |
| B | 7877 | 6543 | 17 | 17 | 0.22% | 0.26% | 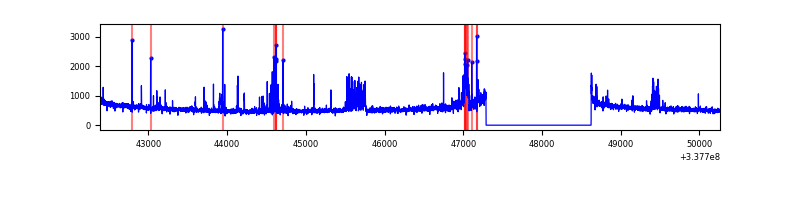 |
| C | 7877 | 6543 | 8 | 8 | 0.10% | 0.12% | 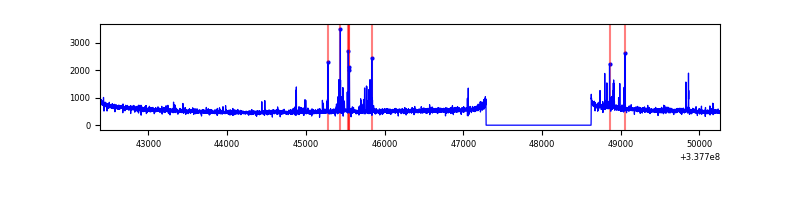 |
| D | 7876 | 6542 | 375 | 375 | 4.76% | 5.73% | 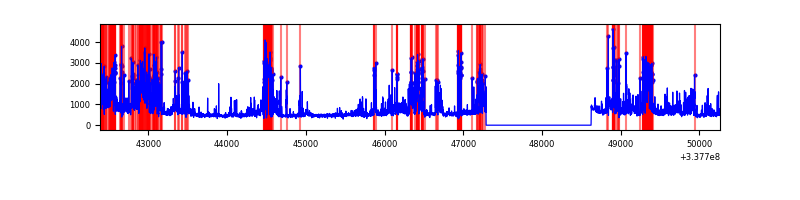 |
Top three noisy pixels from each quadrant. If the there are fewer than three noisy pixels in the level2.evt file, extra rows are filled as -1
| Pixel properties | Quadrant properties | ||||||
|---|---|---|---|---|---|---|---|
| Quadrant | DetID | PixID | Counts | Sigma | Mean | Median | Sigma |
| A | 0 | 13 | 702277 | 3909.06 | 898 | 889 | 179.4 |
| A | 13 | 254 | 10739 | 54.9 | 898 | 889 | 179.4 |
| A | 0 | 226 | 7687 | 37.89 | 898 | 889 | 179.4 |
| B | 0 | 189 | 149447 | 882.67 | 901 | 884 | 168.3 |
| B | 10 | 246 | 84482 | 496.69 | 901 | 884 | 168.3 |
| B | 15 | 33 | 70398 | 413.01 | 901 | 884 | 168.3 |
| C | 14 | 238 | 141761 | 702.63 | 862 | 871 | 200.5 |
| C | 15 | 208 | 108432 | 536.42 | 862 | 871 | 200.5 |
| C | 13 | 61 | 5947 | 25.31 | 862 | 871 | 200.5 |
| D | 7 | 80 | 1917564 | 9634.0 | 836 | 820 | 199.0 |
| D | 2 | 250 | 210461 | 1053.7 | 836 | 820 | 199.0 |
| D | 1 | 52 | 176190 | 881.45 | 836 | 820 | 199.0 |
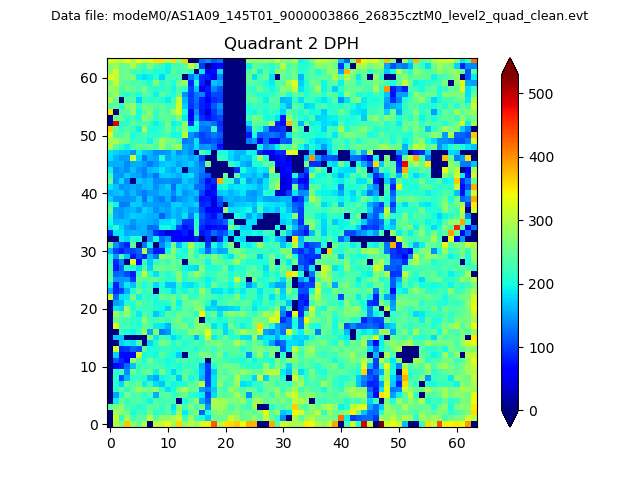
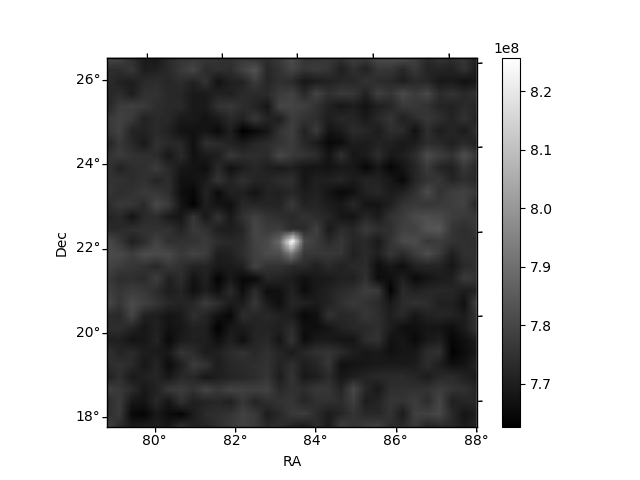
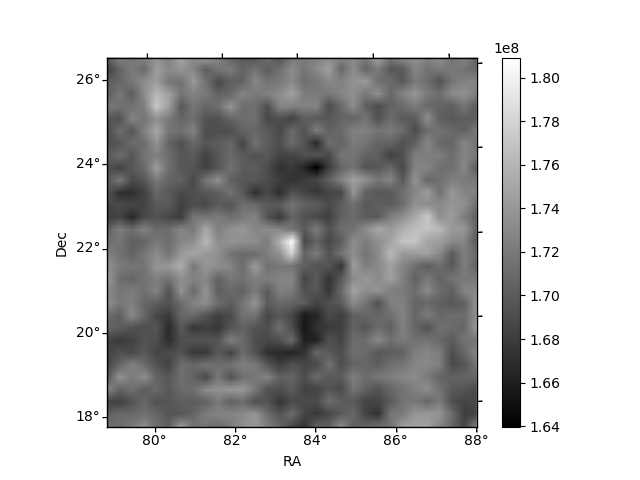
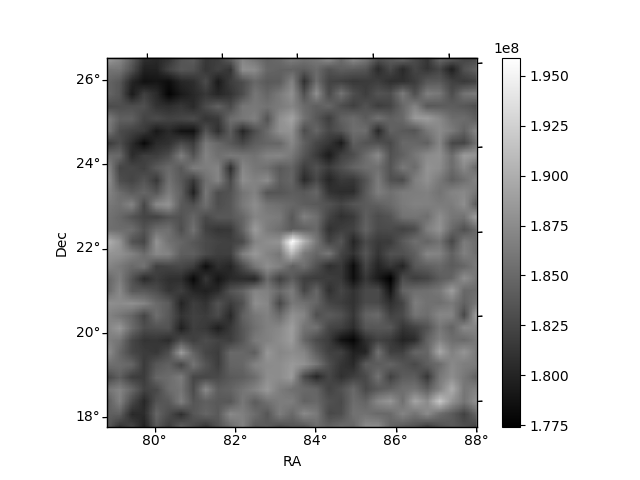
Histogram calculated using DETX and DETY for each event in the final _common_clean file
| Quadrant A | 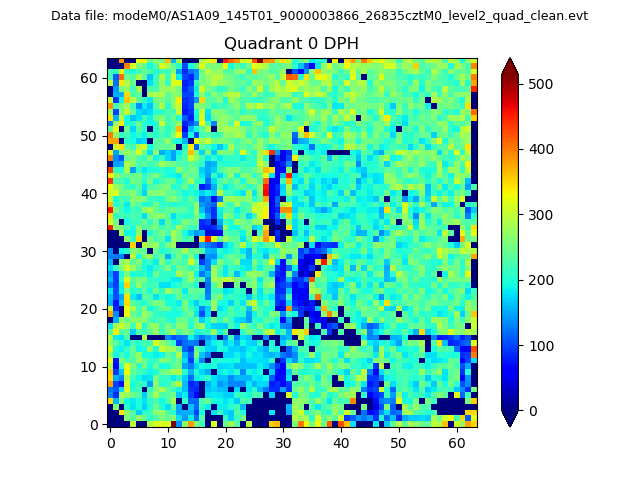 |
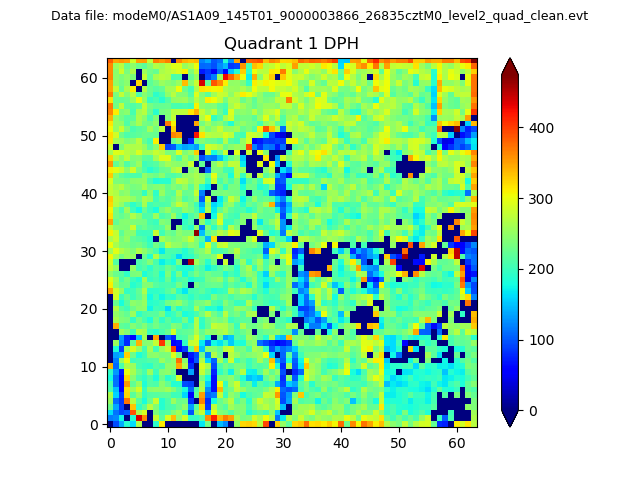 |
Quadrant B |
|---|---|---|---|
| Quadrant D | 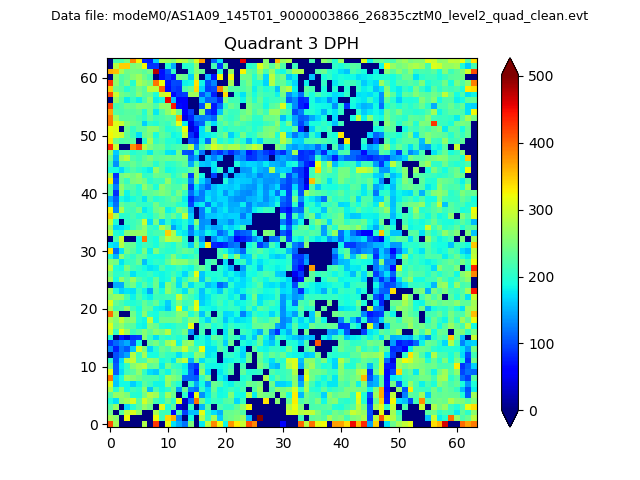 |
 |
Quadrant C |
| Plot type | Count rate plots | Images |
|---|---|---|
| Comparison with Poisson distribution Blue bars denote a histogram of data divided into 1 sec bins. Red curve is a Poisson curve with rate = median count rate of data. |
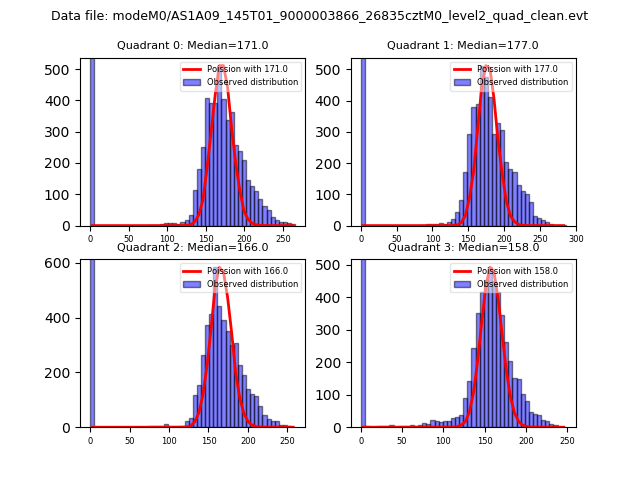 |
 |
| Quadrant-wise count rates Data is divided into 100 sec bins |
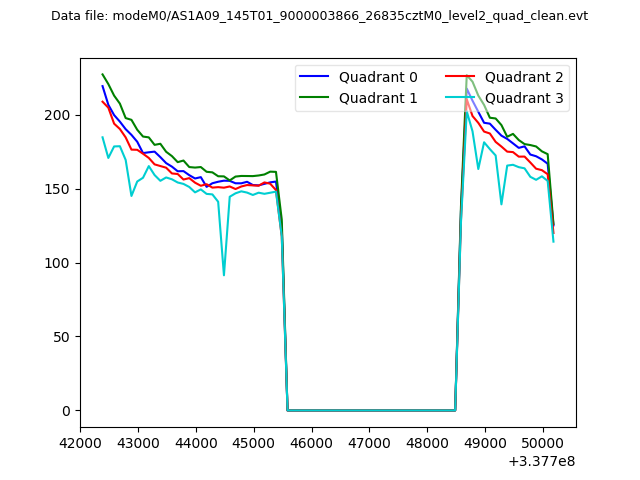 |
|
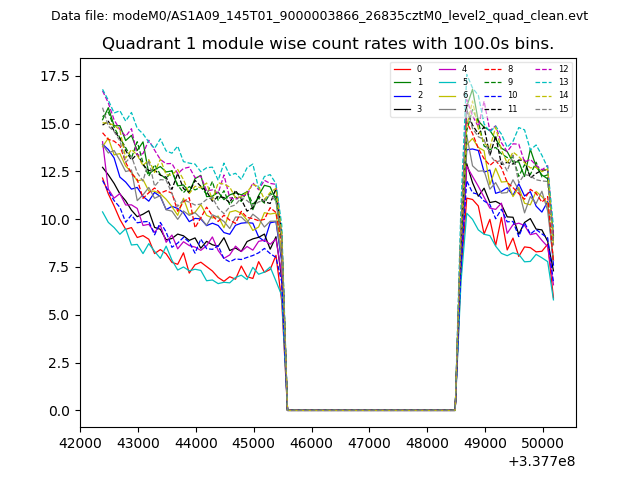
| Module-wise count rates for Quadrant A Data is divided into 100 sec bins |
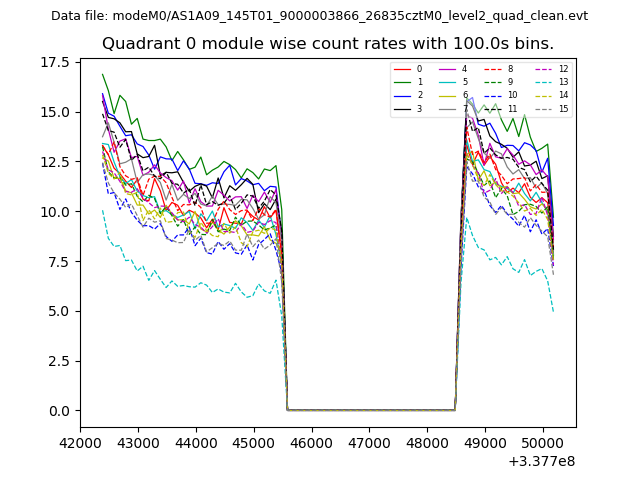 |
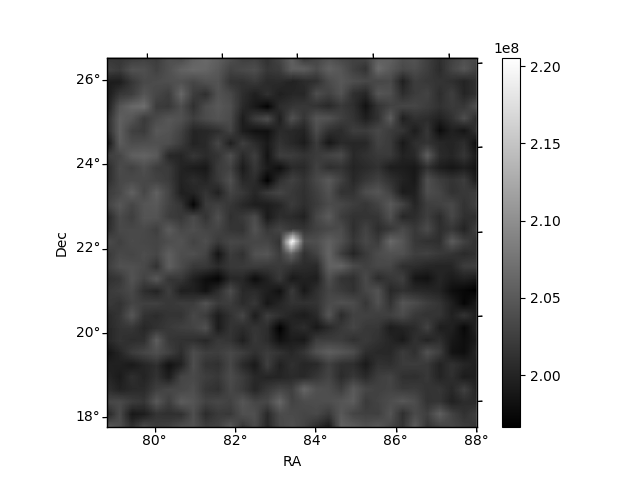 |
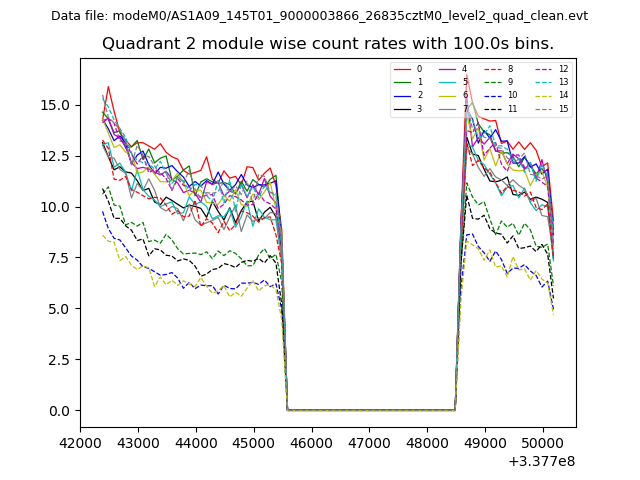
| Module-wise count rates for Quadrant B Data is divided into 100 sec bins |
 |
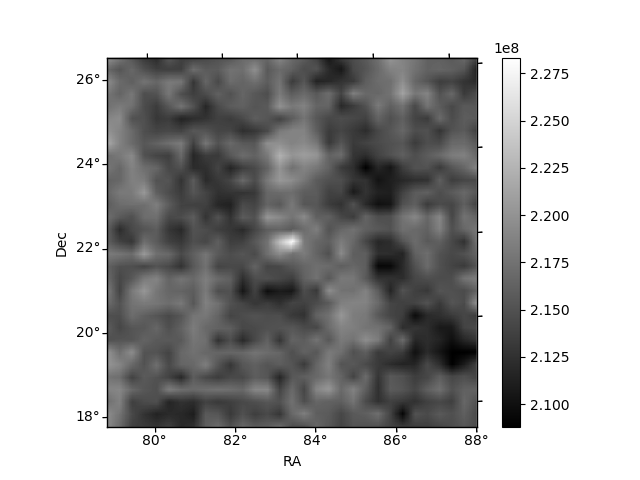 |
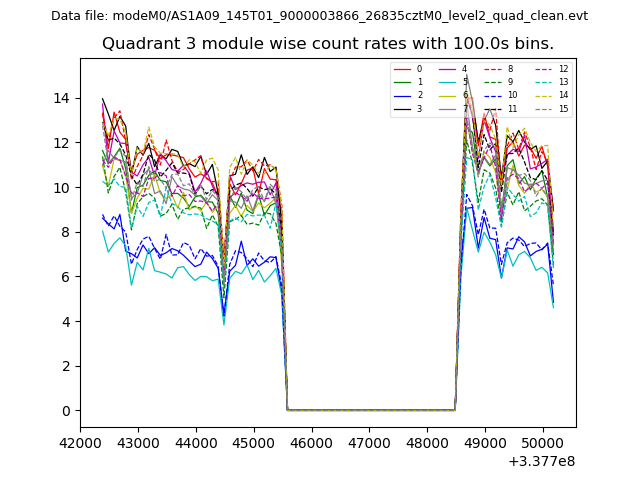
| Module-wise count rates for Quadrant C Data is divided into 100 sec bins |
 |
 |
| Module-wise count rates for Quadrant D Data is divided into 100 sec bins |
 |
 |
| Parameter | Plot |
|---|---|
| CZT HV Monitor | 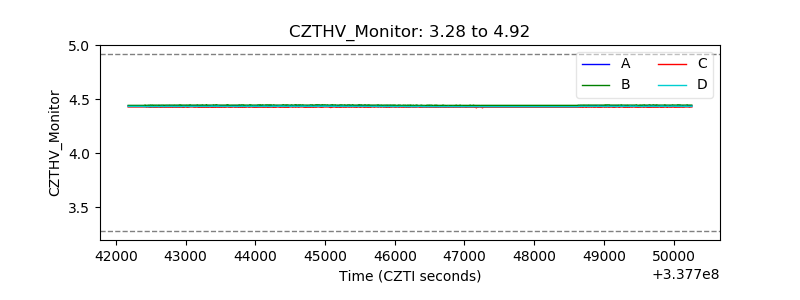 |
| D_VDD | 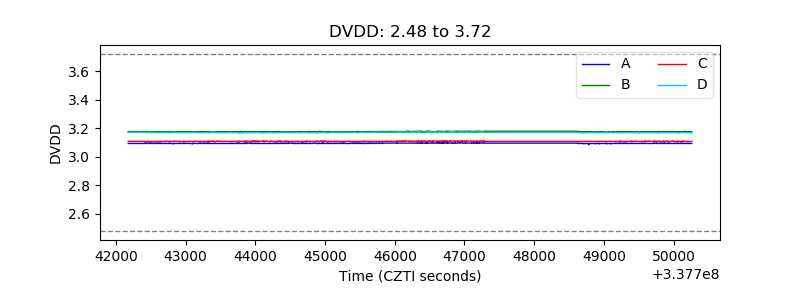 |
| Temperature 1 | 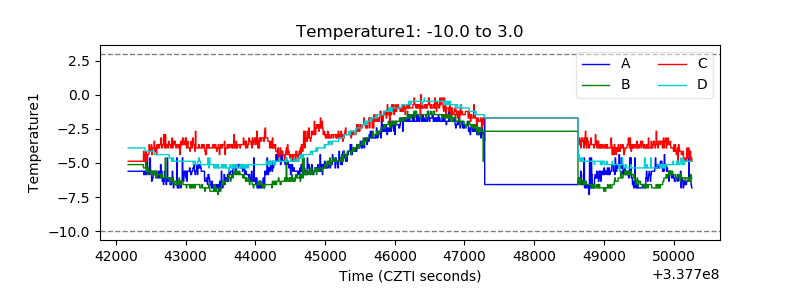 |
| Veto HV Monitor | 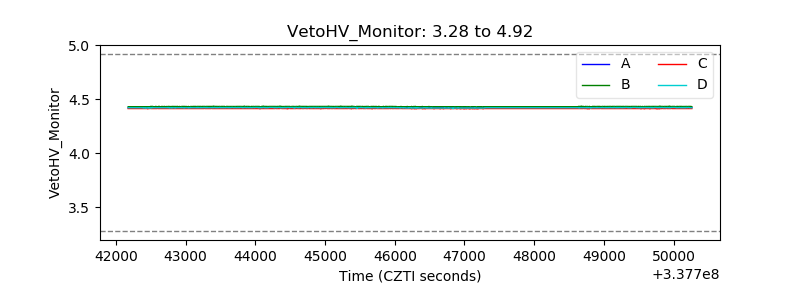 |
| Veto LLD | 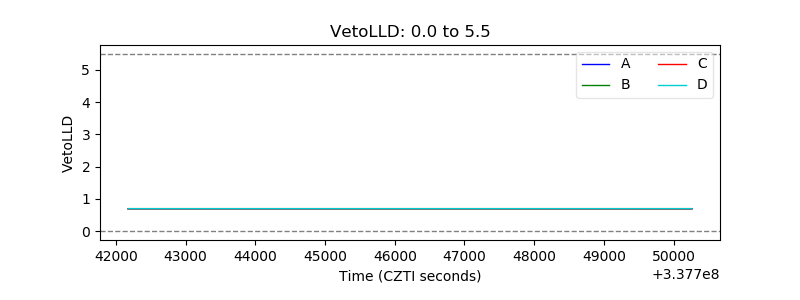 |
| Alpha Counter | 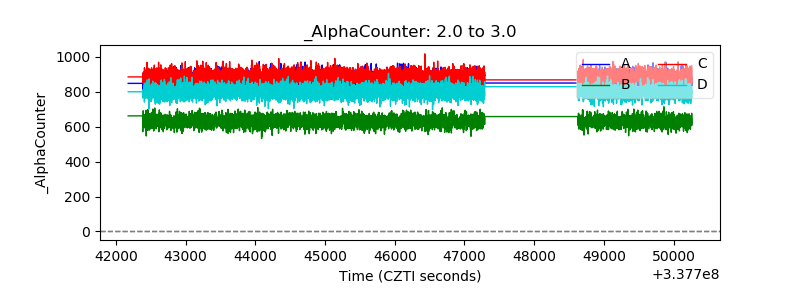 |
| _CPM_Rate | 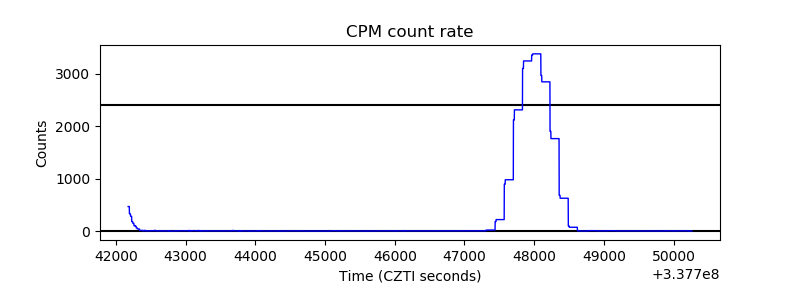 |
| CZT Counter | 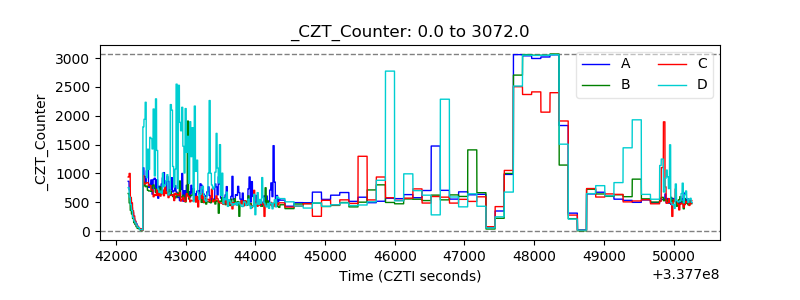 |
| +2.5 Volts monitor |  |
| +5 Volts monitor | 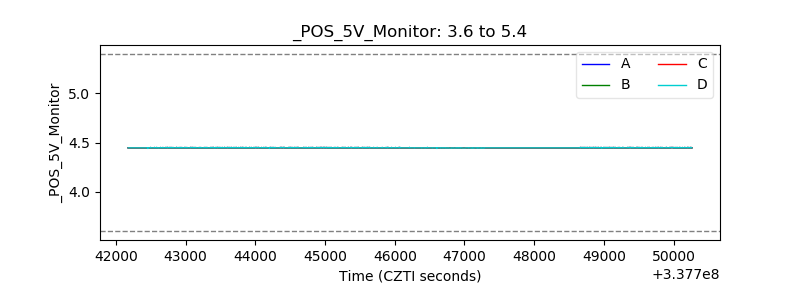 |
| _ROLL_ROT | 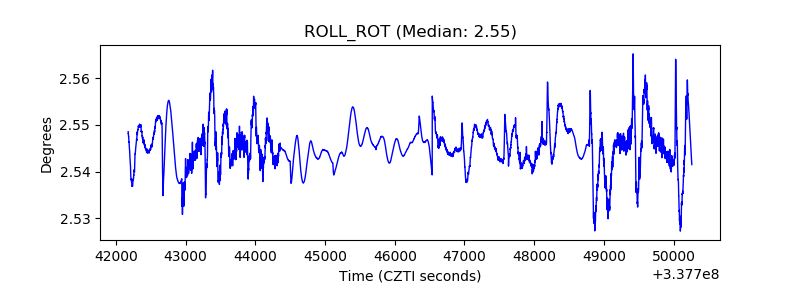 |
| _Roll_DEC | 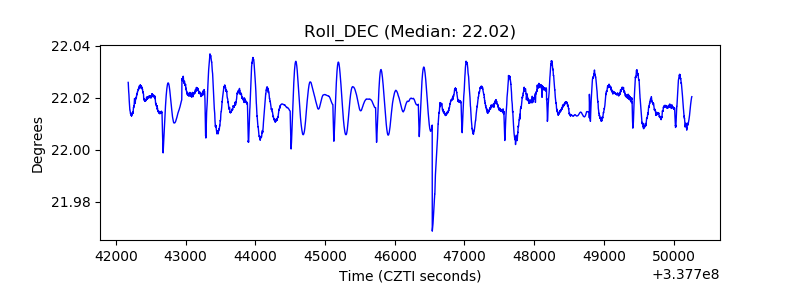 |
| _Roll_RA | 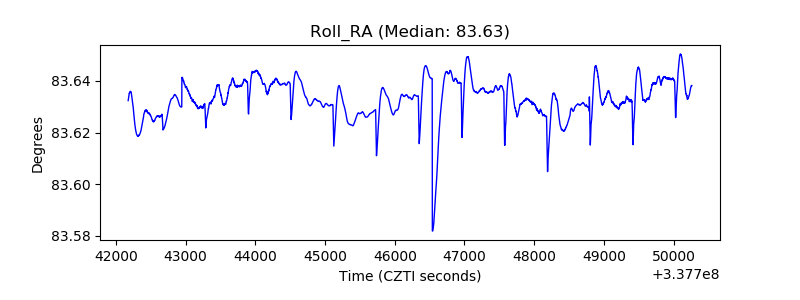 |
| Veto Counter | 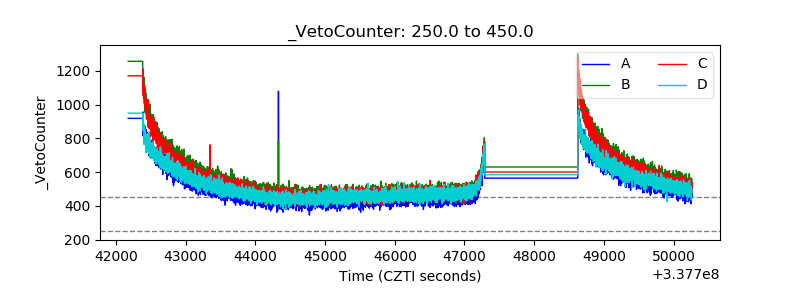 |