| Param | Original file | Final file |
|---|---|---|
| Filename | modeM0/AS1A09_145T01_9000003866_26837cztM0_level2.evt | modeM0/AS1A09_145T01_9000003866_26837cztM0_level2_quad_clean.evt |
| Size (bytes) | 506,465,280 | 99,377,280 |
| Size | 483.0 MB | 94.8 MB |
| Events in quadrant A | 3,359,072 | 662,067 |
| Events in quadrant B | 3,738,710 | 673,382 |
| Events in quadrant C | 3,239,478 | 633,399 |
| Events in quadrant D | 4,589,298 | 616,653 |
| Mode M9 | |||
|---|---|---|---|
| Quadrant | BADHDUFLAG | Total packets | Discarded packets |
| A | 0 | 13 | 0 |
| B | 0 | 13 | 0 |
| C | 0 | 13 | 0 |
| D | 0 | 13 | 0 |
| Mode M0 | |||
|---|---|---|---|
| Quadrant | BADHDUFLAG | Total packets | Discarded packets |
| A | 0 | 13484 | 0 |
| B | 0 | 14843 | 0 |
| C | 0 | 13002 | 0 |
| D | 0 | 17609 | 0 |
| Quadrant | Total seconds | Saturated seconds | Saturation percentage |
|---|---|---|---|
| A | 6073 | 47 | 0.773917% |
| B | 6074 | 107 | 1.761607% |
| C | 6074 | 81 | 1.333553% |
| D | 6074 | 224 | 3.687850% |
Noise dominated data is calculated using 1-second bins in cleaned event files. If a bin has >2000 counts, and if more than 50% of those come from <1% of pixels, then it is considered to be noise-dominated and hence unusable.
| Quadrant | # 1 sec bins | Bins with >0 counts | Bins with >2000 counts | High rate bins dominated by noise | Noise dominated (total time) | Noise dominated (detector-on time) | Marked lightcurve |
|---|---|---|---|---|---|---|---|
| A | 7418 | 6075 | 1 | 1 | 0.01% | 0.02% | 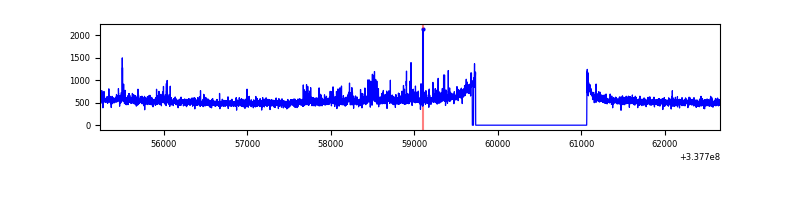 |
| B | 7419 | 6076 | 35 | 35 | 0.47% | 0.58% | 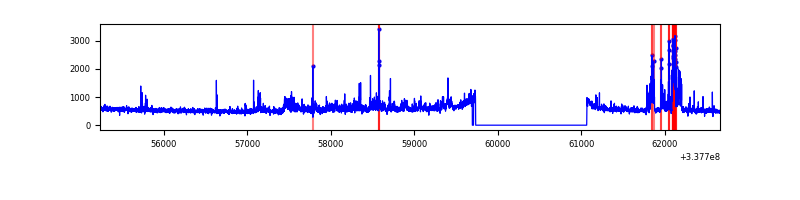 |
| C | 7419 | 6076 | 1 | 1 | 0.01% | 0.02% | 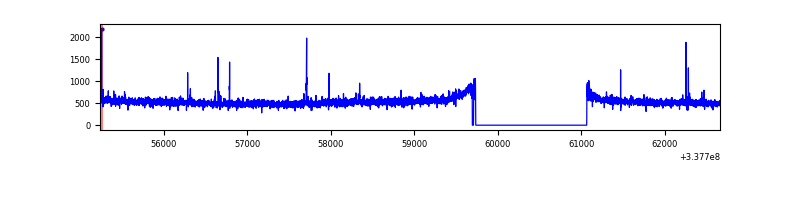 |
| D | 7419 | 6076 | 185 | 185 | 2.49% | 3.04% | 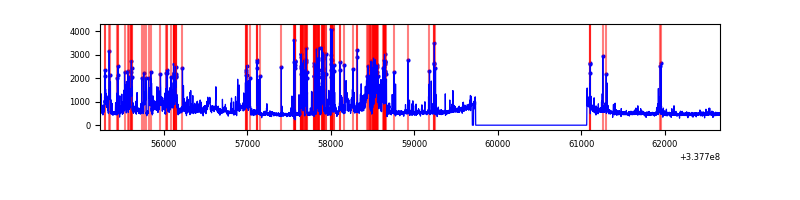 |
Top three noisy pixels from each quadrant. If the there are fewer than three noisy pixels in the level2.evt file, extra rows are filled as -1
| Pixel properties | Quadrant properties | ||||||
|---|---|---|---|---|---|---|---|
| Quadrant | DetID | PixID | Counts | Sigma | Mean | Median | Sigma |
| A | 0 | 13 | 159589 | 962.96 | 827 | 816 | 164.9 |
| A | 13 | 254 | 8894 | 48.99 | 827 | 816 | 164.9 |
| A | 12 | 96 | 7244 | 38.99 | 827 | 816 | 164.9 |
| B | 3 | 64 | 282892 | 1838.8 | 818 | 798 | 153.4 |
| B | 0 | 189 | 161926 | 1050.29 | 818 | 798 | 153.4 |
| B | 0 | 190 | 39591 | 252.87 | 818 | 798 | 153.4 |
| C | 14 | 238 | 128725 | 703.11 | 785 | 794 | 181.9 |
| C | 15 | 208 | 26738 | 142.59 | 785 | 794 | 181.9 |
| C | 3 | 233 | 11925 | 61.18 | 785 | 794 | 181.9 |
| D | 7 | 80 | 1341876 | 7103.94 | 788 | 771 | 188.8 |
| D | 1 | 52 | 224397 | 1184.57 | 788 | 771 | 188.8 |
| D | 2 | 250 | 44349 | 230.84 | 788 | 771 | 188.8 |
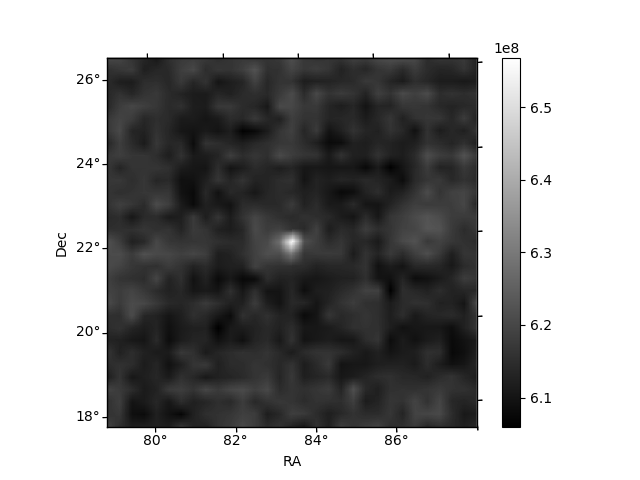
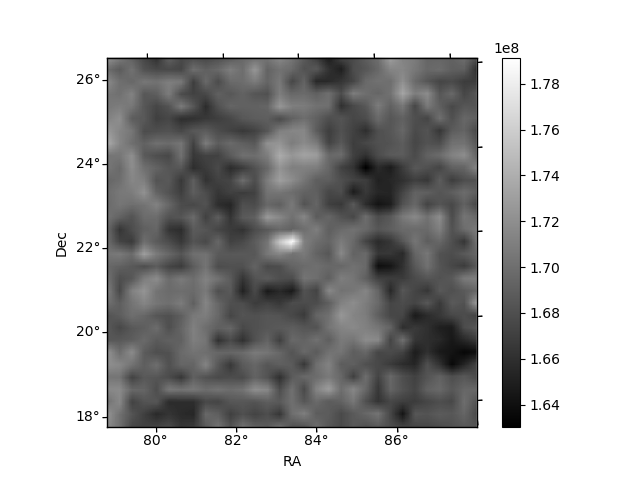
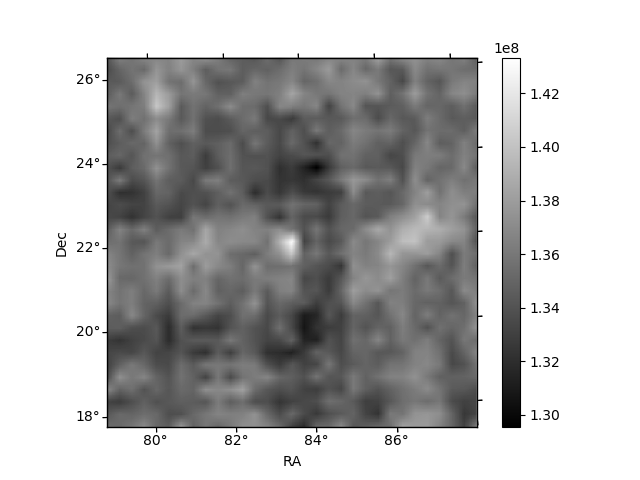
Histogram calculated using DETX and DETY for each event in the final _common_clean file
| Quadrant A | 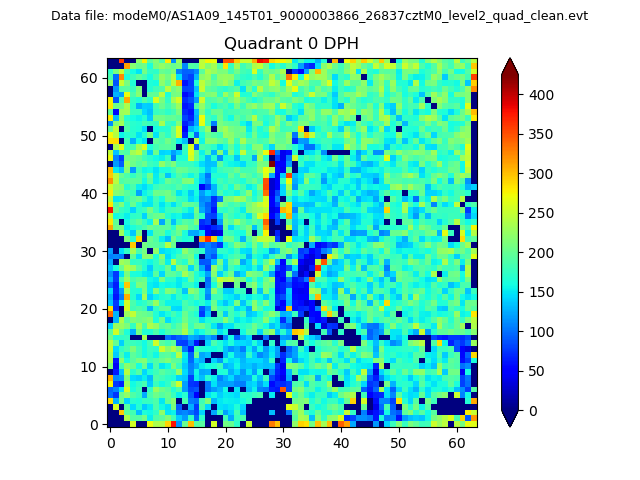 |
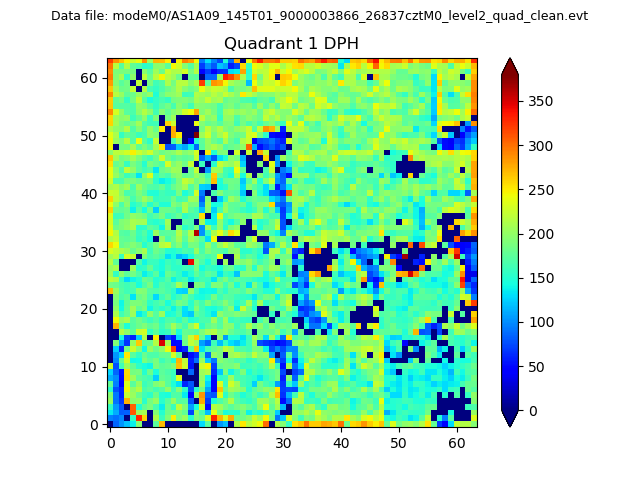 |
Quadrant B |
|---|---|---|---|
| Quadrant D |  |
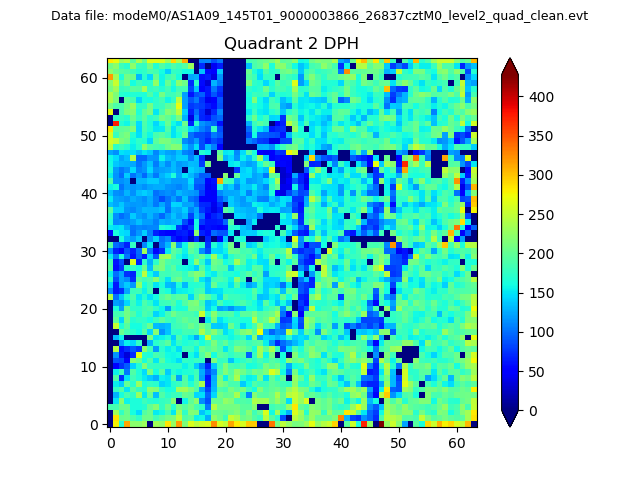 |
Quadrant C |
| Plot type | Count rate plots | Images |
|---|---|---|
| Comparison with Poisson distribution Blue bars denote a histogram of data divided into 1 sec bins. Red curve is a Poisson curve with rate = median count rate of data. |
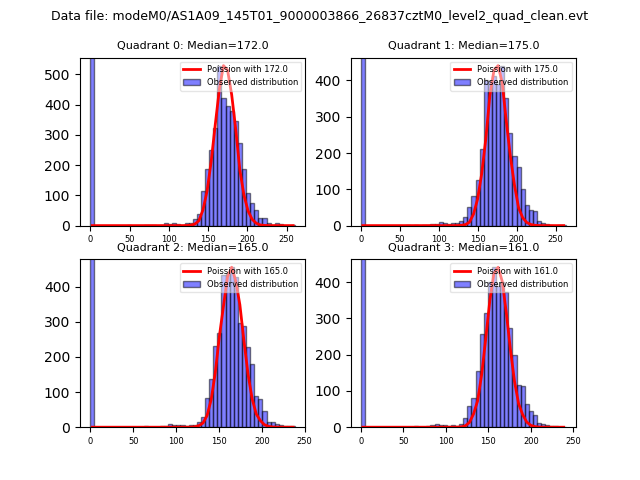 |
 |
| Quadrant-wise count rates Data is divided into 100 sec bins |
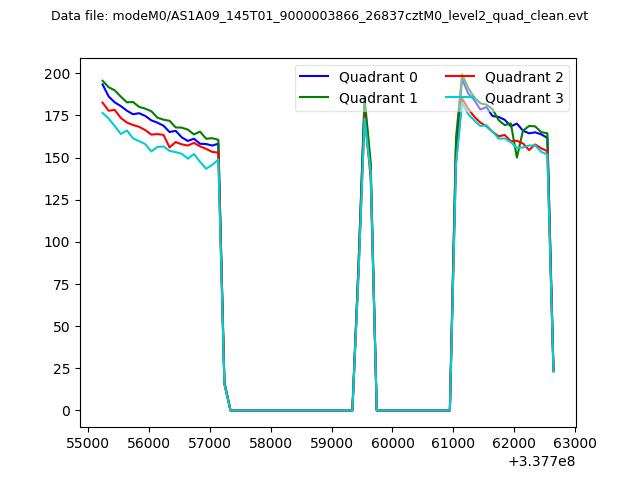 |
|
| Module-wise count rates for Quadrant A Data is divided into 100 sec bins |
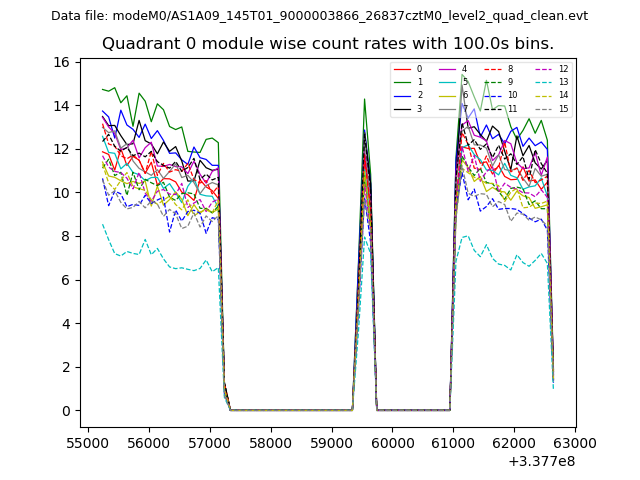 |
 |
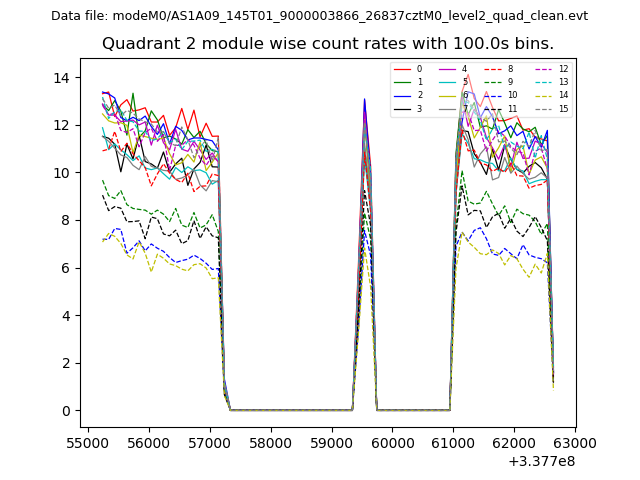
| Module-wise count rates for Quadrant B Data is divided into 100 sec bins |
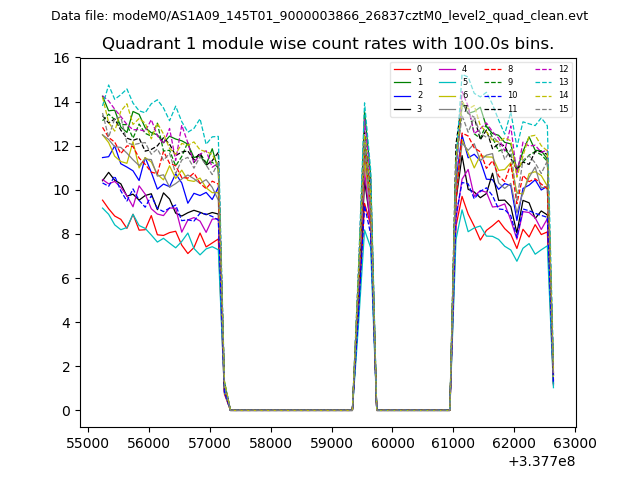 |
 |
| Module-wise count rates for Quadrant C Data is divided into 100 sec bins |
 |
 |
| Module-wise count rates for Quadrant D Data is divided into 100 sec bins |
 |
 |
| Parameter | Plot |
|---|---|
| CZT HV Monitor | 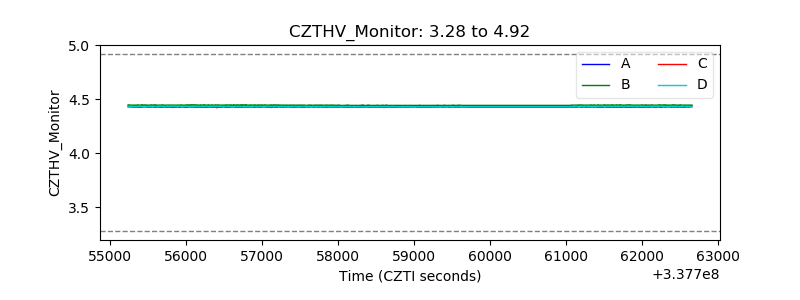 |
| D_VDD | 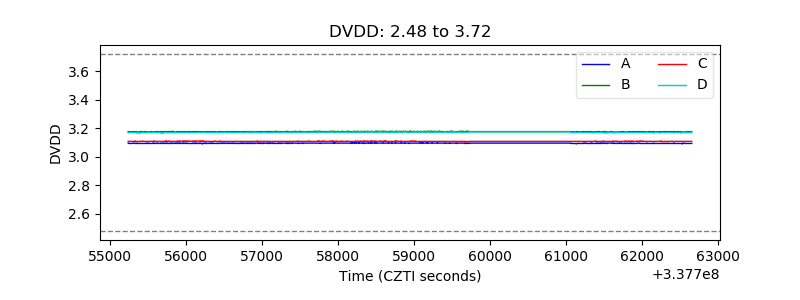 |
| Temperature 1 | 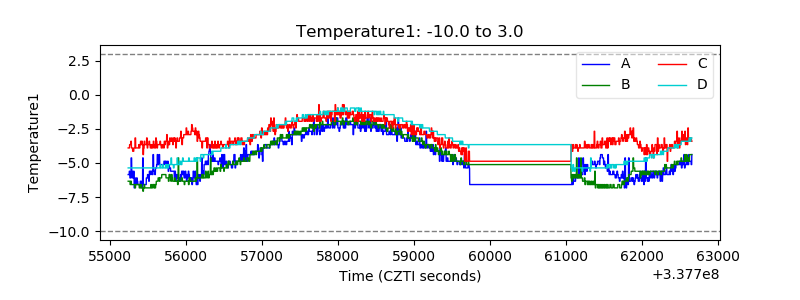 |
| Veto HV Monitor | 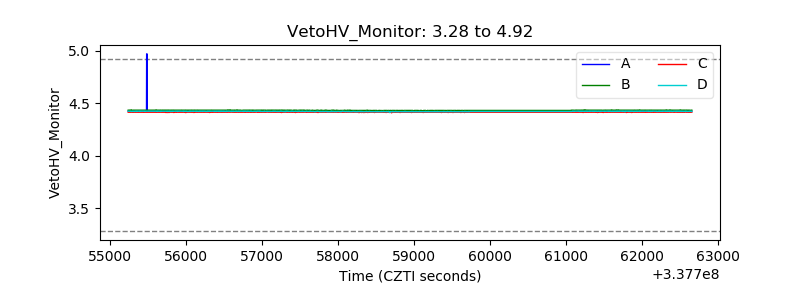 |
| Veto LLD | 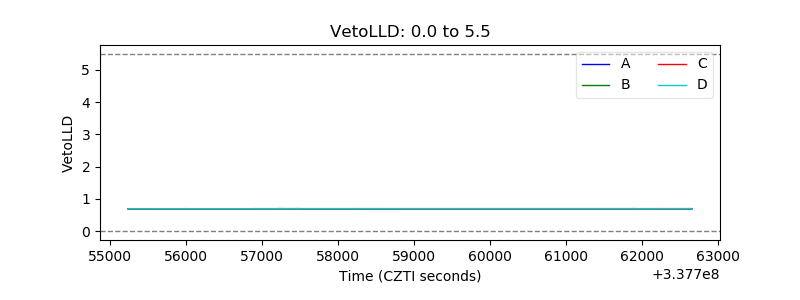 |
| Alpha Counter | 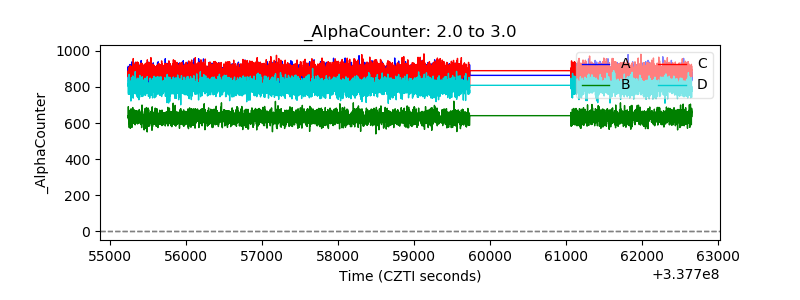 |
| _CPM_Rate | 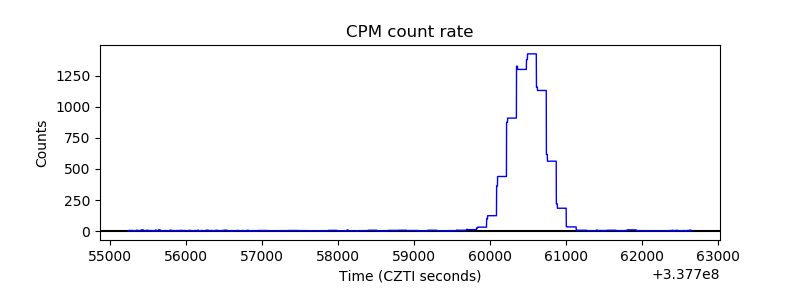 |
| CZT Counter | 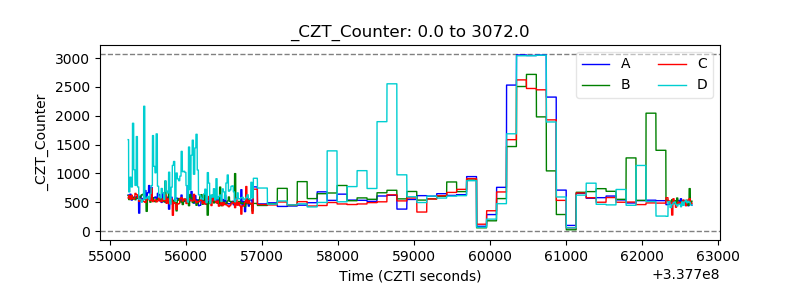 |
| +2.5 Volts monitor | 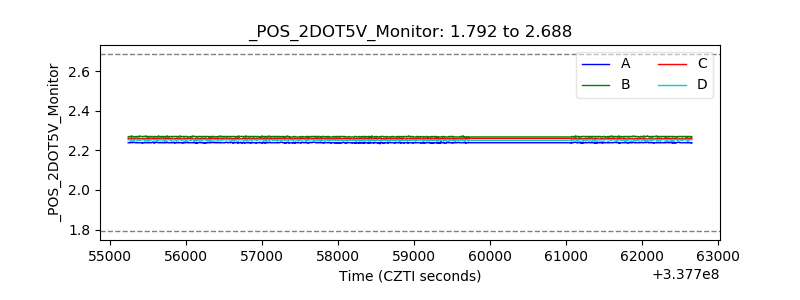 |
| +5 Volts monitor | 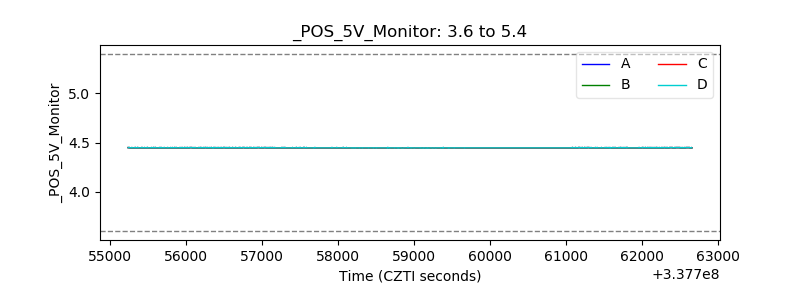 |
| _ROLL_ROT | 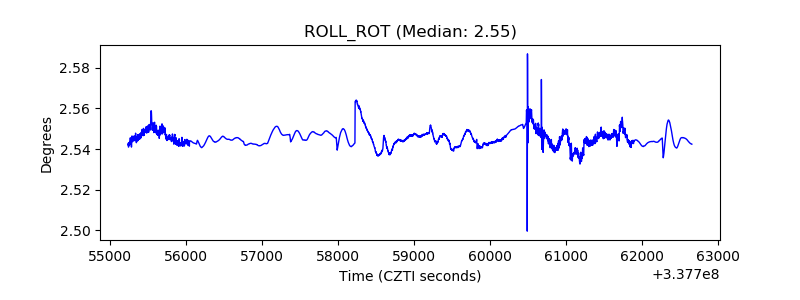 |
| _Roll_DEC | 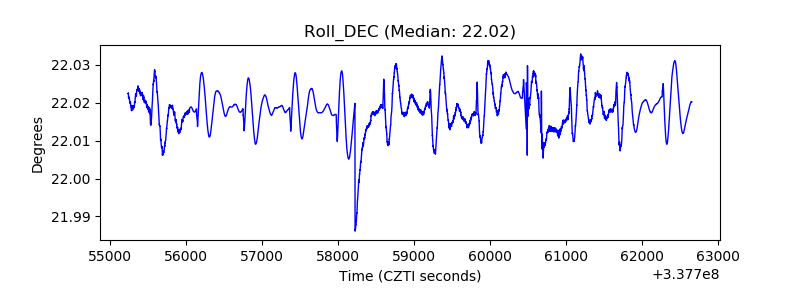 |
| _Roll_RA | 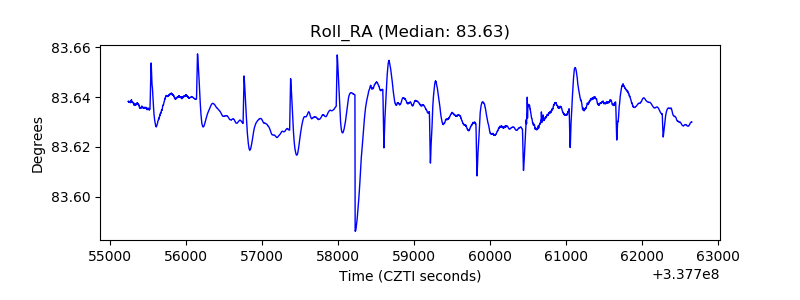 |
| Veto Counter | 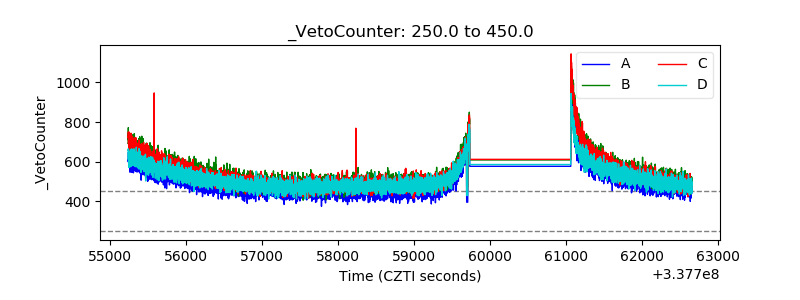 |