| Param | Original file | Final file |
|---|---|---|
| Filename | modeM0/AS1A09_145T01_9000003866_26838cztM0_level2.evt | modeM0/AS1A09_145T01_9000003866_26838cztM0_level2_quad_clean.evt |
| Size (bytes) | 501,678,720 | 90,979,200 |
| Size | 478.4 MB | 86.8 MB |
| Events in quadrant A | 3,143,635 | 600,880 |
| Events in quadrant B | 3,700,321 | 605,691 |
| Events in quadrant C | 3,087,845 | 577,263 |
| Events in quadrant D | 4,859,619 | 557,099 |
| Mode M9 | |||
|---|---|---|---|
| Quadrant | BADHDUFLAG | Total packets | Discarded packets |
| A | 0 | 12 | 0 |
| B | 0 | 12 | 0 |
| C | 0 | 12 | 0 |
| D | 0 | 12 | 0 |
| Mode M0 | |||
|---|---|---|---|
| Quadrant | BADHDUFLAG | Total packets | Discarded packets |
| A | 0 | 12745 | 0 |
| B | 0 | 14516 | 0 |
| C | 0 | 12633 | 0 |
| D | 0 | 18358 | 0 |
| Quadrant | Total seconds | Saturated seconds | Saturation percentage |
|---|---|---|---|
| A | 5929 | 57 | 0.961376% |
| B | 5930 | 183 | 3.086003% |
| C | 5930 | 81 | 1.365936% |
| D | 5930 | 364 | 6.138280% |
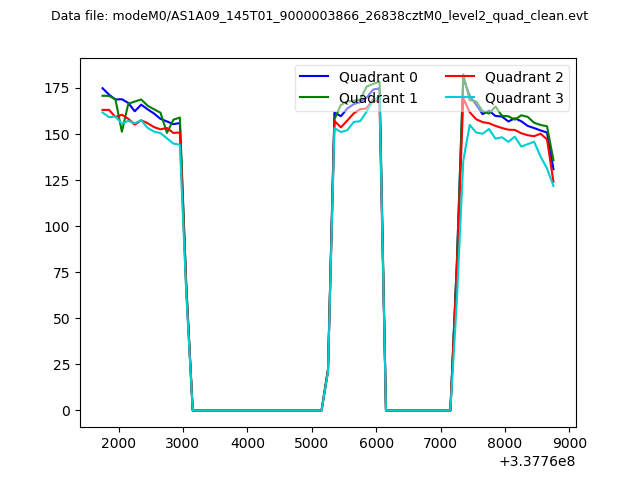
Noise dominated data is calculated using 1-second bins in cleaned event files. If a bin has >2000 counts, and if more than 50% of those come from <1% of pixels, then it is considered to be noise-dominated and hence unusable.
| Quadrant | # 1 sec bins | Bins with >0 counts | Bins with >2000 counts | High rate bins dominated by noise | Noise dominated (total time) | Noise dominated (detector-on time) | Marked lightcurve |
|---|---|---|---|---|---|---|---|
| A | 7089 | 5930 | 0 | 0 | 0.00% | 0.00% | 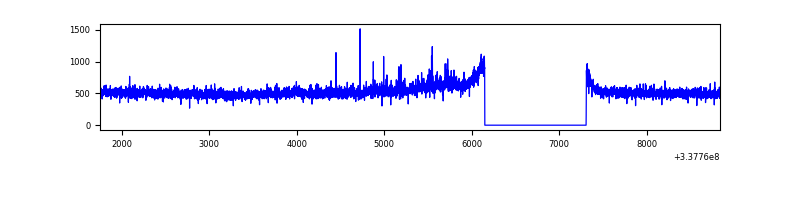 |
| B | 7090 | 5931 | 81 | 81 | 1.14% | 1.37% | 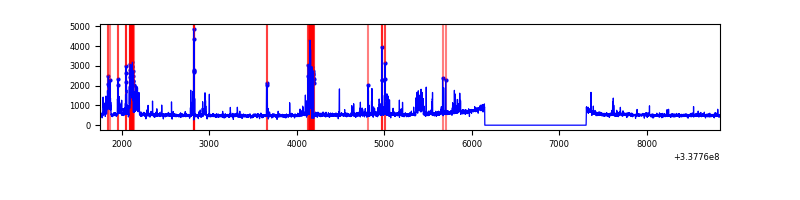 |
| C | 7090 | 5931 | 2 | 2 | 0.03% | 0.03% | 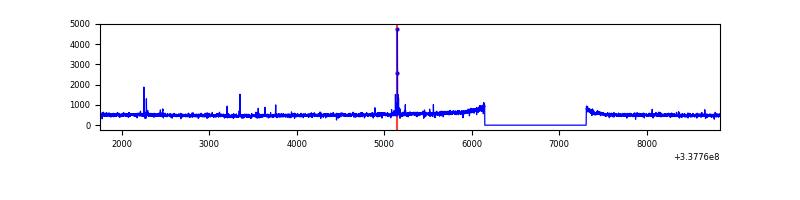 |
| D | 7090 | 5931 | 252 | 252 | 3.55% | 4.25% | 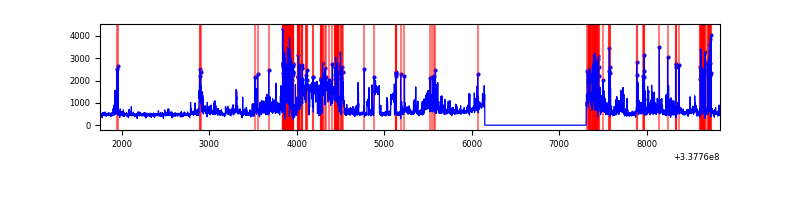 |
Top three noisy pixels from each quadrant. If the there are fewer than three noisy pixels in the level2.evt file, extra rows are filled as -1
| Pixel properties | Quadrant properties | ||||||
|---|---|---|---|---|---|---|---|
| Quadrant | DetID | PixID | Counts | Sigma | Mean | Median | Sigma |
| A | 0 | 13 | 58113 | 354.71 | 795 | 783 | 161.6 |
| A | 7 | 192 | 22392 | 133.7 | 795 | 783 | 161.6 |
| A | 13 | 254 | 8455 | 47.47 | 795 | 783 | 161.6 |
| B | 3 | 64 | 546262 | 3721.88 | 775 | 760 | 146.6 |
| B | 10 | 246 | 52983 | 356.31 | 775 | 760 | 146.6 |
| B | 7 | 205 | 44575 | 298.94 | 775 | 760 | 146.6 |
| C | 14 | 238 | 121340 | 686.29 | 750 | 756 | 175.7 |
| C | 15 | 208 | 33942 | 188.87 | 750 | 756 | 175.7 |
| C | 2 | 16 | 8592 | 44.6 | 750 | 756 | 175.7 |
| D | 1 | 52 | 1048812 | 5831.32 | 747 | 731 | 179.7 |
| D | 7 | 80 | 915362 | 5088.83 | 747 | 731 | 179.7 |
| D | 2 | 250 | 54135 | 297.13 | 747 | 731 | 179.7 |
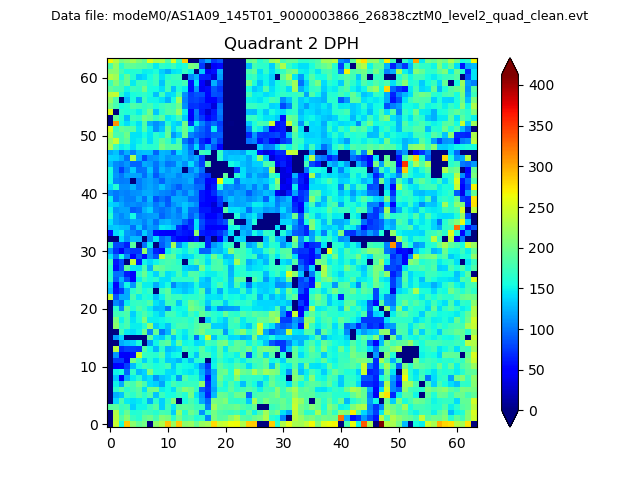
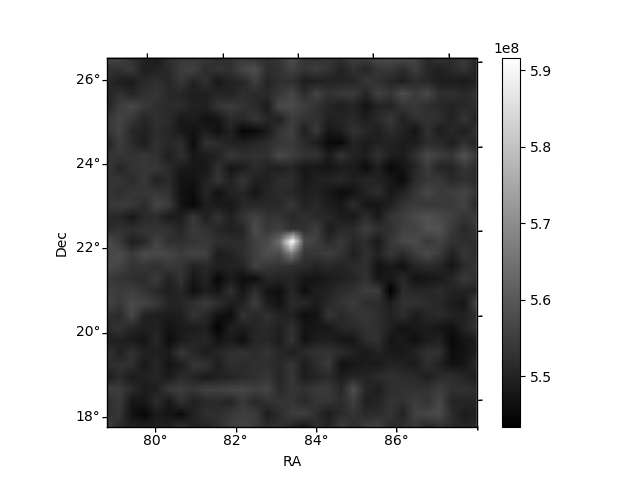
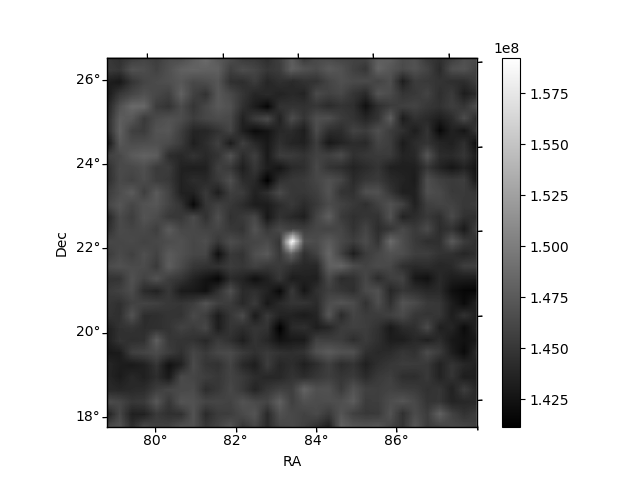
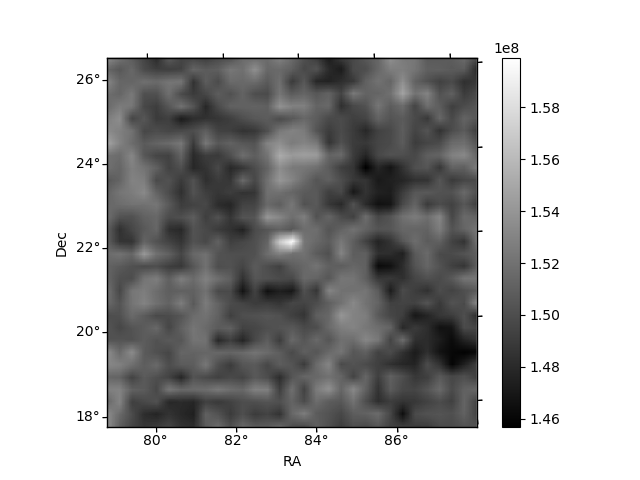
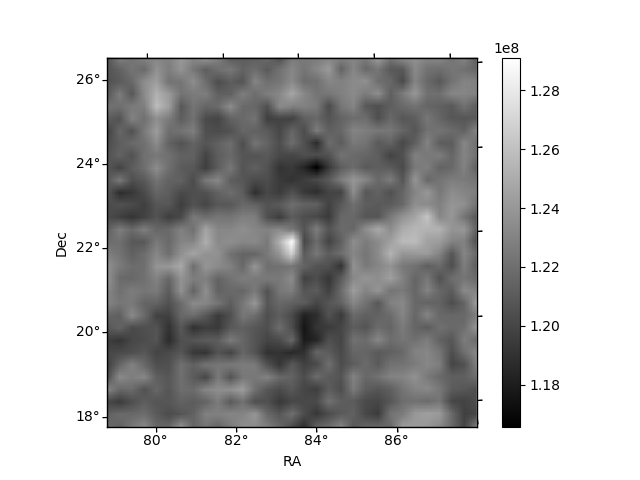
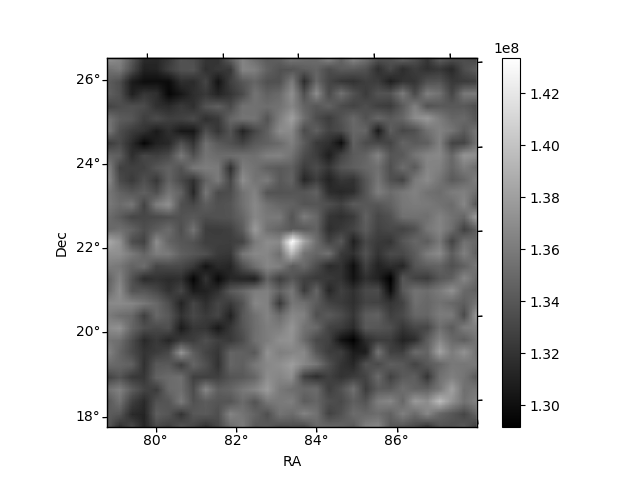
Histogram calculated using DETX and DETY for each event in the final _common_clean file
| Quadrant A | 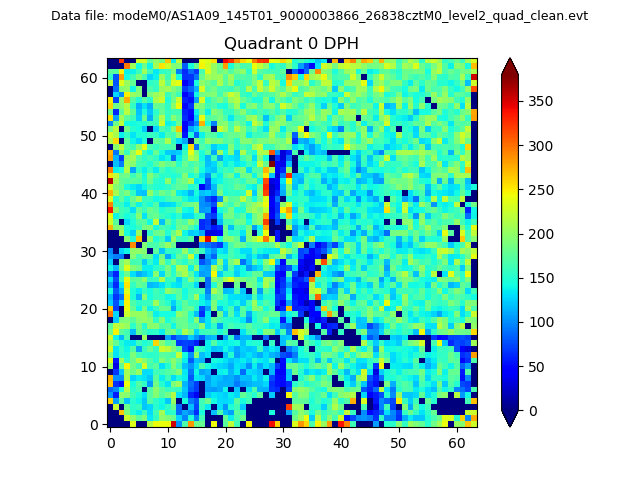 |
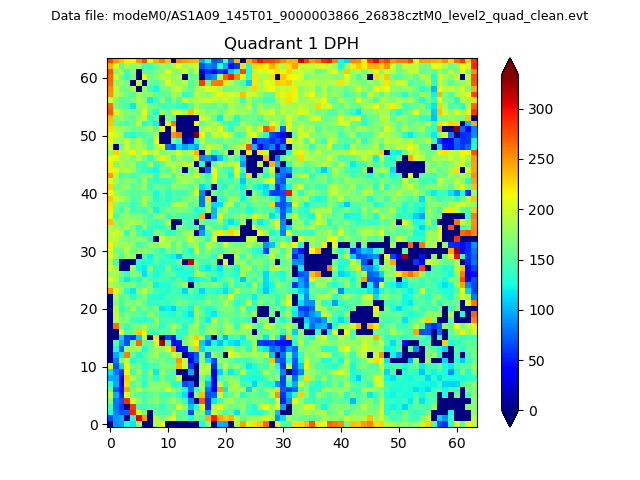 |
Quadrant B |
|---|---|---|---|
| Quadrant D | 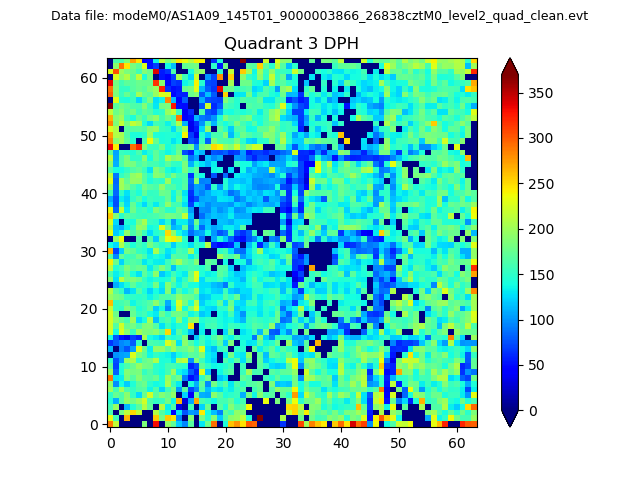 |
 |
Quadrant C |
| Plot type | Count rate plots | Images |
|---|---|---|
| Comparison with Poisson distribution Blue bars denote a histogram of data divided into 1 sec bins. Red curve is a Poisson curve with rate = median count rate of data. |
 |
 |
| Quadrant-wise count rates Data is divided into 100 sec bins |
 |
|
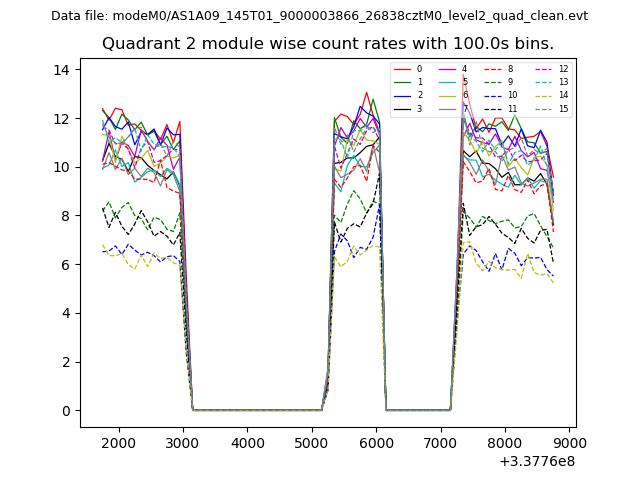
| Module-wise count rates for Quadrant A Data is divided into 100 sec bins |
 |
 |
| Module-wise count rates for Quadrant B Data is divided into 100 sec bins |
 |
 |
| Module-wise count rates for Quadrant C Data is divided into 100 sec bins |
 |
 |
| Module-wise count rates for Quadrant D Data is divided into 100 sec bins |
 |
 |
| Parameter | Plot |
|---|---|
| CZT HV Monitor | 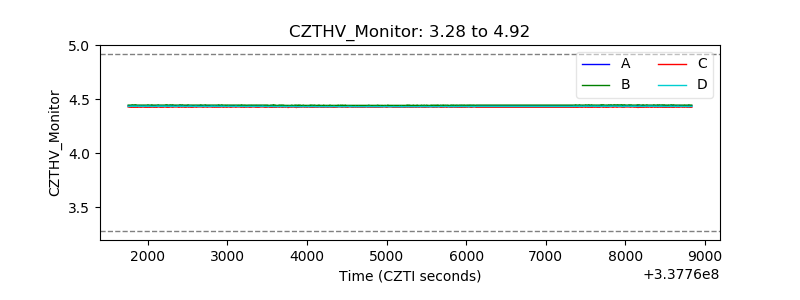 |
| D_VDD | 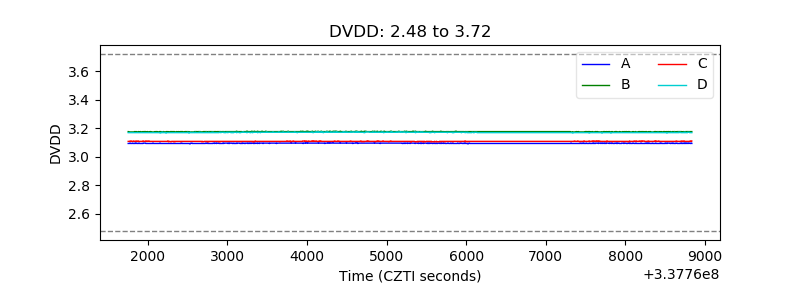 |
| Temperature 1 | 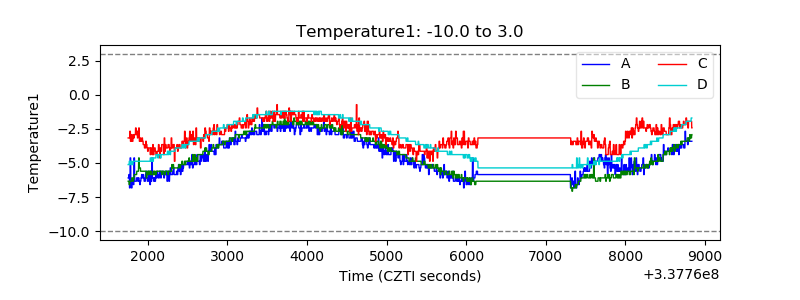 |
| Veto HV Monitor | 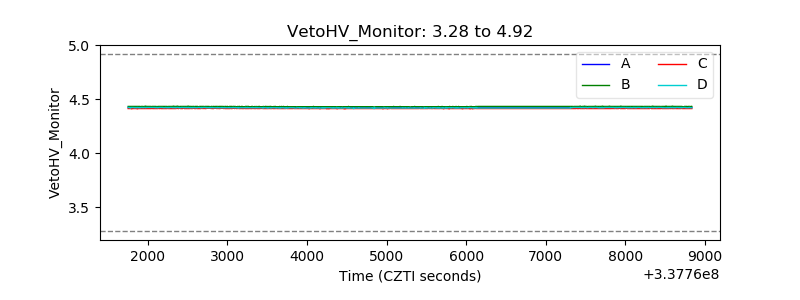 |
| Veto LLD | 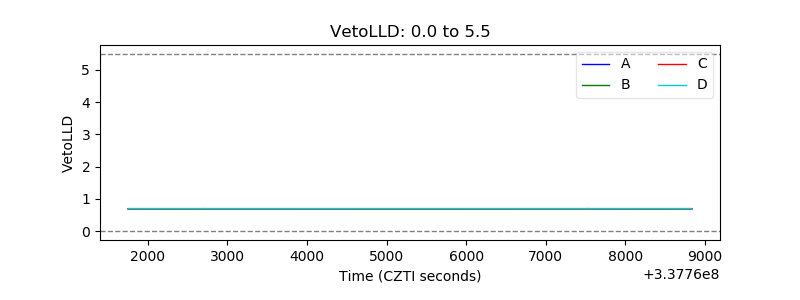 |
| Alpha Counter | 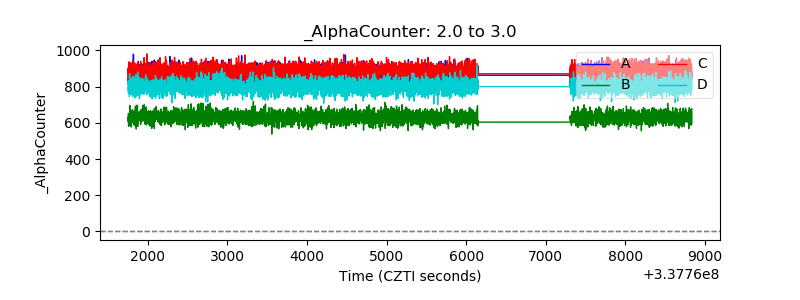 |
| _CPM_Rate | 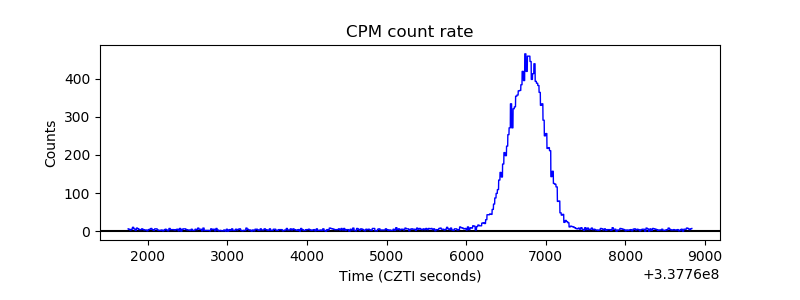 |
| CZT Counter | 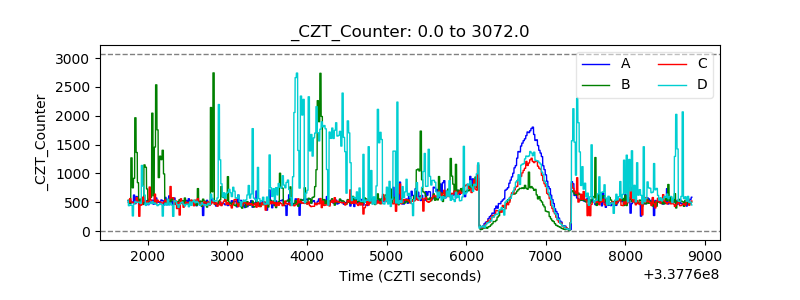 |
| +2.5 Volts monitor |  |
| +5 Volts monitor | 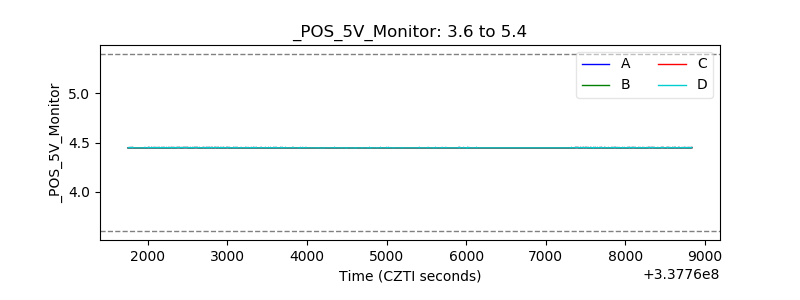 |
| _ROLL_ROT | 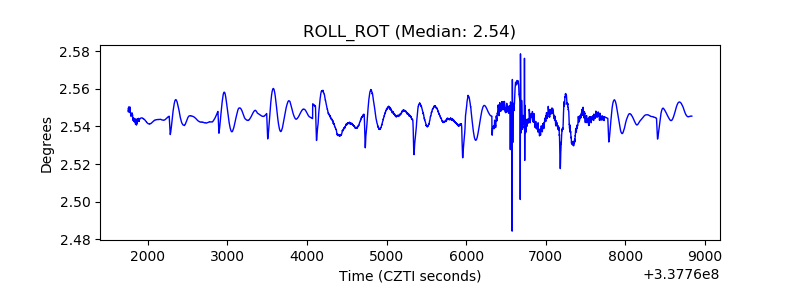 |
| _Roll_DEC | 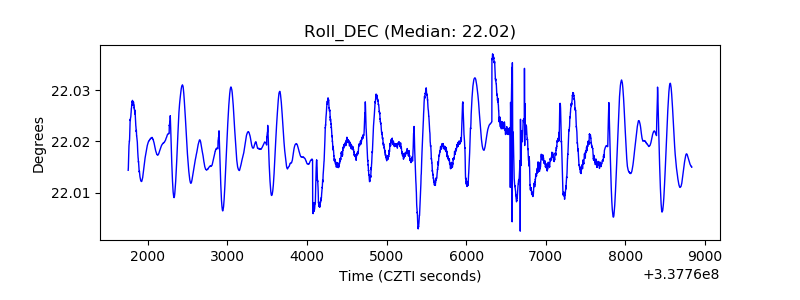 |
| _Roll_RA | 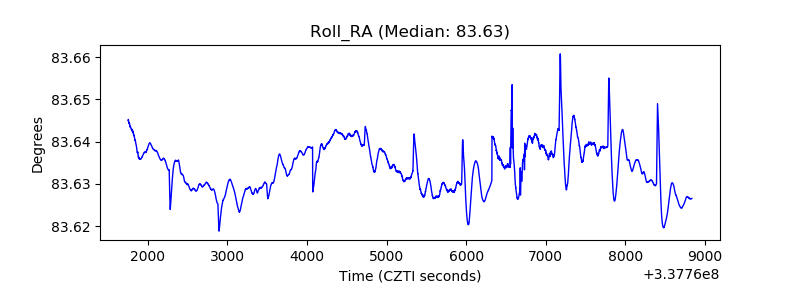 |
| Veto Counter |  |