| Param | Original file | Final file |
|---|---|---|
| Filename | modeM0/AS1A09_145T01_9000003866_26841cztM0_level2.evt | modeM0/AS1A09_145T01_9000003866_26841cztM0_level2_quad_clean.evt |
| Size (bytes) | 868,654,080 | 91,460,160 |
| Size | 828.4 MB | 87.2 MB |
| Events in quadrant A | 4,242,604 | 619,285 |
| Events in quadrant B | 7,676,987 | 473,722 |
| Events in quadrant C | 3,833,282 | 600,182 |
| Events in quadrant D | 10,035,636 | 540,881 |
| Mode M9 | |||
|---|---|---|---|
| Quadrant | BADHDUFLAG | Total packets | Discarded packets |
| A | 0 | 1 | 0 |
| B | 0 | 1 | 0 |
| C | 0 | 1 | 0 |
| D | 0 | 1 | 0 |
| Mode M0 | |||
|---|---|---|---|
| Quadrant | BADHDUFLAG | Total packets | Discarded packets |
| A | 0 | 17289 | 0 |
| B | 0 | 27688 | 0 |
| C | 0 | 15969 | 0 |
| D | 0 | 35146 | 0 |
| Quadrant | Total seconds | Saturated seconds | Saturation percentage |
|---|---|---|---|
| A | 7681 | 197 | 2.564770% |
| B | 7682 | 1687 | 21.960427% |
| C | 7682 | 239 | 3.111169% |
| D | 7681 | 2004 | 26.090353% |
Noise dominated data is calculated using 1-second bins in cleaned event files. If a bin has >2000 counts, and if more than 50% of those come from <1% of pixels, then it is considered to be noise-dominated and hence unusable.
| Quadrant | # 1 sec bins | Bins with >0 counts | Bins with >2000 counts | High rate bins dominated by noise | Noise dominated (total time) | Noise dominated (detector-on time) | Marked lightcurve |
|---|---|---|---|---|---|---|---|
| A | 7776 | 7682 | 2 | 2 | 0.03% | 0.03% | 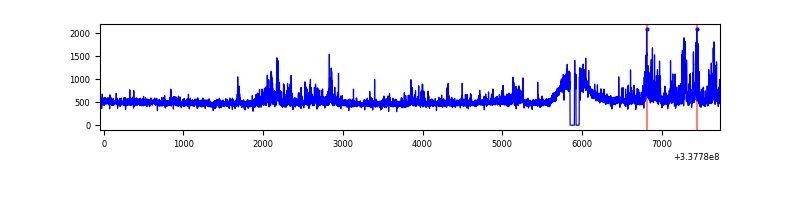 |
| B | 7777 | 7682 | 1249 | 1249 | 16.06% | 16.26% | 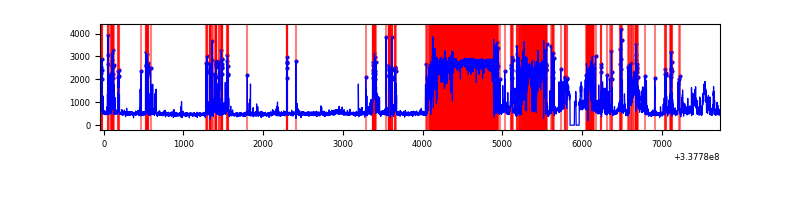 |
| C | 7777 | 7683 | 0 | 0 | 0.00% | 0.00% | 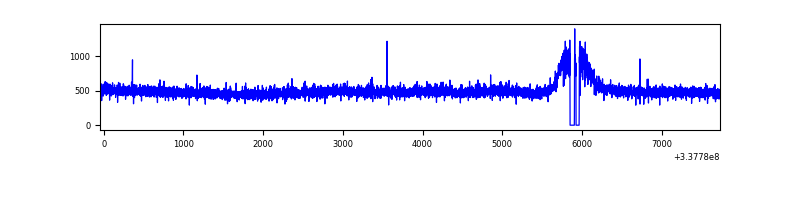 |
| D | 7776 | 7681 | 1605 | 1605 | 20.64% | 20.90% | 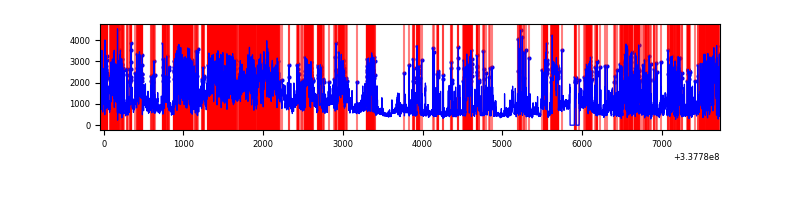 |
Top three noisy pixels from each quadrant. If the there are fewer than three noisy pixels in the level2.evt file, extra rows are filled as -1
| Pixel properties | Quadrant properties | ||||||
|---|---|---|---|---|---|---|---|
| Quadrant | DetID | PixID | Counts | Sigma | Mean | Median | Sigma |
| A | 0 | 13 | 433388 | 2164.1 | 987 | 968 | 199.8 |
| A | 13 | 254 | 12064 | 55.53 | 987 | 968 | 199.8 |
| A | 3 | 137 | 9296 | 41.68 | 987 | 968 | 199.8 |
| B | 3 | 64 | 3856284 | 23374.05 | 854 | 836 | 164.9 |
| B | 0 | 189 | 374871 | 2267.63 | 854 | 836 | 164.9 |
| B | 7 | 205 | 67446 | 403.83 | 854 | 836 | 164.9 |
| C | 14 | 238 | 148117 | 659.14 | 942 | 951 | 223.3 |
| C | 15 | 208 | 6719 | 25.83 | 942 | 951 | 223.3 |
| C | 13 | 61 | 6434 | 24.56 | 942 | 951 | 223.3 |
| D | 7 | 80 | 2928123 | 13989.29 | 866 | 845 | 209.3 |
| D | 1 | 52 | 2712153 | 12957.18 | 866 | 845 | 209.3 |
| D | 12 | 227 | 910894 | 4349.07 | 866 | 845 | 209.3 |
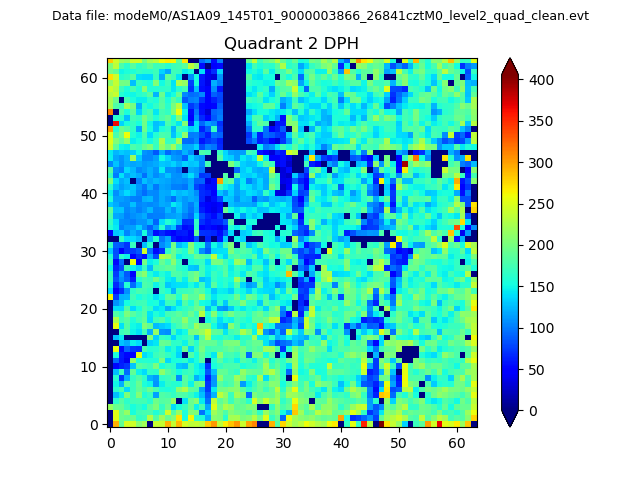
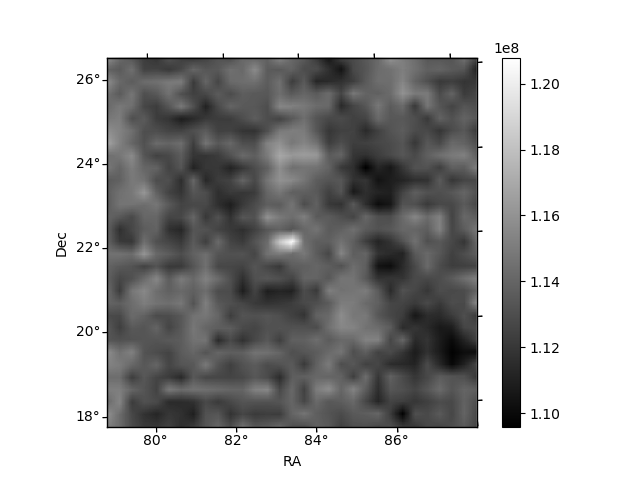
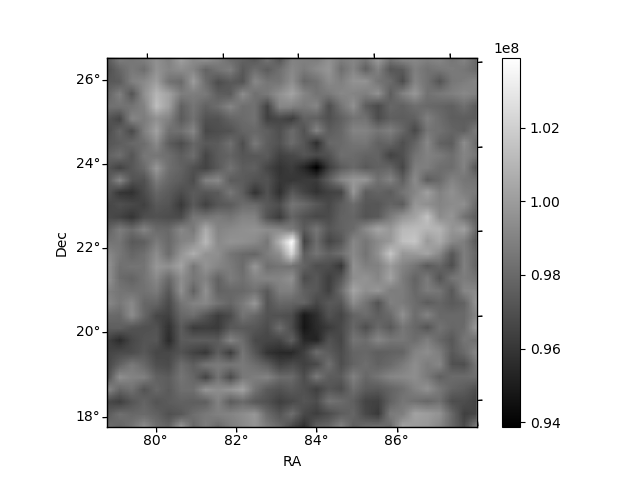
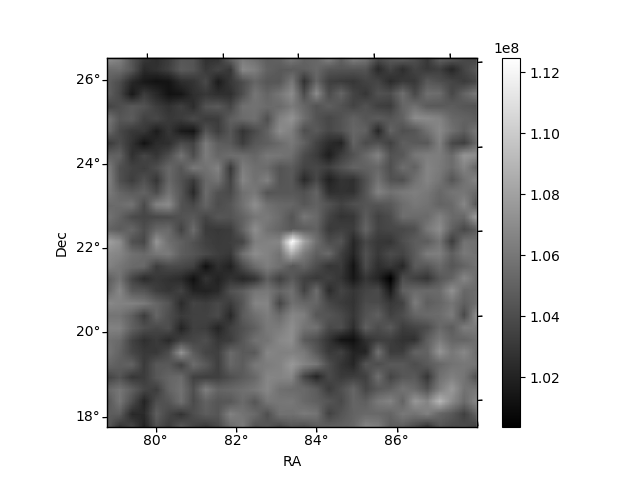
Histogram calculated using DETX and DETY for each event in the final _common_clean file
| Quadrant A | 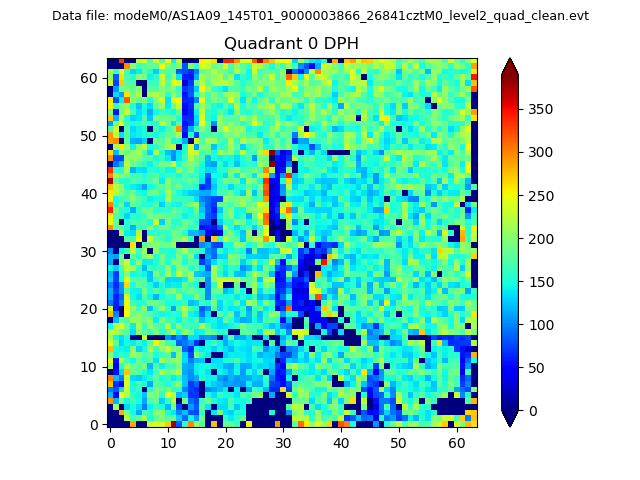 |
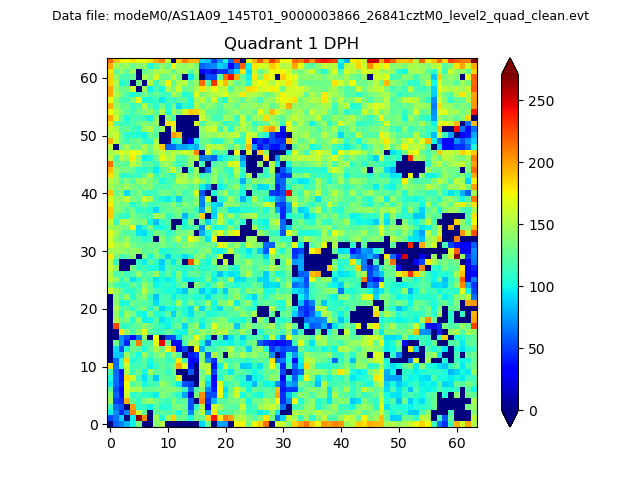 |
Quadrant B |
|---|---|---|---|
| Quadrant D | 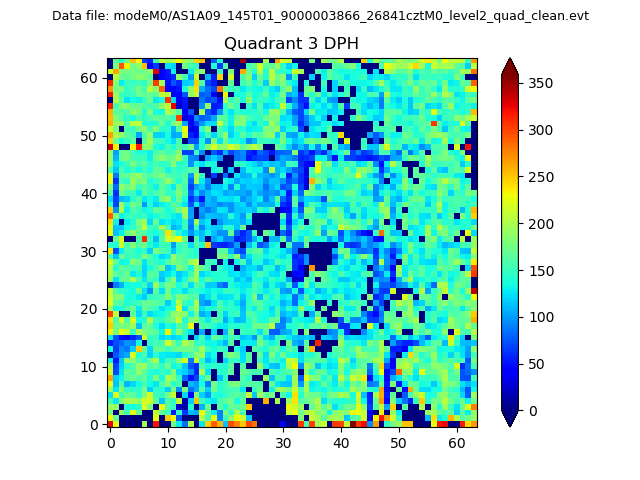 |
 |
Quadrant C |
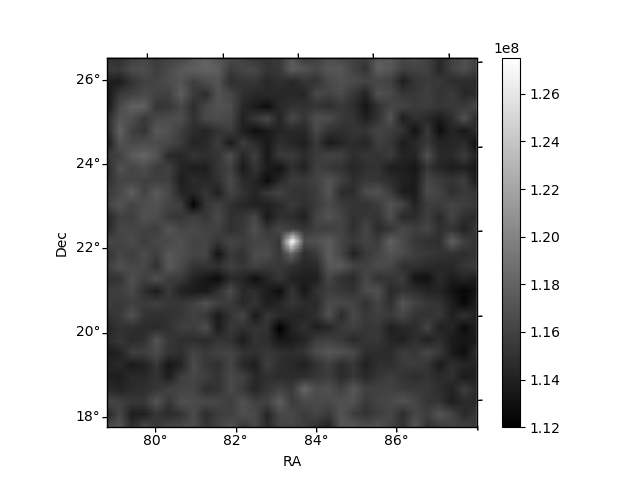
| Plot type | Count rate plots | Images |
|---|---|---|
| Comparison with Poisson distribution Blue bars denote a histogram of data divided into 1 sec bins. Red curve is a Poisson curve with rate = median count rate of data. |
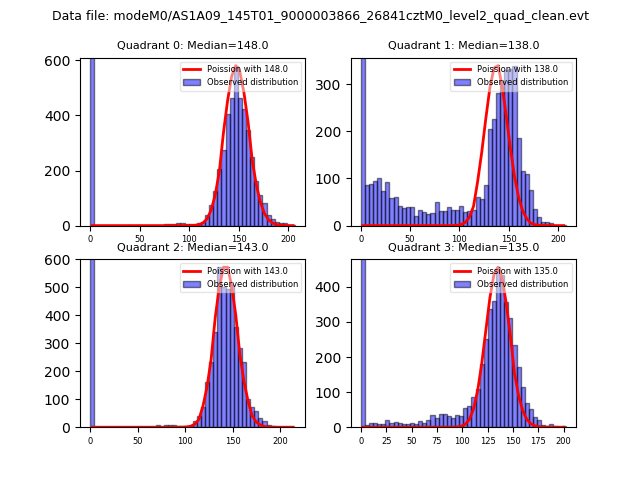 |
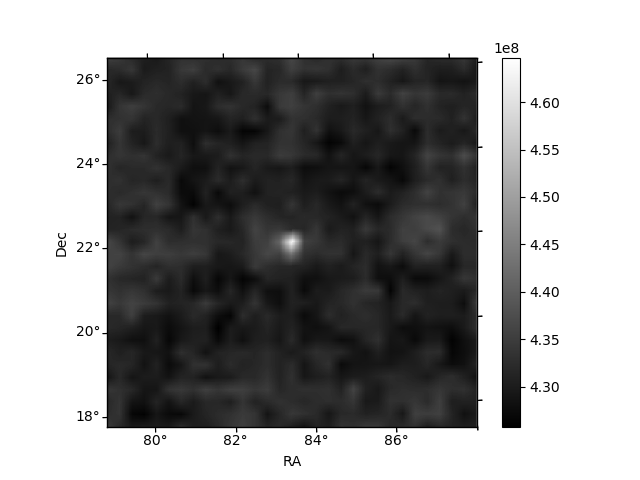 |
| Quadrant-wise count rates Data is divided into 100 sec bins |
 |
|
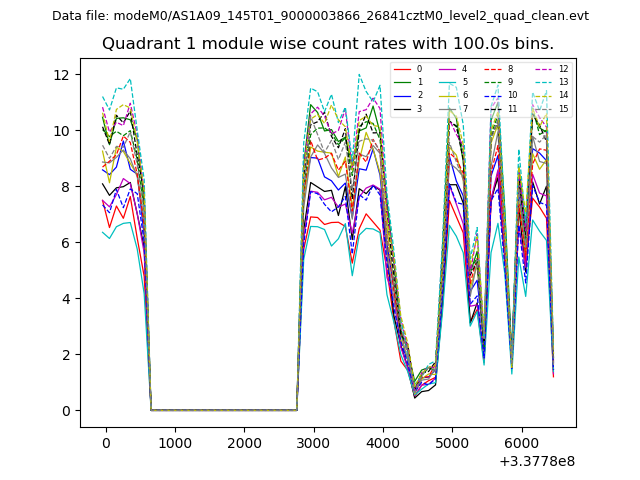
| Module-wise count rates for Quadrant A Data is divided into 100 sec bins |
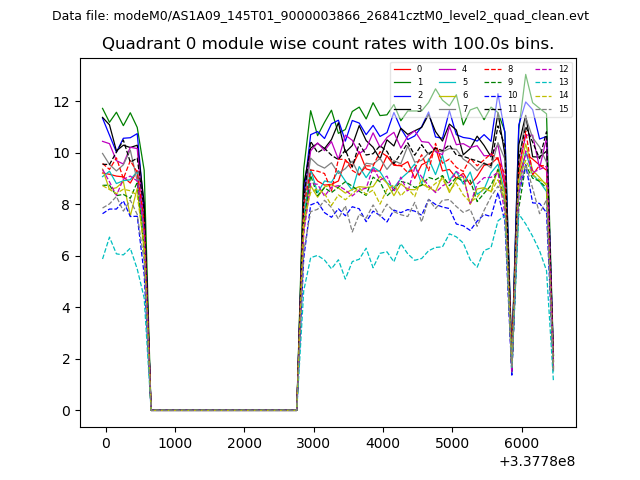 |
 |
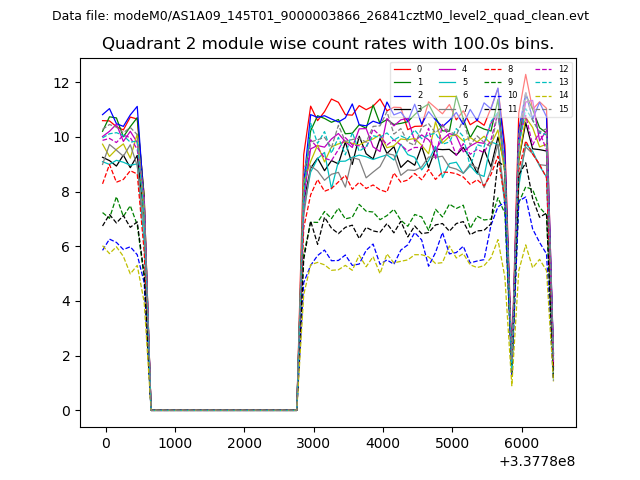
| Module-wise count rates for Quadrant B Data is divided into 100 sec bins |
 |
 |
| Module-wise count rates for Quadrant C Data is divided into 100 sec bins |
 |
 |
| Module-wise count rates for Quadrant D Data is divided into 100 sec bins |
 |
 |
| Parameter | Plot |
|---|---|
| CZT HV Monitor | 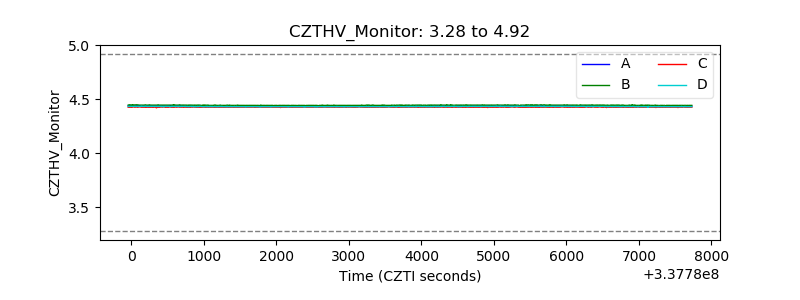 |
| D_VDD | 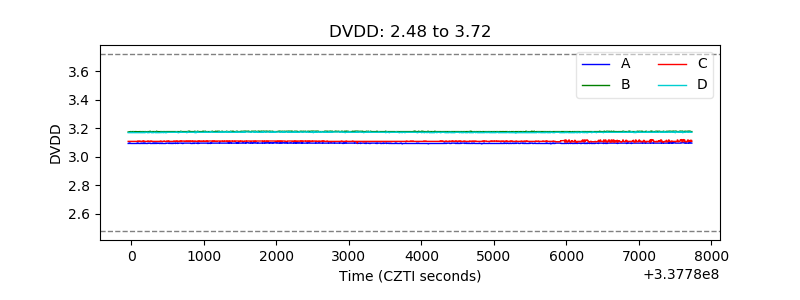 |
| Temperature 1 | 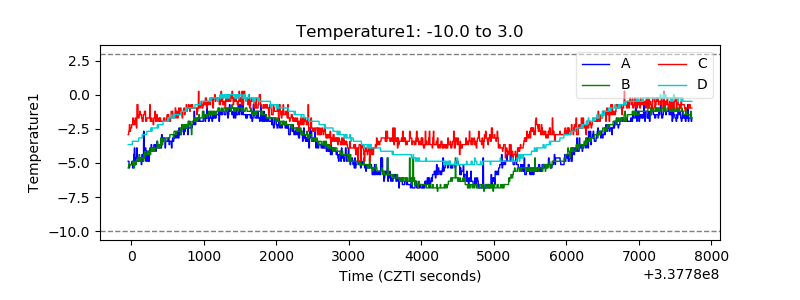 |
| Veto HV Monitor | 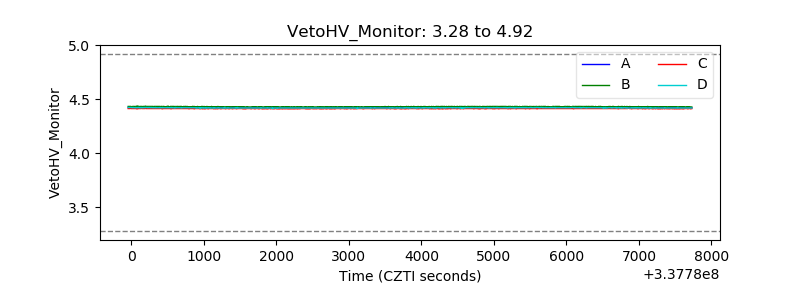 |
| Veto LLD | 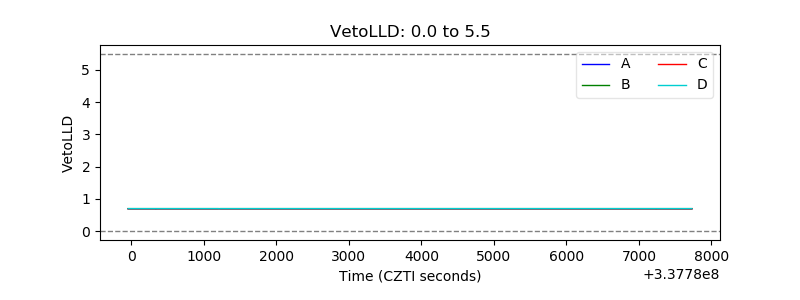 |
| Alpha Counter |  |
| _CPM_Rate | 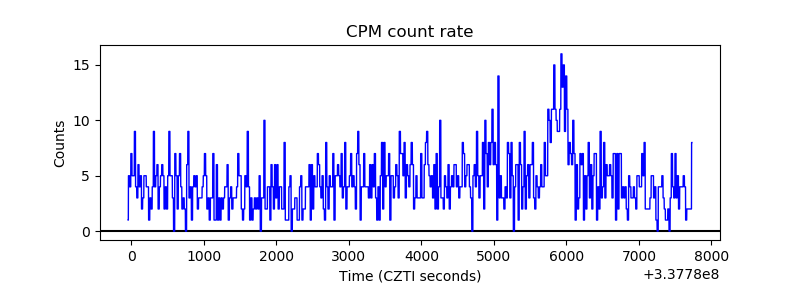 |
| CZT Counter | 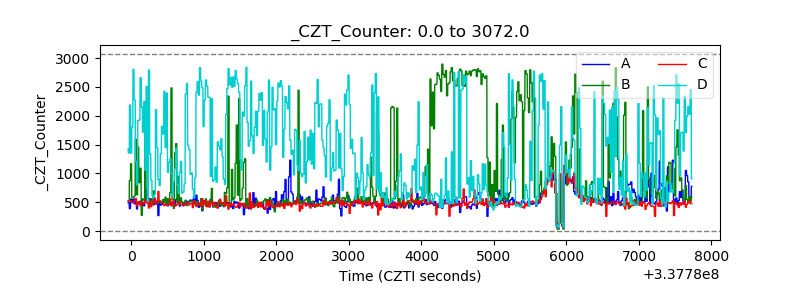 |
| +2.5 Volts monitor |  |
| +5 Volts monitor |  |
| _ROLL_ROT | 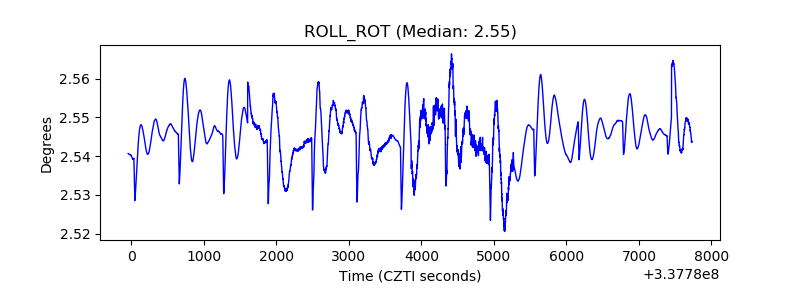 |
| _Roll_DEC | 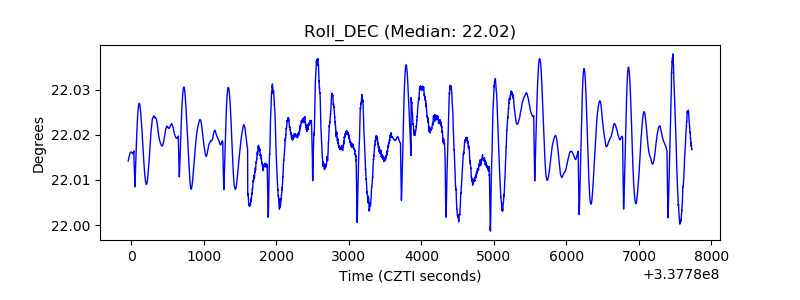 |
| _Roll_RA | 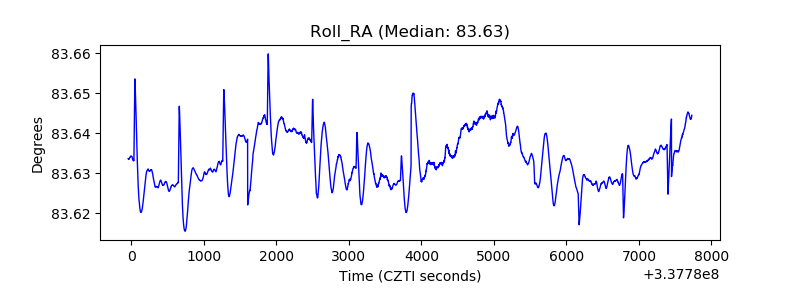 |
| Veto Counter | 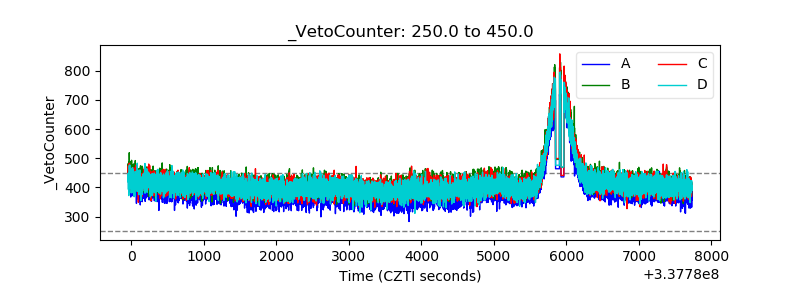 |