| Param | Original file | Final file |
|---|---|---|
| Filename | modeM0/AS1A09_145T01_9000003866_26842cztM0_level2.evt | modeM0/AS1A09_145T01_9000003866_26842cztM0_level2_quad_clean.evt |
| Size (bytes) | 839,335,680 | 85,668,480 |
| Size | 800.5 MB | 81.7 MB |
| Events in quadrant A | 5,980,349 | 542,367 |
| Events in quadrant B | 6,589,916 | 523,332 |
| Events in quadrant C | 3,801,480 | 528,859 |
| Events in quadrant D | 8,532,973 | 468,396 |
| Mode M9 | |||
|---|---|---|---|
| Quadrant | BADHDUFLAG | Total packets | Discarded packets |
| A | 0 | 3 | 0 |
| B | 0 | 3 | 0 |
| C | 0 | 3 | 0 |
| D | 0 | 3 | 0 |
| Mode M0 | |||
|---|---|---|---|
| Quadrant | BADHDUFLAG | Total packets | Discarded packets |
| A | 0 | 22829 | 0 |
| B | 0 | 24610 | 0 |
| C | 0 | 15797 | 0 |
| D | 0 | 30438 | 0 |
| Quadrant | Total seconds | Saturated seconds | Saturation percentage |
|---|---|---|---|
| A | 7626 | 374 | 4.904275% |
| B | 7626 | 744 | 9.756098% |
| C | 7626 | 143 | 1.875164% |
| D | 7626 | 1707 | 22.383950% |
Noise dominated data is calculated using 1-second bins in cleaned event files. If a bin has >2000 counts, and if more than 50% of those come from <1% of pixels, then it is considered to be noise-dominated and hence unusable.
| Quadrant | # 1 sec bins | Bins with >0 counts | Bins with >2000 counts | High rate bins dominated by noise | Noise dominated (total time) | Noise dominated (detector-on time) | Marked lightcurve |
|---|---|---|---|---|---|---|---|
| A | 7961 | 7626 | 156 | 156 | 1.96% | 2.05% | 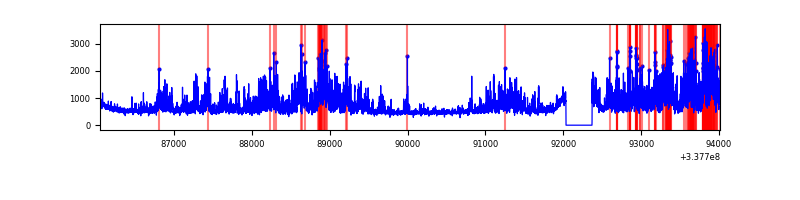 |
| B | 7961 | 7627 | 391 | 391 | 4.91% | 5.13% | 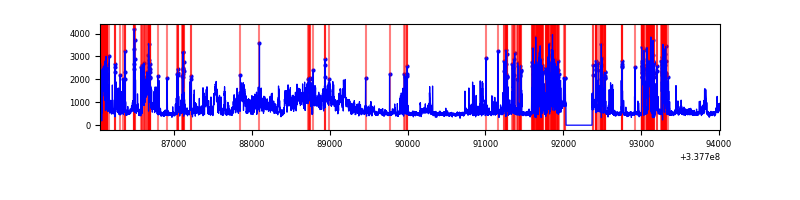 |
| C | 7961 | 7626 | 2 | 2 | 0.03% | 0.03% | 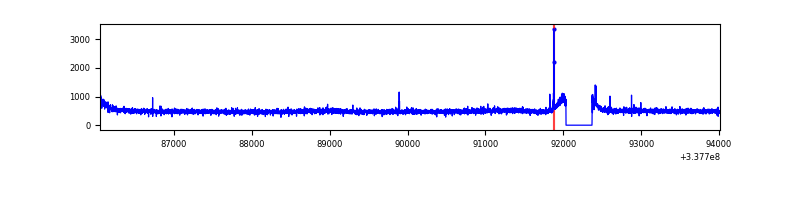 |
| D | 7961 | 7626 | 1356 | 1356 | 17.03% | 17.78% | 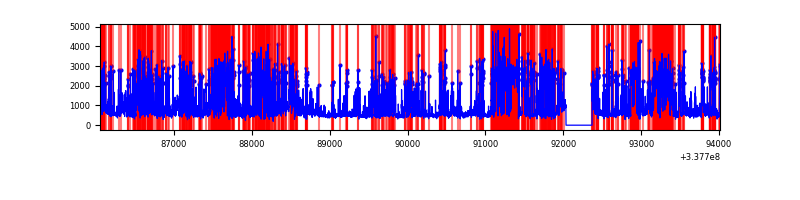 |
Top three noisy pixels from each quadrant. If the there are fewer than three noisy pixels in the level2.evt file, extra rows are filled as -1
| Pixel properties | Quadrant properties | ||||||
|---|---|---|---|---|---|---|---|
| Quadrant | DetID | PixID | Counts | Sigma | Mean | Median | Sigma |
| A | 0 | 13 | 2271816 | 11626.72 | 960 | 941 | 195.3 |
| A | 13 | 254 | 12114 | 57.2 | 960 | 941 | 195.3 |
| A | 3 | 137 | 8757 | 40.02 | 960 | 941 | 195.3 |
| B | 3 | 64 | 1544352 | 8715.77 | 922 | 899 | 177.1 |
| B | 0 | 189 | 1322128 | 7460.89 | 922 | 899 | 177.1 |
| B | 7 | 205 | 46034 | 254.87 | 922 | 899 | 177.1 |
| C | 14 | 238 | 146590 | 660.24 | 927 | 934 | 220.6 |
| C | 15 | 208 | 24802 | 108.19 | 927 | 934 | 220.6 |
| C | 8 | 128 | 11686 | 48.74 | 927 | 934 | 220.6 |
| D | 1 | 52 | 4992188 | 24480.75 | 842 | 821 | 203.9 |
| D | 2 | 250 | 239003 | 1168.19 | 842 | 821 | 203.9 |
| D | 7 | 80 | 90539 | 440.03 | 842 | 821 | 203.9 |
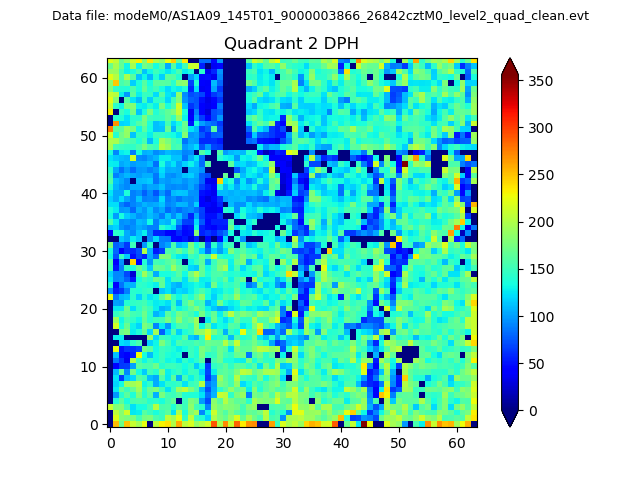
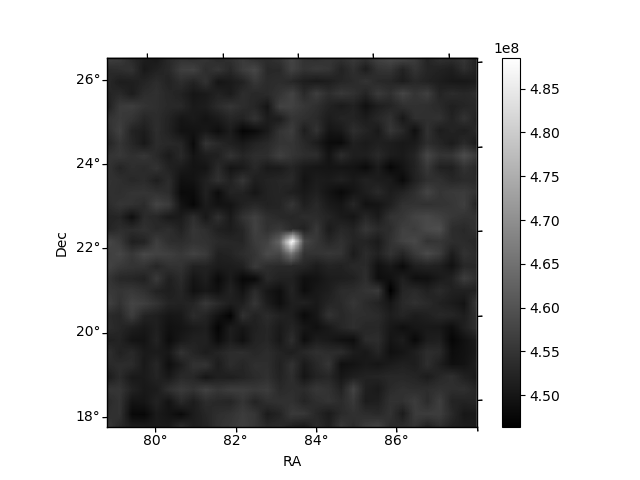
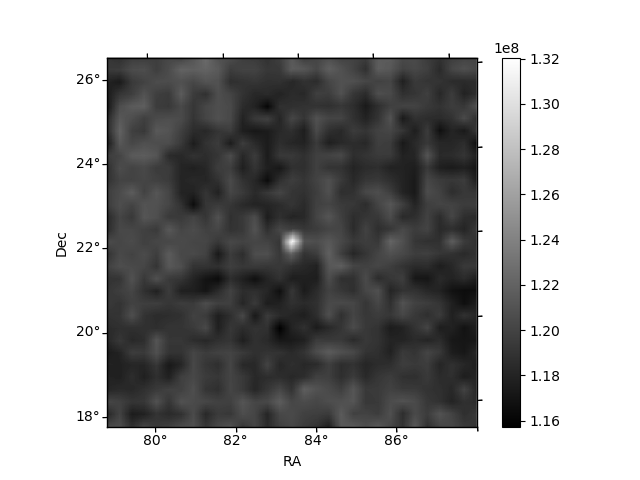
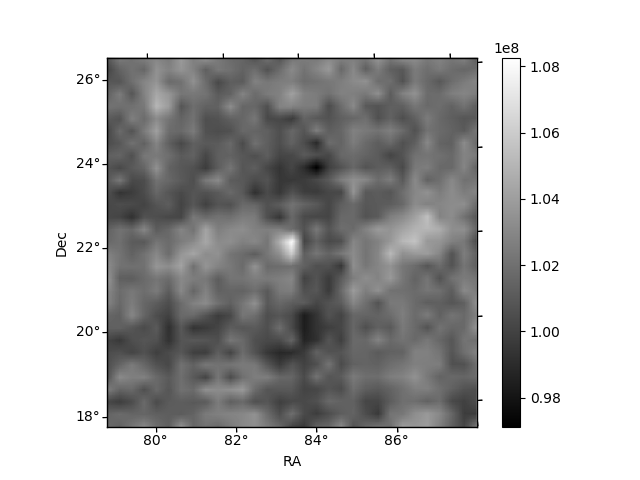
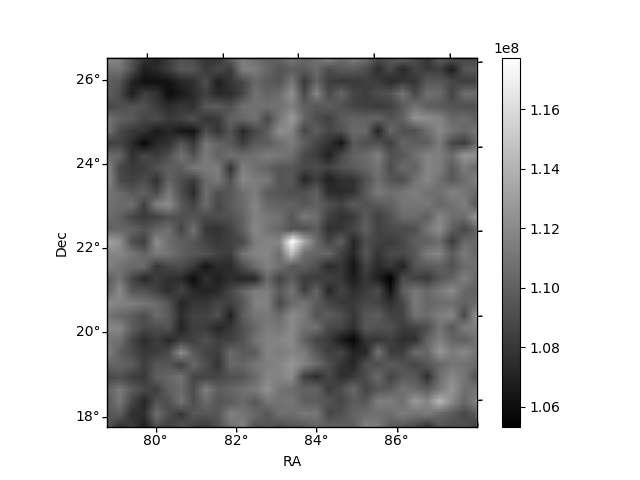
Histogram calculated using DETX and DETY for each event in the final _common_clean file
| Quadrant A | 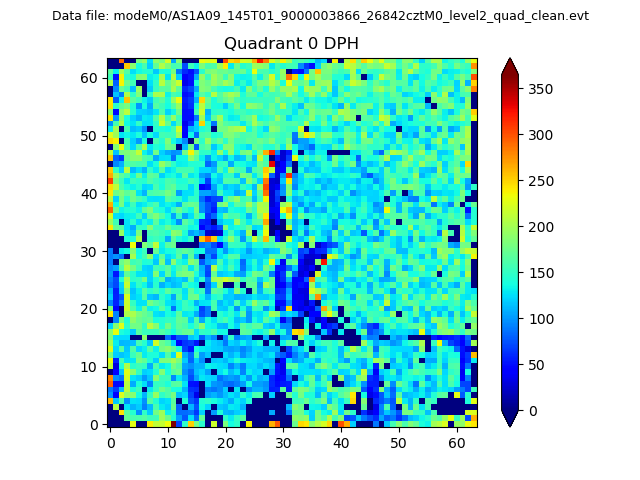 |
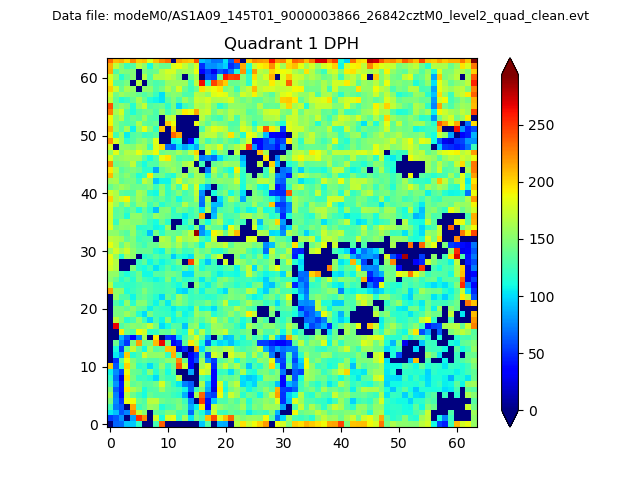 |
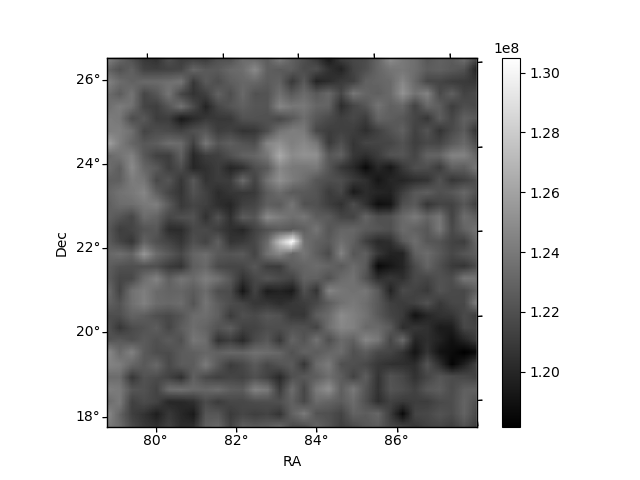
Quadrant B |
|---|---|---|---|
| Quadrant D | 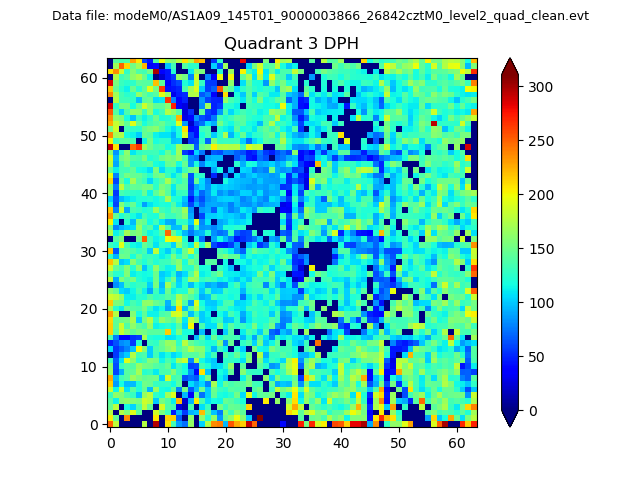 |
 |
Quadrant C |
| Plot type | Count rate plots | Images |
|---|---|---|
| Comparison with Poisson distribution Blue bars denote a histogram of data divided into 1 sec bins. Red curve is a Poisson curve with rate = median count rate of data. |
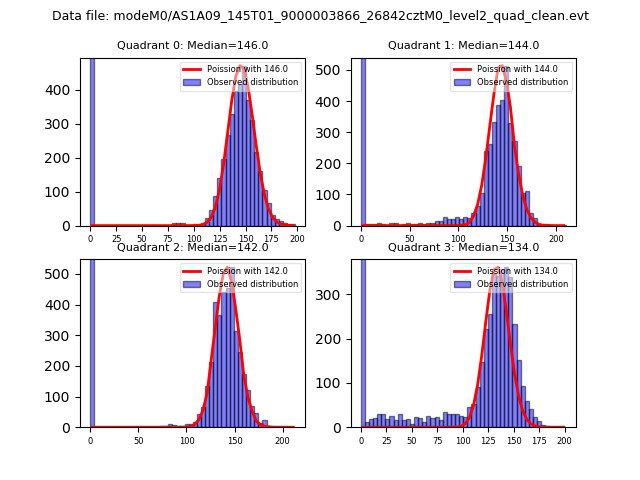 |
 |
| Quadrant-wise count rates Data is divided into 100 sec bins |
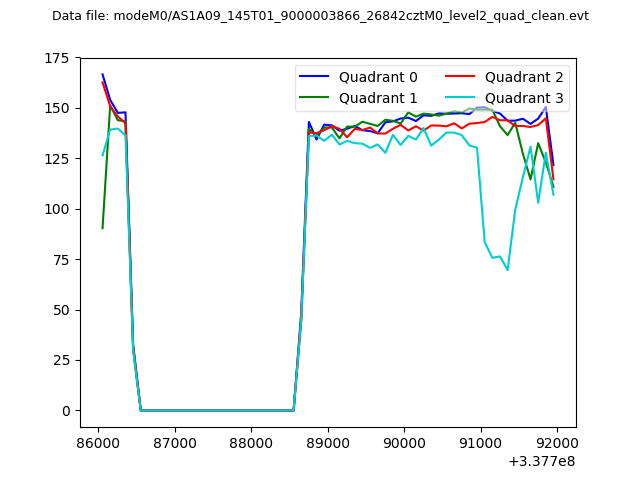 |
|
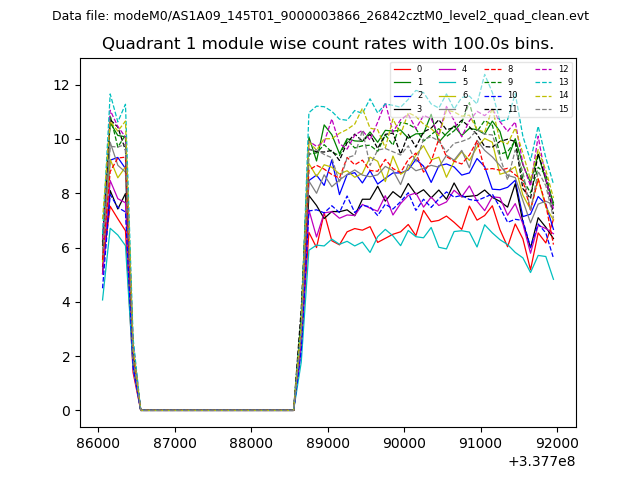
| Module-wise count rates for Quadrant A Data is divided into 100 sec bins |
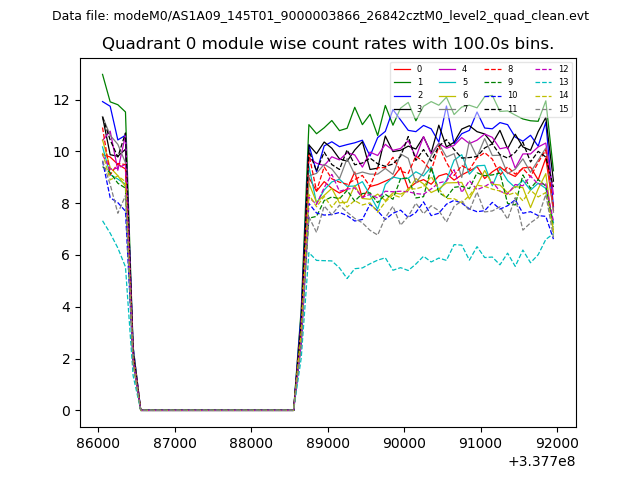 |
 |
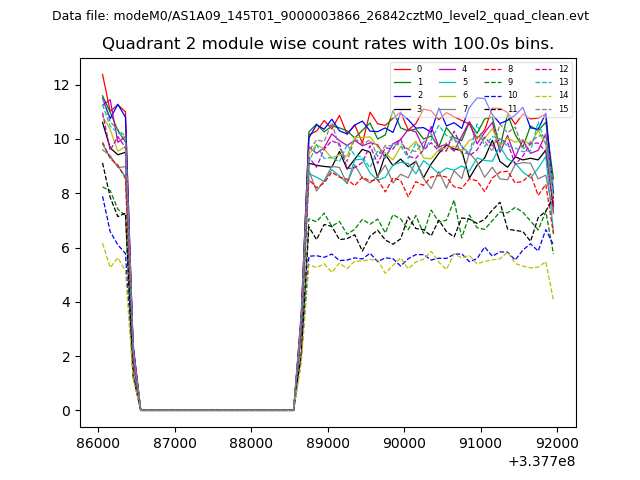
| Module-wise count rates for Quadrant B Data is divided into 100 sec bins |
 |
 |
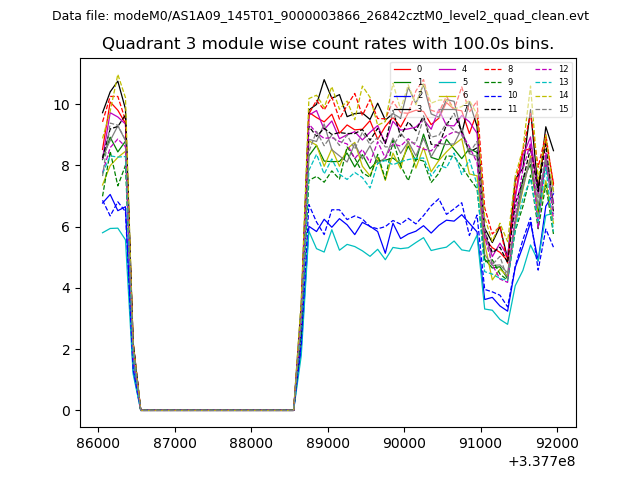
| Module-wise count rates for Quadrant C Data is divided into 100 sec bins |
 |
 |
| Module-wise count rates for Quadrant D Data is divided into 100 sec bins |
 |
 |
| Parameter | Plot |
|---|---|
| CZT HV Monitor | 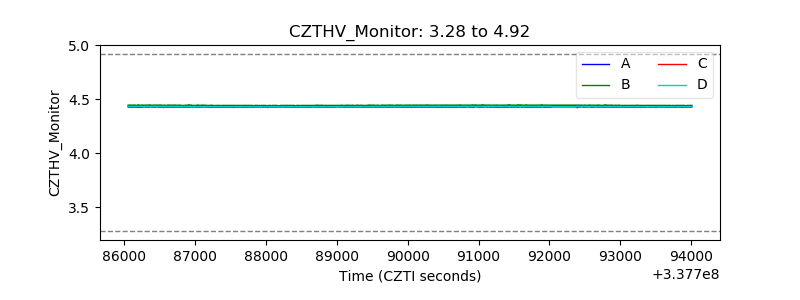 |
| D_VDD | 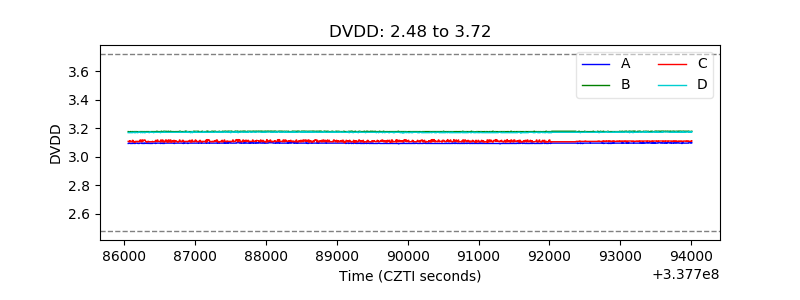 |
| Temperature 1 | 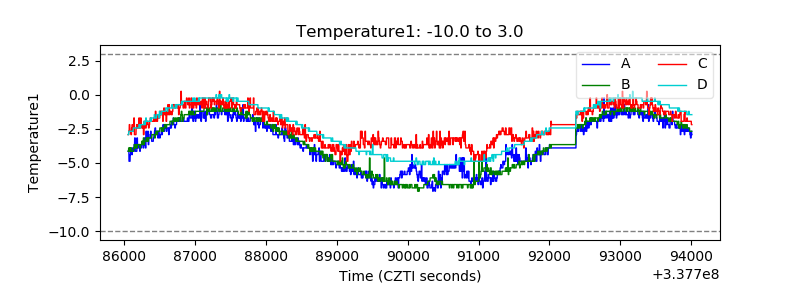 |
| Veto HV Monitor | 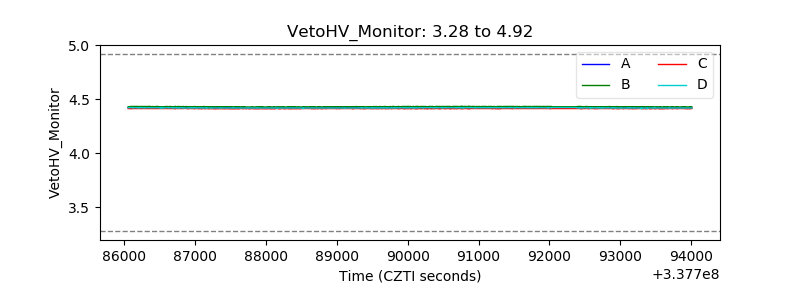 |
| Veto LLD | 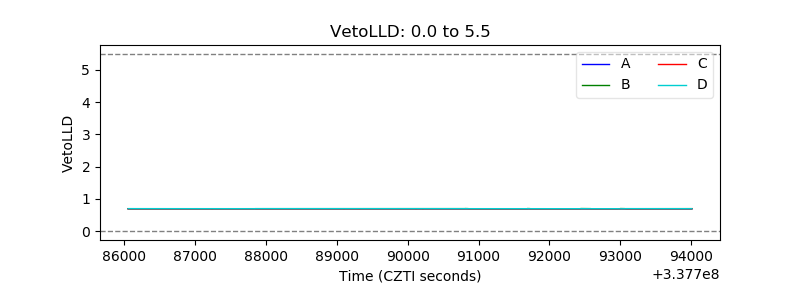 |
| Alpha Counter | 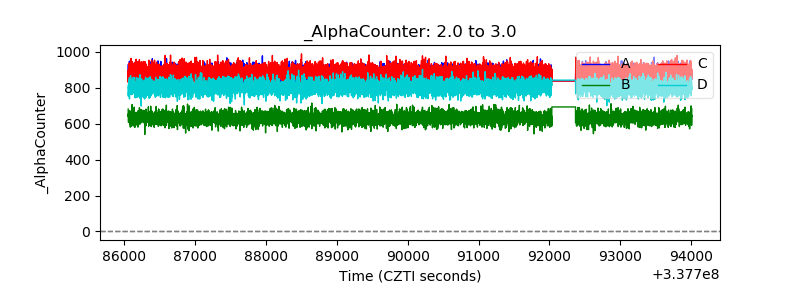 |
| _CPM_Rate | 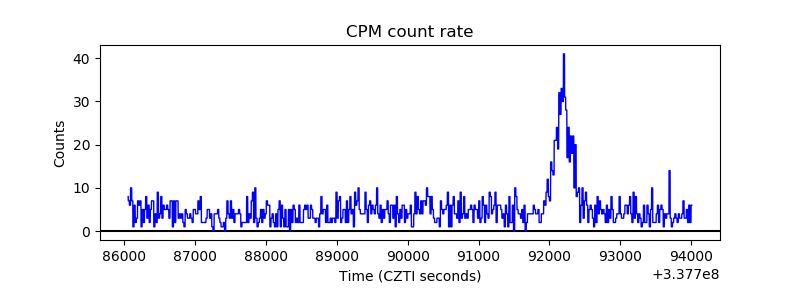 |
| CZT Counter | 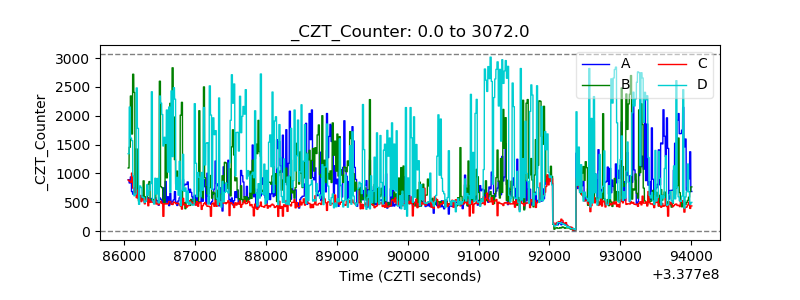 |
| +2.5 Volts monitor |  |
| +5 Volts monitor |  |
| _ROLL_ROT |  |
| _Roll_DEC | 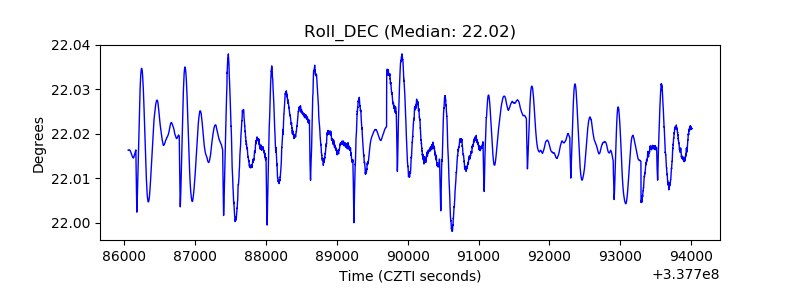 |
| _Roll_RA | 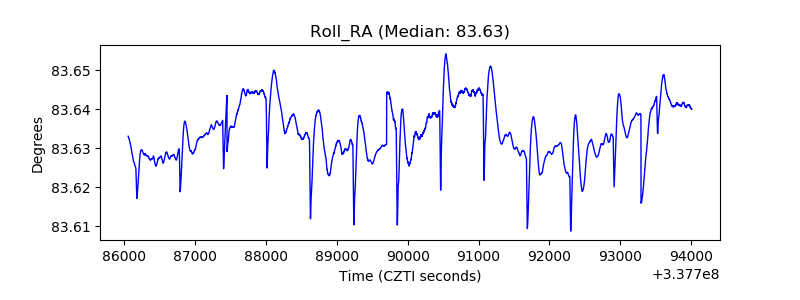 |
| Veto Counter | 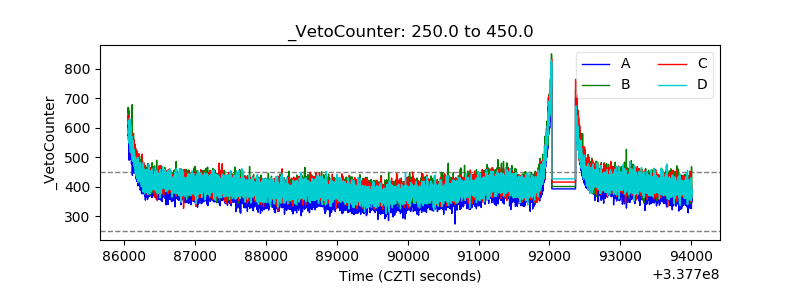 |