| Param | Original file | Final file |
|---|---|---|
| Filename | modeM0/AS1A09_145T01_9000003866_26849cztM0_level2.evt | modeM0/AS1A09_145T01_9000003866_26849cztM0_level2_quad_clean.evt |
| Size (bytes) | 1,470,458,880 | 214,917,120 |
| Size | 1.4 GB | 205.0 MB |
| Events in quadrant A | 12,040,913 | 1,393,259 |
| Events in quadrant B | 10,184,608 | 1,399,019 |
| Events in quadrant C | 7,590,245 | 1,361,255 |
| Events in quadrant D | 13,671,795 | 1,284,322 |
| Mode M9 | |||
|---|---|---|---|
| Quadrant | BADHDUFLAG | Total packets | Discarded packets |
| A | 0 | 8 | 0 |
| B | 0 | 8 | 0 |
| C | 0 | 8 | 0 |
| D | 0 | 8 | 0 |
| Mode M0 | |||
|---|---|---|---|
| Quadrant | BADHDUFLAG | Total packets | Discarded packets |
| A | 0 | 46225 | 0 |
| B | 0 | 40130 | 0 |
| C | 0 | 31922 | 0 |
| D | 0 | 50980 | 0 |
| Quadrant | Total seconds | Saturated seconds | Saturation percentage |
|---|---|---|---|
| A | 15519 | 603 | 3.885560% |
| B | 15519 | 701 | 4.517044% |
| C | 15520 | 228 | 1.469072% |
| D | 15520 | 2011 | 12.957474% |
Noise dominated data is calculated using 1-second bins in cleaned event files. If a bin has >2000 counts, and if more than 50% of those come from <1% of pixels, then it is considered to be noise-dominated and hence unusable.
| Quadrant | # 1 sec bins | Bins with >0 counts | Bins with >2000 counts | High rate bins dominated by noise | Noise dominated (total time) | Noise dominated (detector-on time) | Marked lightcurve |
|---|---|---|---|---|---|---|---|
| A | 16364 | 15519 | 277 | 277 | 1.69% | 1.78% | 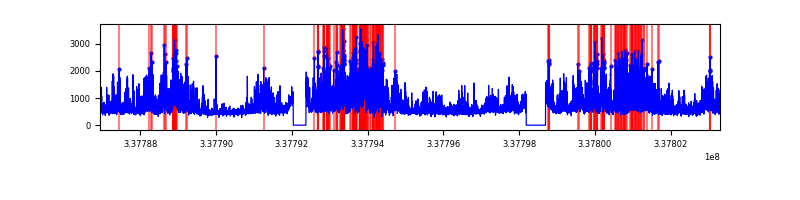 |
| B | 16364 | 15520 | 337 | 337 | 2.06% | 2.17% | 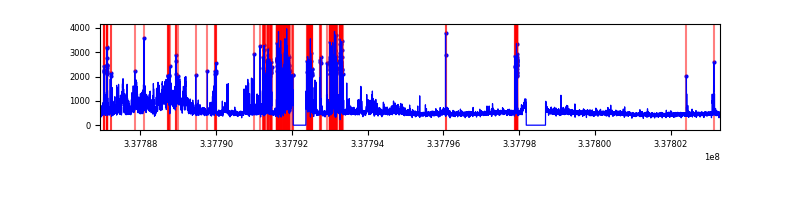 |
| C | 16365 | 15520 | 7 | 7 | 0.04% | 0.05% | 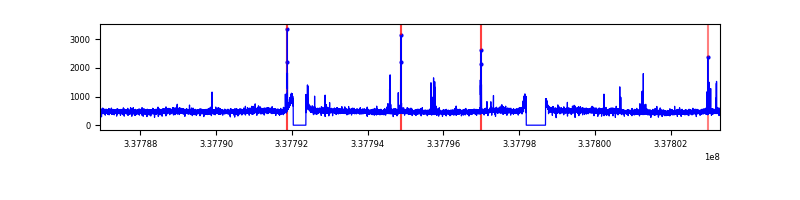 |
| D | 16365 | 15520 | 1574 | 1574 | 9.62% | 10.14% | 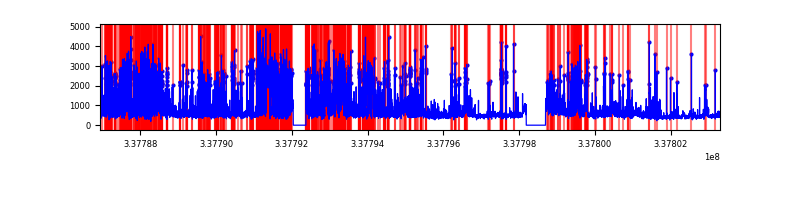 |
Top three noisy pixels from each quadrant. If the there are fewer than three noisy pixels in the level2.evt file, extra rows are filled as -1
| Pixel properties | Quadrant properties | ||||||
|---|---|---|---|---|---|---|---|
| Quadrant | DetID | PixID | Counts | Sigma | Mean | Median | Sigma |
| A | 0 | 13 | 4608509 | 11978.44 | 1905 | 1869 | 384.6 |
| A | 15 | 192 | 79032 | 200.64 | 1905 | 1869 | 384.6 |
| A | 13 | 254 | 24172 | 57.99 | 1905 | 1869 | 384.6 |
| B | 0 | 189 | 1361261 | 3827.92 | 1881 | 1838 | 355.1 |
| B | 3 | 64 | 1232713 | 3465.95 | 1881 | 1838 | 355.1 |
| B | 10 | 246 | 152509 | 424.27 | 1881 | 1838 | 355.1 |
| C | 14 | 238 | 292556 | 667.49 | 1844 | 1858 | 435.5 |
| C | 15 | 208 | 99663 | 224.58 | 1844 | 1858 | 435.5 |
| C | 13 | 61 | 12904 | 25.36 | 1844 | 1858 | 435.5 |
| D | 1 | 52 | 5735022 | 13602.94 | 1750 | 1708 | 421.5 |
| D | 7 | 80 | 705370 | 1669.52 | 1750 | 1708 | 421.5 |
| D | 2 | 250 | 475554 | 1124.25 | 1750 | 1708 | 421.5 |
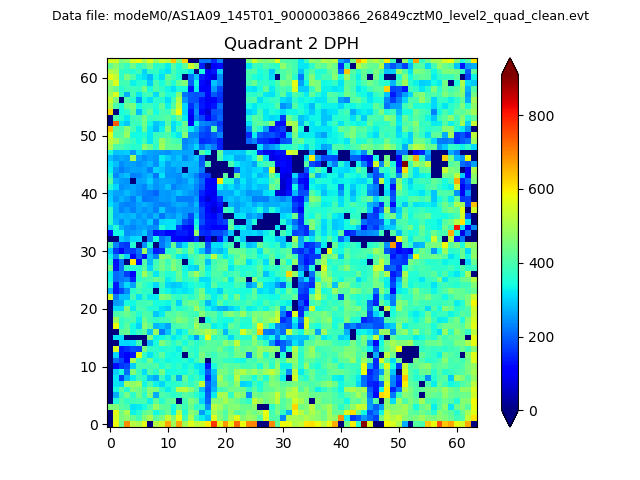
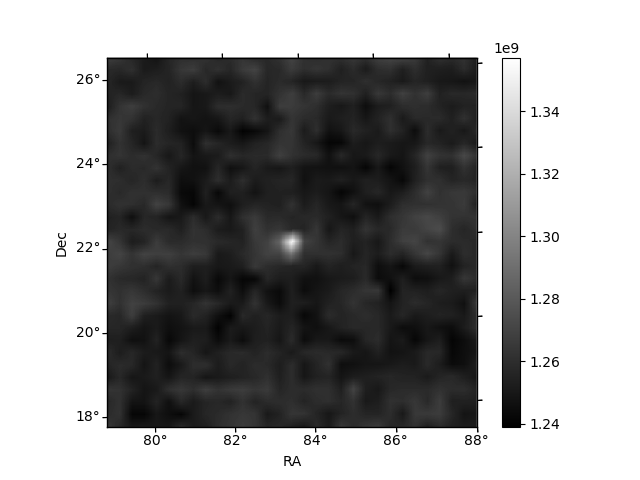
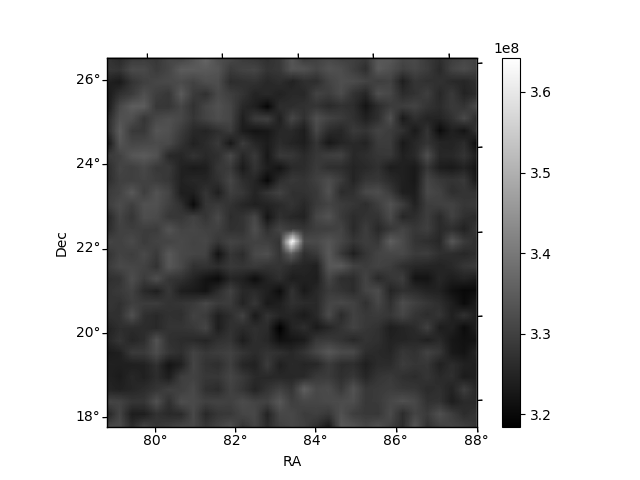
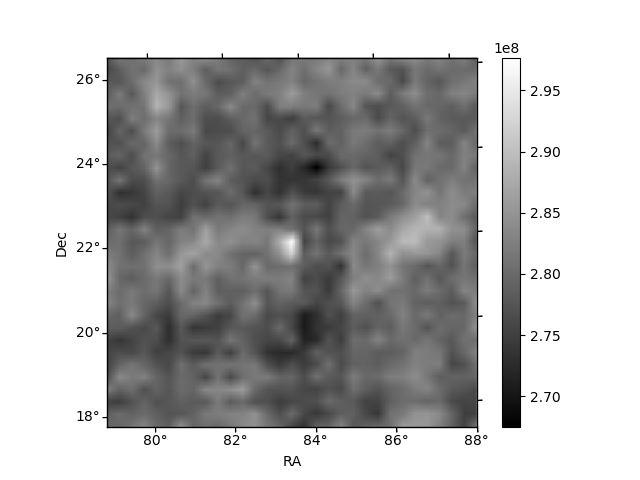
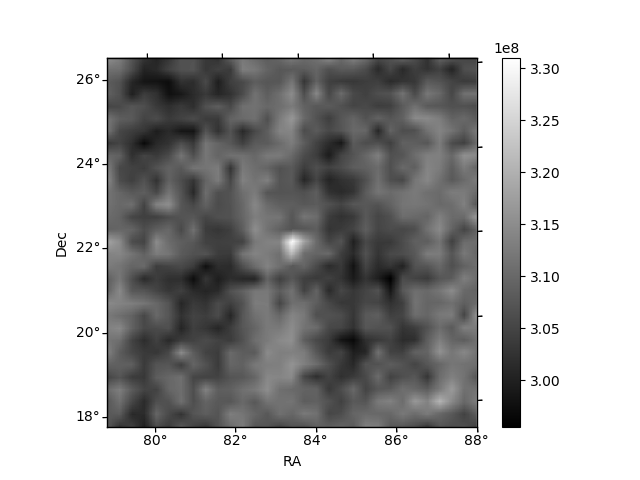
Histogram calculated using DETX and DETY for each event in the final _common_clean file
| Quadrant A | 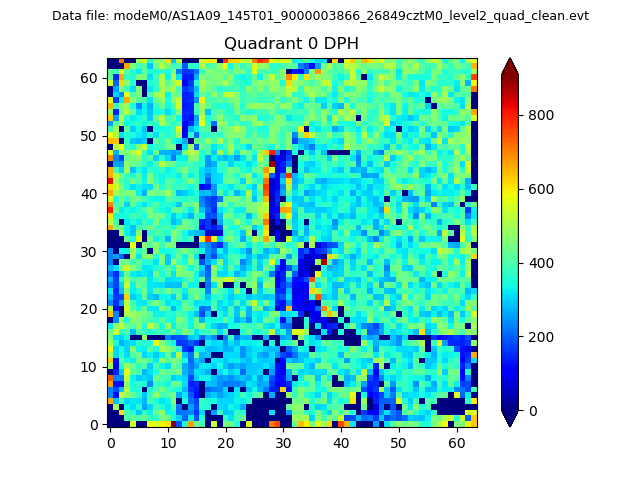 |
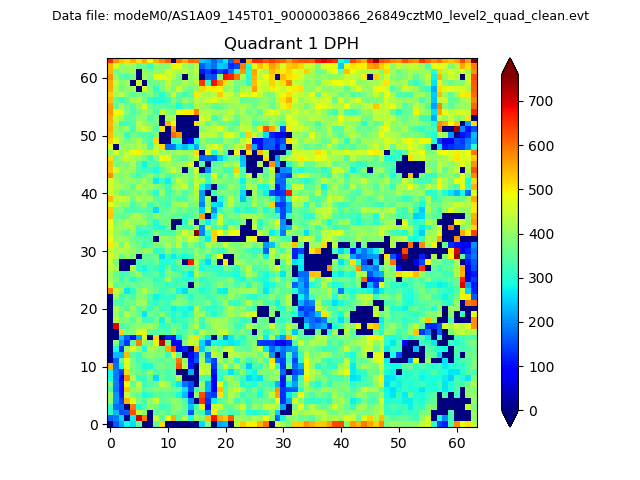 |
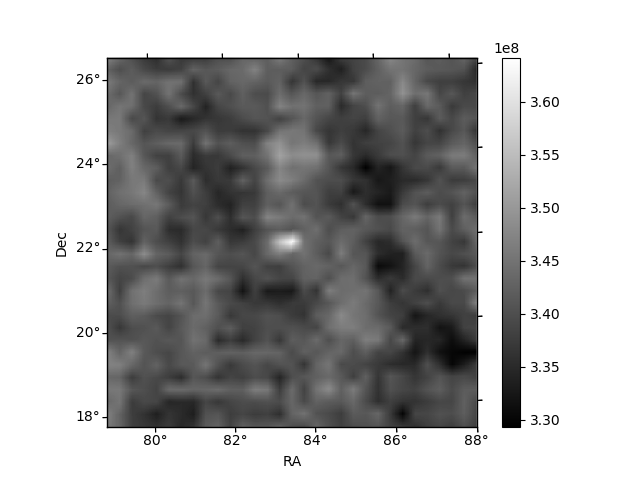
Quadrant B |
|---|---|---|---|
| Quadrant D | 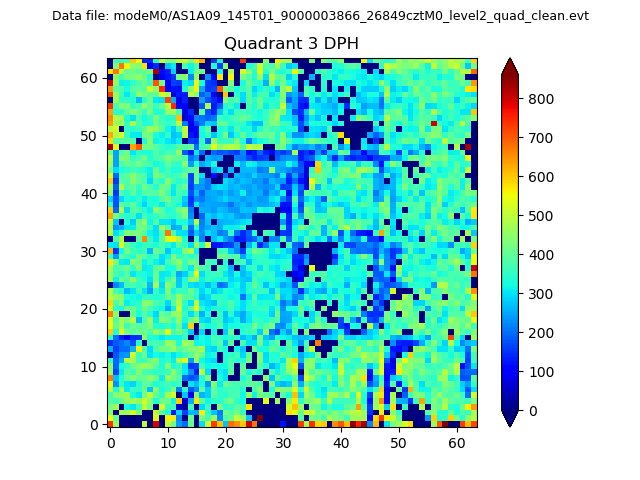 |
 |
Quadrant C |
| Plot type | Count rate plots | Images |
|---|---|---|
| Comparison with Poisson distribution Blue bars denote a histogram of data divided into 1 sec bins. Red curve is a Poisson curve with rate = median count rate of data. |
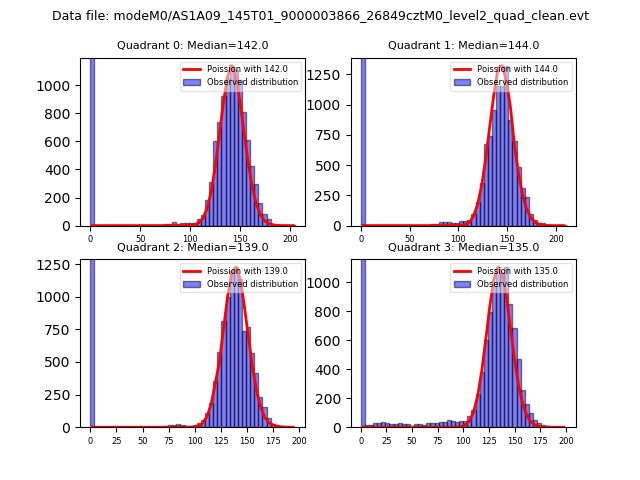 |
 |
| Quadrant-wise count rates Data is divided into 100 sec bins |
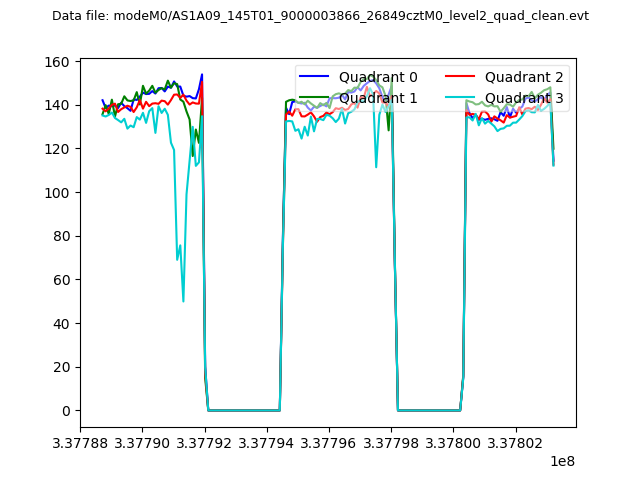 |
|
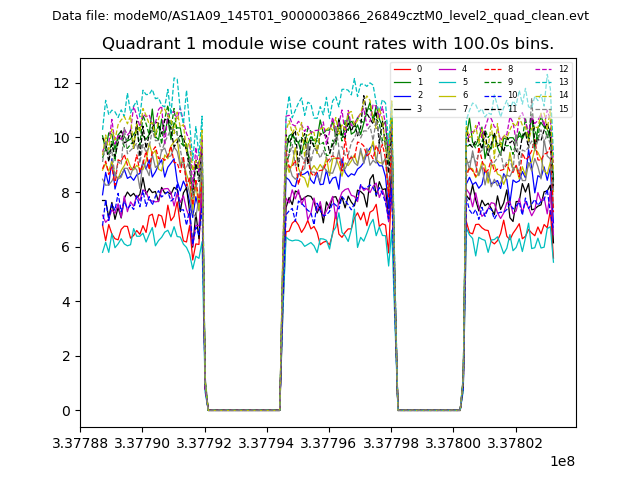
| Module-wise count rates for Quadrant A Data is divided into 100 sec bins |
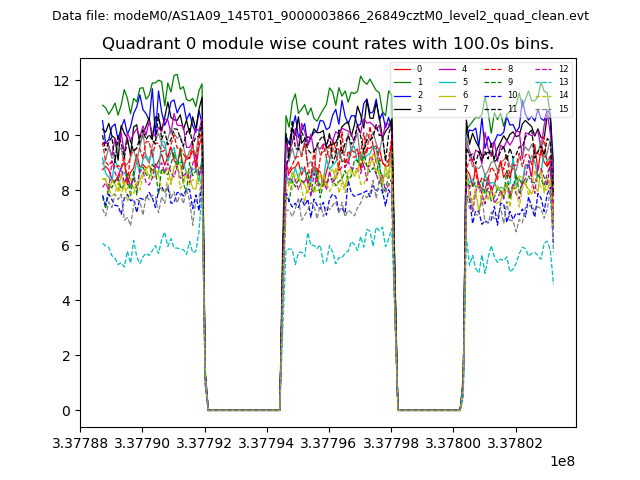 |
 |
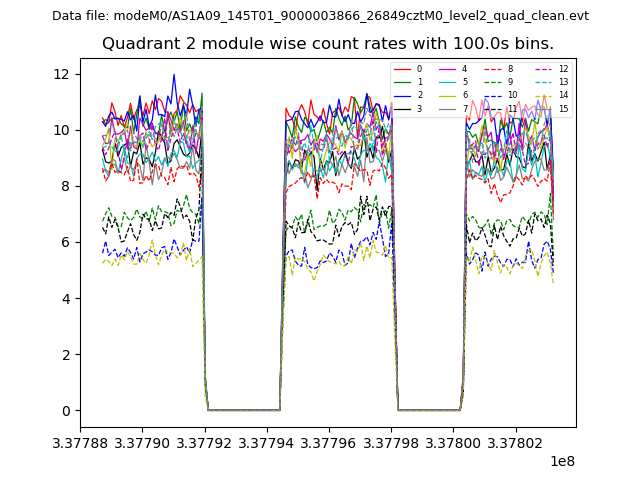
| Module-wise count rates for Quadrant B Data is divided into 100 sec bins |
 |
 |
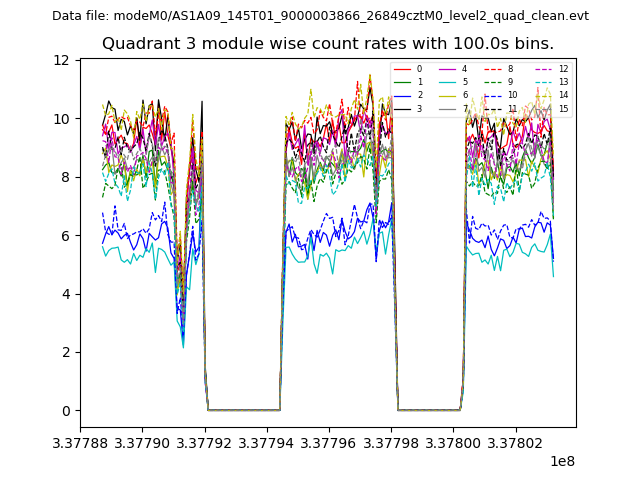
| Module-wise count rates for Quadrant C Data is divided into 100 sec bins |
 |
 |
| Module-wise count rates for Quadrant D Data is divided into 100 sec bins |
 |
 |
| Parameter | Plot |
|---|---|
| CZT HV Monitor | 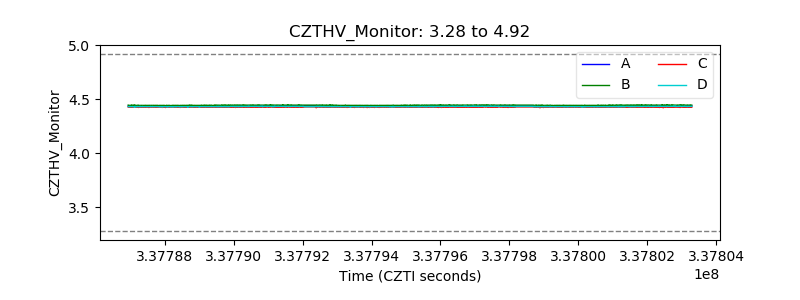 |
| D_VDD | 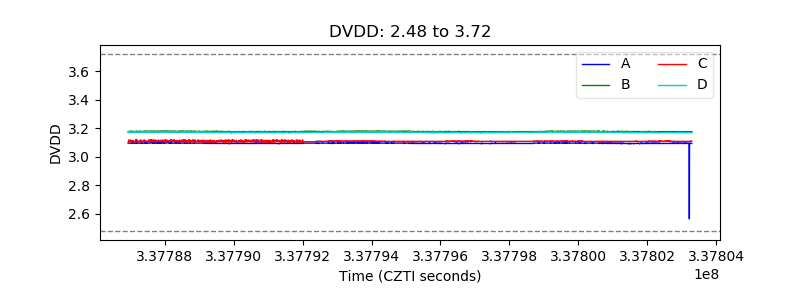 |
| Temperature 1 | 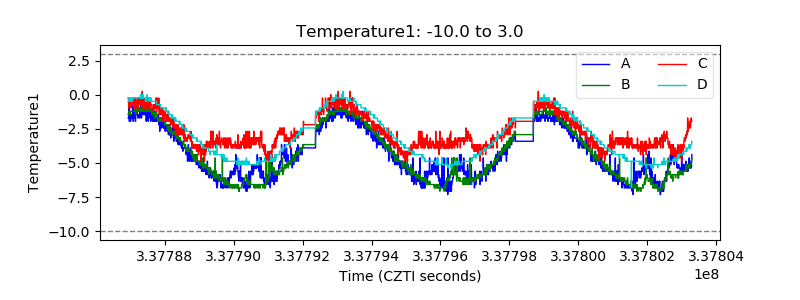 |
| Veto HV Monitor | 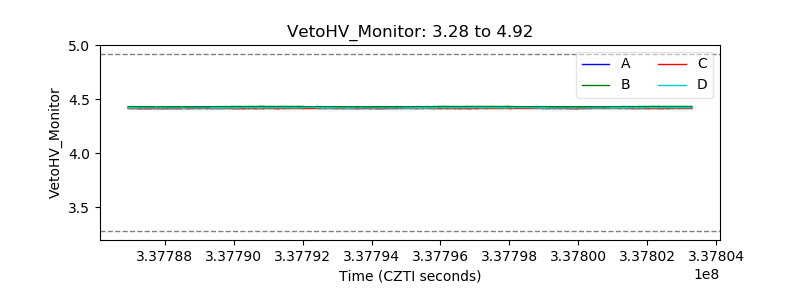 |
| Veto LLD | 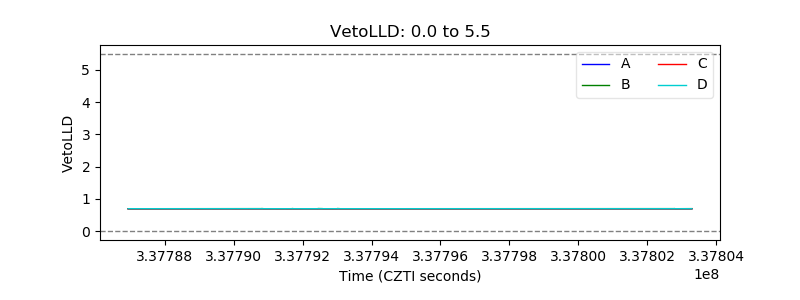 |
| Alpha Counter | 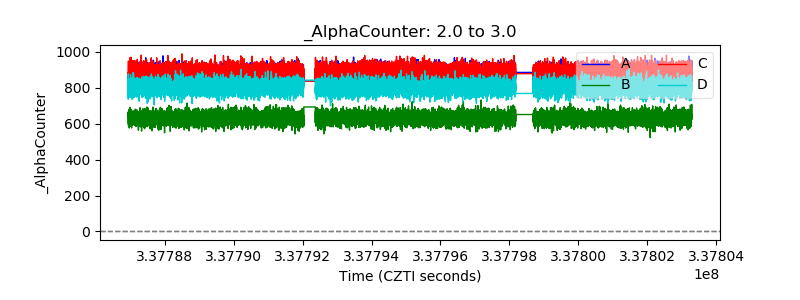 |
| _CPM_Rate | 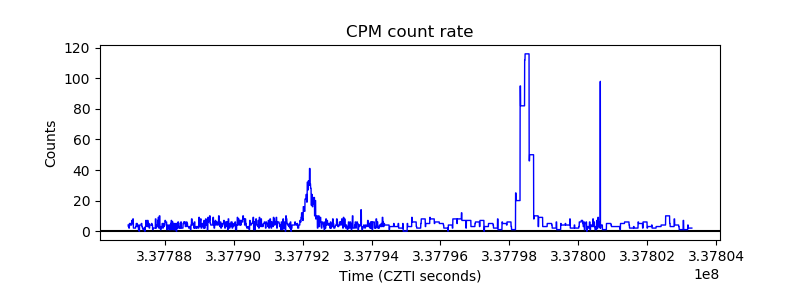 |
| CZT Counter | 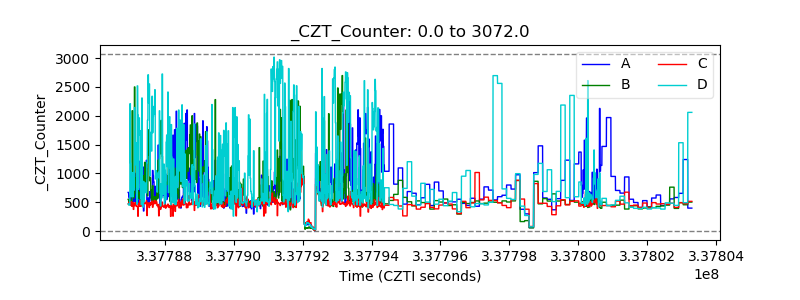 |
| +2.5 Volts monitor |  |
| +5 Volts monitor | 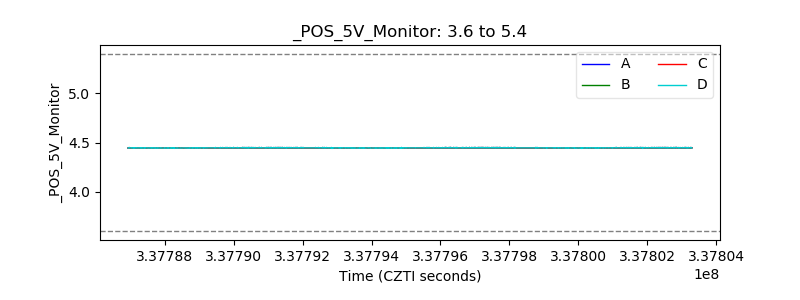 |
| _ROLL_ROT | 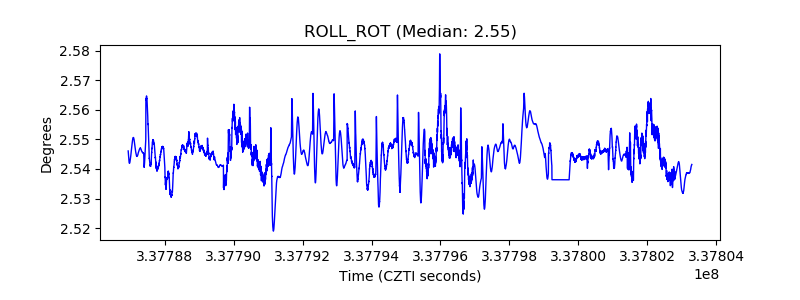 |
| _Roll_DEC | 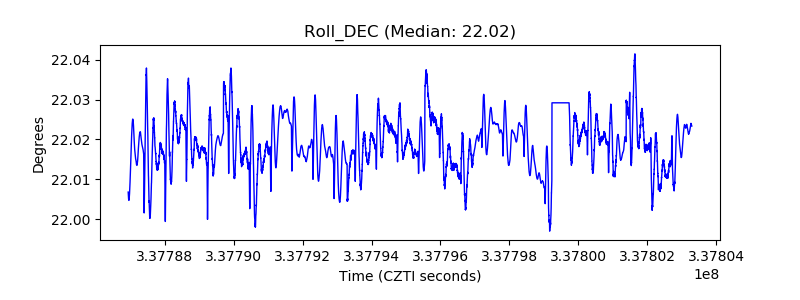 |
| _Roll_RA | 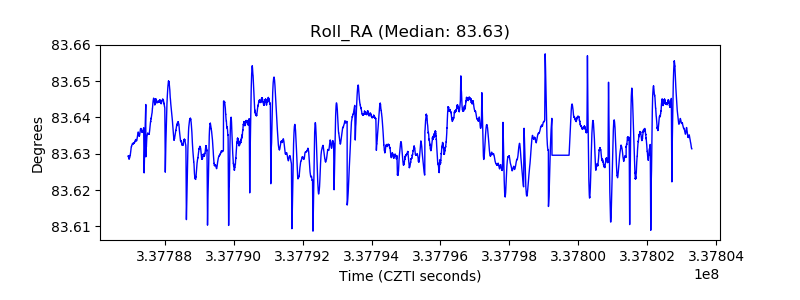 |
| Veto Counter | 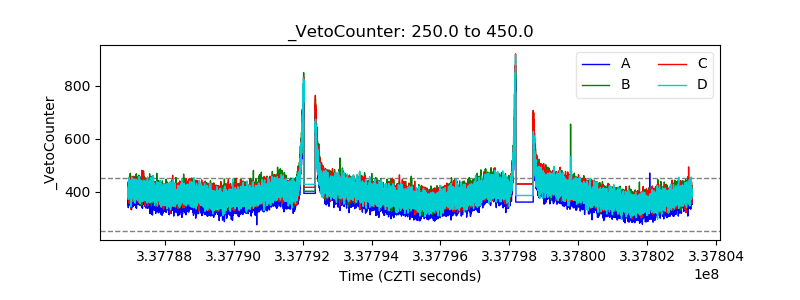 |