| Param | Original file | Final file |
|---|---|---|
| Filename | modeM0/AS1T03_224T01_9000003868_26845cztM0_level2.evt | modeM0/AS1T03_224T01_9000003868_26845cztM0_level2_quad_clean.evt |
| Size (bytes) | 584,553,600 | 82,149,120 |
| Size | 557.5 MB | 78.3 MB |
| Events in quadrant A | 3,964,546 | 532,517 |
| Events in quadrant B | 5,376,383 | 514,599 |
| Events in quadrant C | 3,013,631 | 528,798 |
| Events in quadrant D | 4,920,745 | 470,285 |
| Mode M0 | |||
|---|---|---|---|
| Quadrant | BADHDUFLAG | Total packets | Discarded packets |
| A | 0 | 16018 | 0 |
| B | 0 | 19897 | 0 |
| C | 0 | 13048 | 0 |
| D | 0 | 18897 | 0 |
| Mode M9 | |||
|---|---|---|---|
| Quadrant | BADHDUFLAG | Total packets | Discarded packets |
| A | 0 | 9 | 0 |
| B | 0 | 9 | 0 |
| C | 0 | 9 | 0 |
| D | 0 | 9 | 0 |
| Quadrant | Total seconds | Saturated seconds | Saturation percentage |
|---|---|---|---|
| A | 6316 | 61 | 0.965801% |
| B | 6317 | 712 | 11.271173% |
| C | 6317 | 60 | 0.949818% |
| D | 6317 | 649 | 10.273864% |
Noise dominated data is calculated using 1-second bins in cleaned event files. If a bin has >2000 counts, and if more than 50% of those come from <1% of pixels, then it is considered to be noise-dominated and hence unusable.
| Quadrant | # 1 sec bins | Bins with >0 counts | Bins with >2000 counts | High rate bins dominated by noise | Noise dominated (total time) | Noise dominated (detector-on time) | Marked lightcurve |
|---|---|---|---|---|---|---|---|
| A | 7206 | 6317 | 38 | 38 | 0.53% | 0.60% | 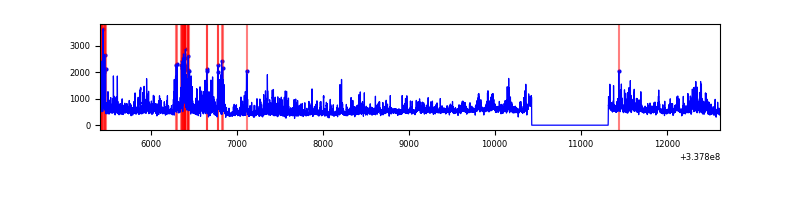 |
| B | 7207 | 6318 | 643 | 643 | 8.92% | 10.18% | 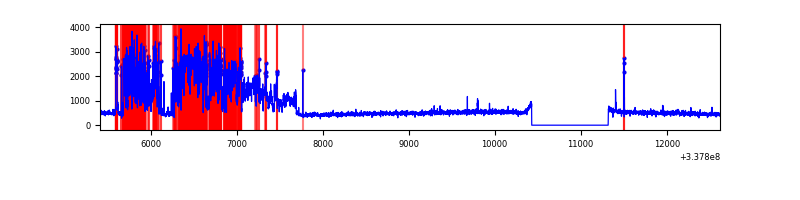 |
| C | 7207 | 6318 | 6 | 6 | 0.08% | 0.09% | 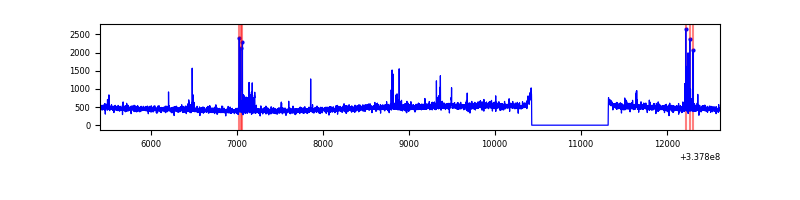 |
| D | 7207 | 6318 | 531 | 531 | 7.37% | 8.40% | 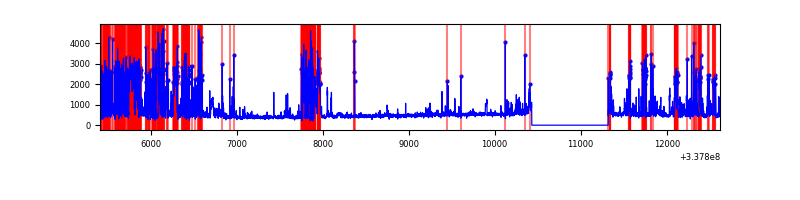 |
Top three noisy pixels from each quadrant. If the there are fewer than three noisy pixels in the level2.evt file, extra rows are filled as -1
| Pixel properties | Quadrant properties | ||||||
|---|---|---|---|---|---|---|---|
| Quadrant | DetID | PixID | Counts | Sigma | Mean | Median | Sigma |
| A | 0 | 13 | 1060160 | 6934.34 | 752 | 734 | 152.8 |
| A | 13 | 254 | 10362 | 63.02 | 752 | 734 | 152.8 |
| A | 3 | 137 | 7126 | 41.84 | 752 | 734 | 152.8 |
| B | 0 | 189 | 2490054 | 17886.74 | 732 | 716 | 139.2 |
| B | 12 | 111 | 16919 | 116.42 | 732 | 716 | 139.2 |
| B | 11 | 111 | 14952 | 102.29 | 732 | 716 | 139.2 |
| C | 14 | 238 | 115111 | 668.01 | 723 | 727 | 171.2 |
| C | 15 | 208 | 71628 | 414.07 | 723 | 727 | 171.2 |
| C | 14 | 176 | 10543 | 57.33 | 723 | 727 | 171.2 |
| D | 1 | 52 | 1956405 | 11859.6 | 684 | 666 | 164.9 |
| D | 2 | 250 | 258903 | 1565.95 | 684 | 666 | 164.9 |
| D | 7 | 80 | 91514 | 550.9 | 684 | 666 | 164.9 |
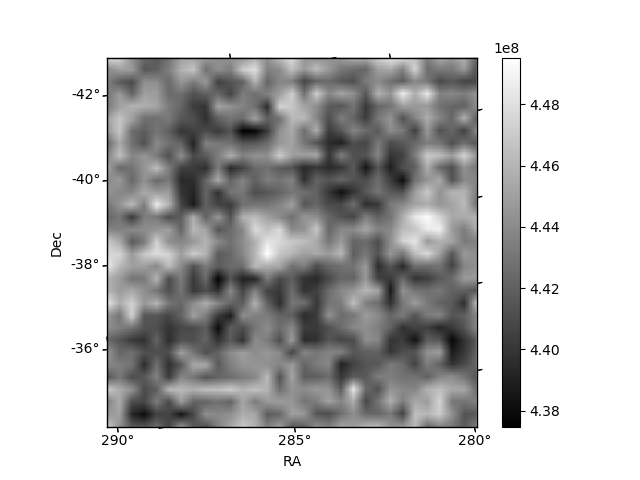
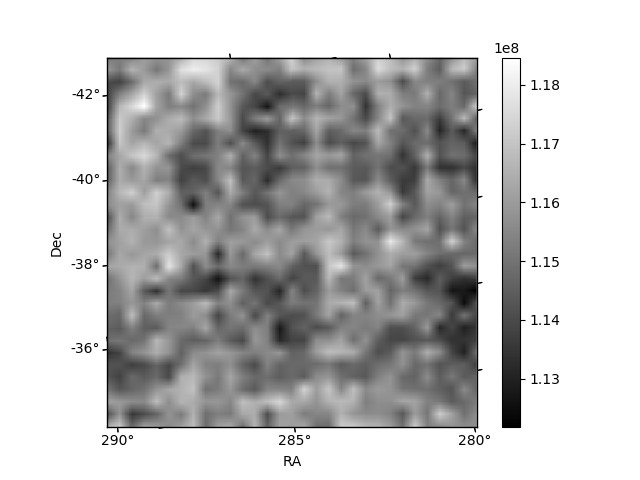
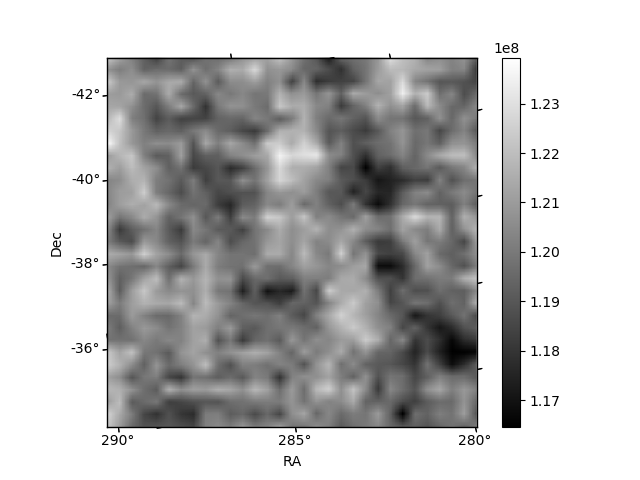
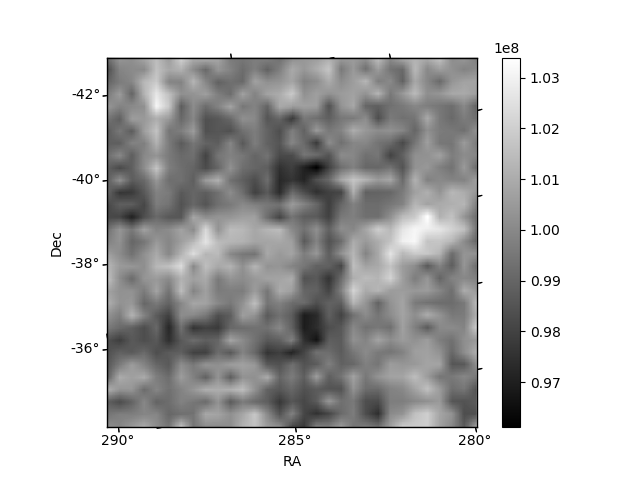
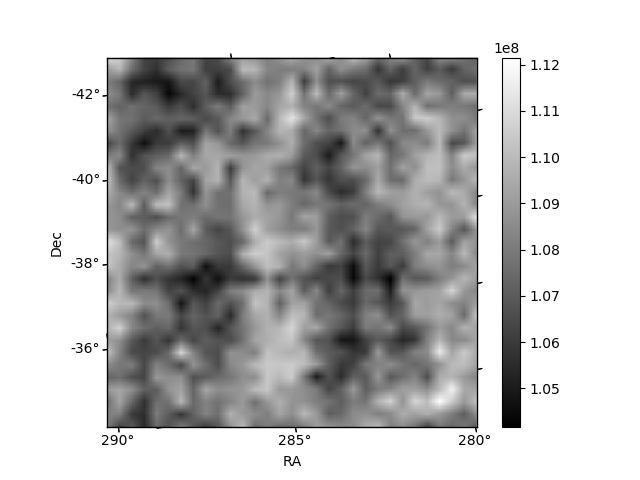
Histogram calculated using DETX and DETY for each event in the final _common_clean file
| Quadrant A | 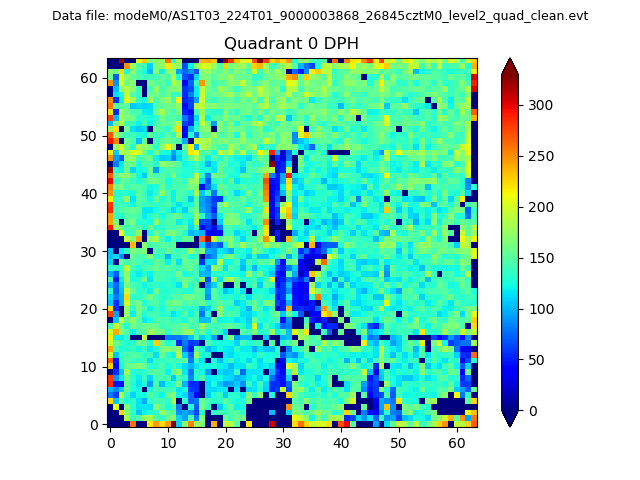 |
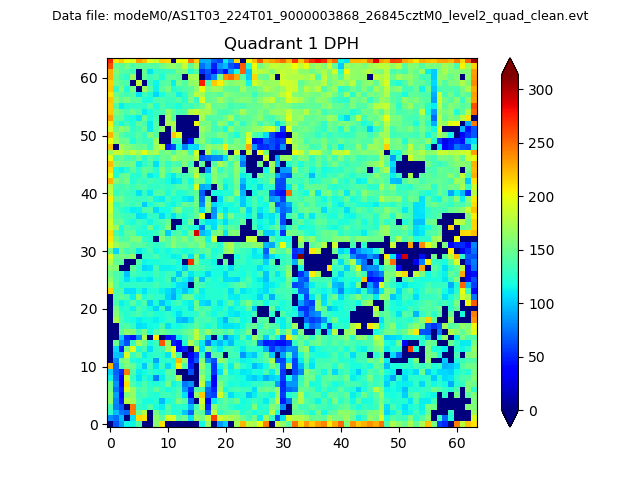 |
Quadrant B |
|---|---|---|---|
| Quadrant D | 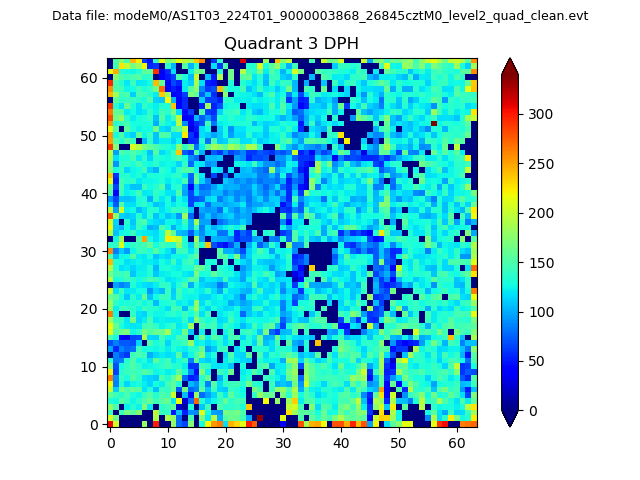 |
 |
Quadrant C |
| Plot type | Count rate plots | Images |
|---|---|---|
| Comparison with Poisson distribution Blue bars denote a histogram of data divided into 1 sec bins. Red curve is a Poisson curve with rate = median count rate of data. |
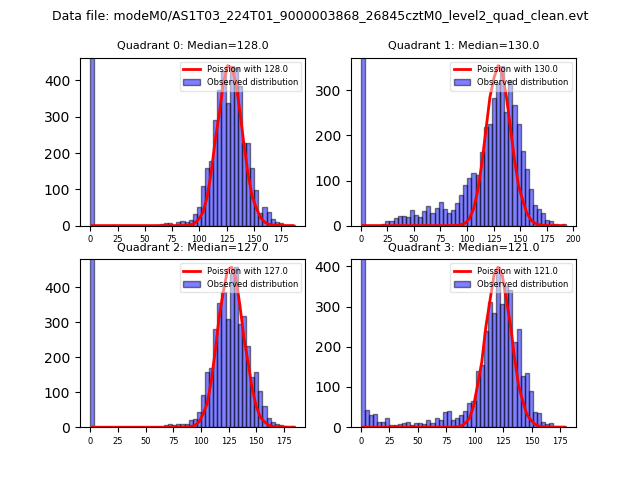 |
 |
| Quadrant-wise count rates Data is divided into 100 sec bins |
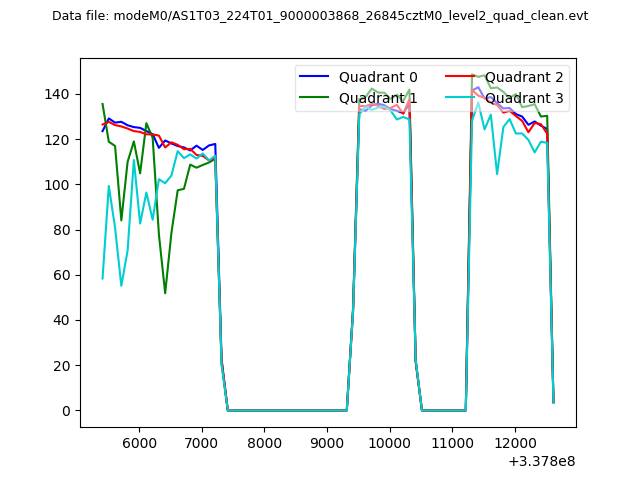 |
|
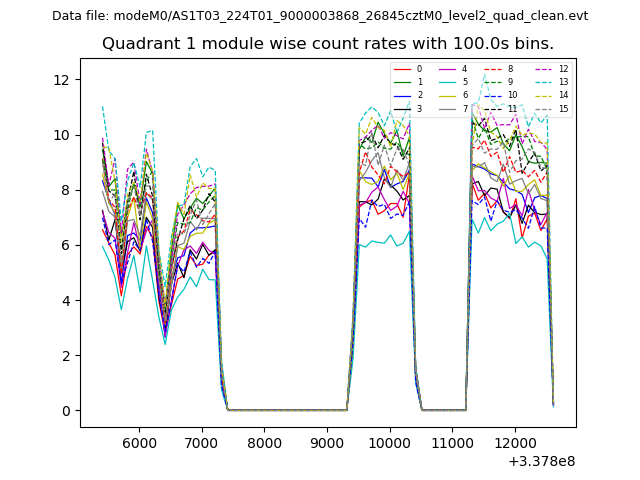
| Module-wise count rates for Quadrant A Data is divided into 100 sec bins |
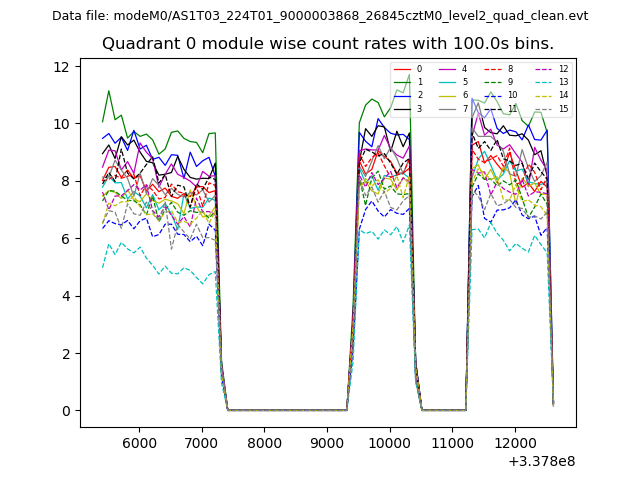 |
 |
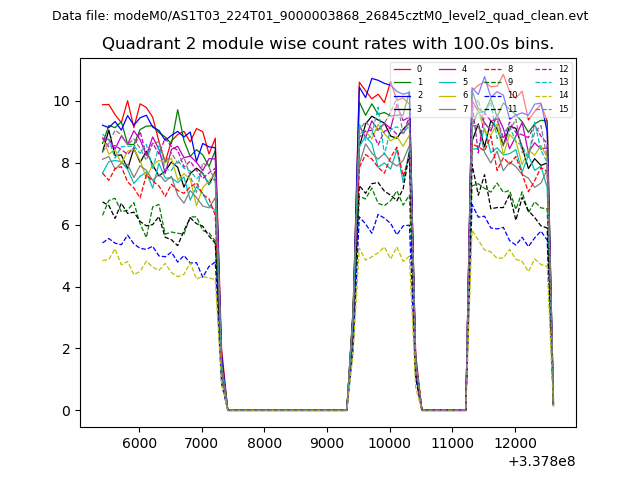
| Module-wise count rates for Quadrant B Data is divided into 100 sec bins |
 |
 |
| Module-wise count rates for Quadrant C Data is divided into 100 sec bins |
 |
 |
| Module-wise count rates for Quadrant D Data is divided into 100 sec bins |
 |
 |
| Parameter | Plot |
|---|---|
| CZT HV Monitor | 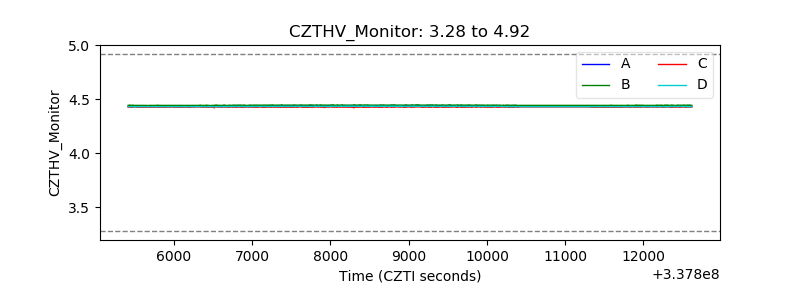 |
| D_VDD | 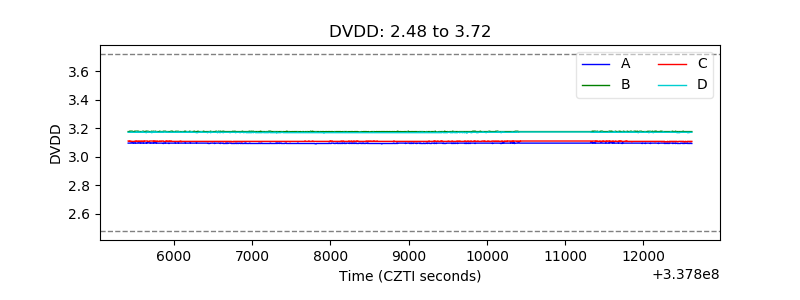 |
| Temperature 1 | 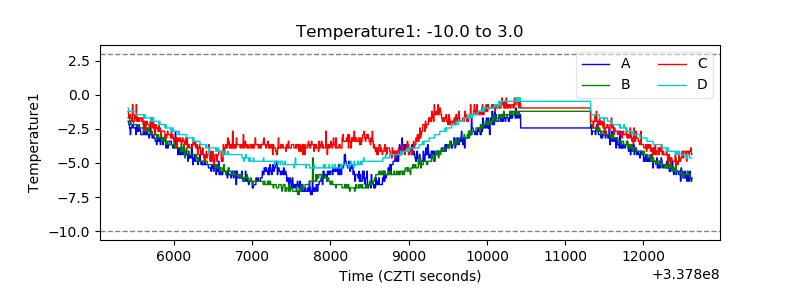 |
| Veto HV Monitor | 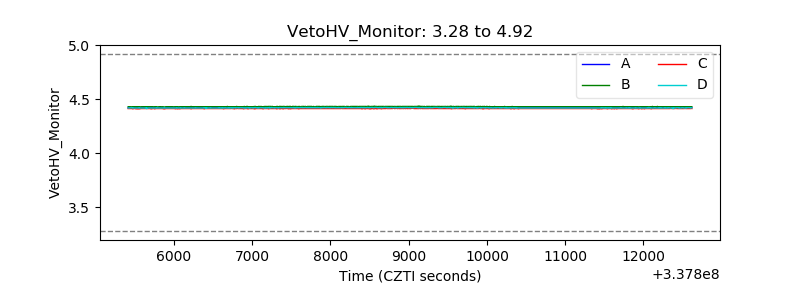 |
| Veto LLD | 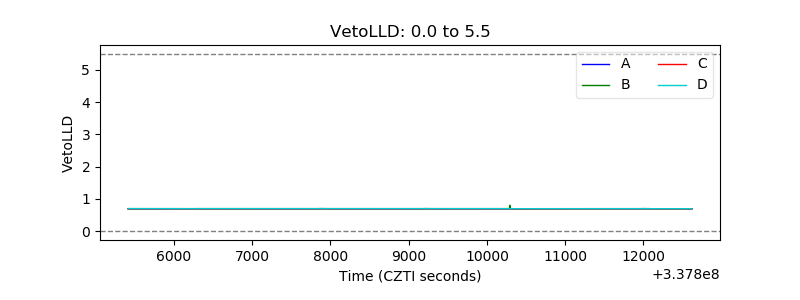 |
| Alpha Counter | 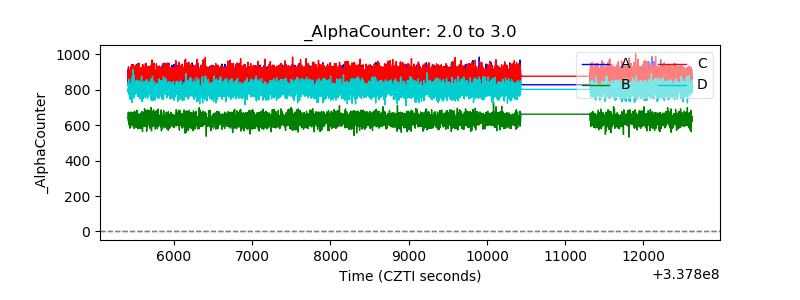 |
| _CPM_Rate | 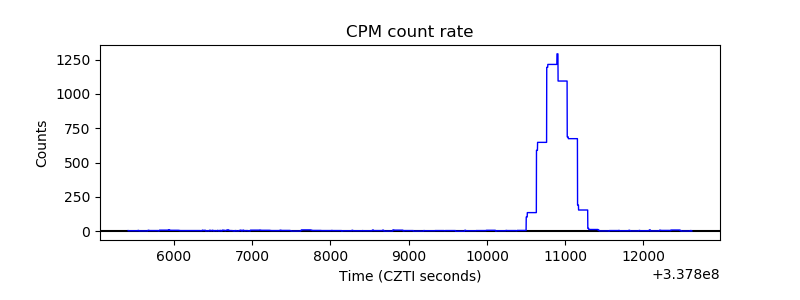 |
| CZT Counter |  |
| +2.5 Volts monitor |  |
| +5 Volts monitor | 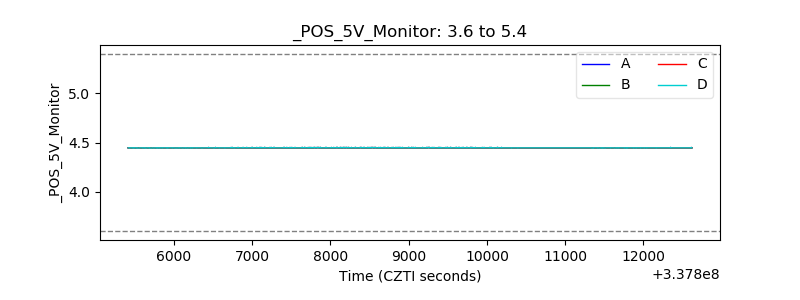 |
| _ROLL_ROT | 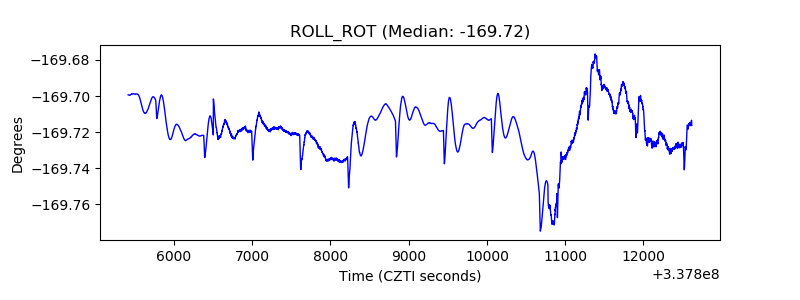 |
| _Roll_DEC | 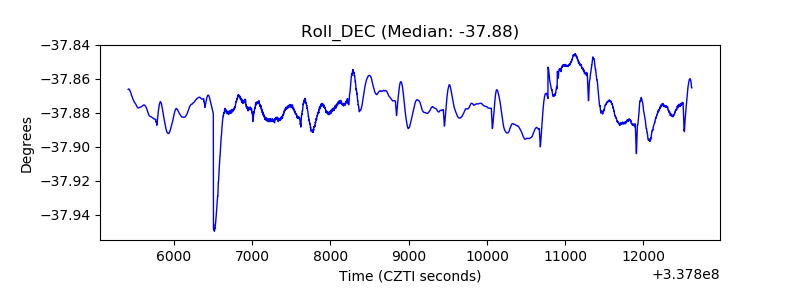 |
| _Roll_RA | 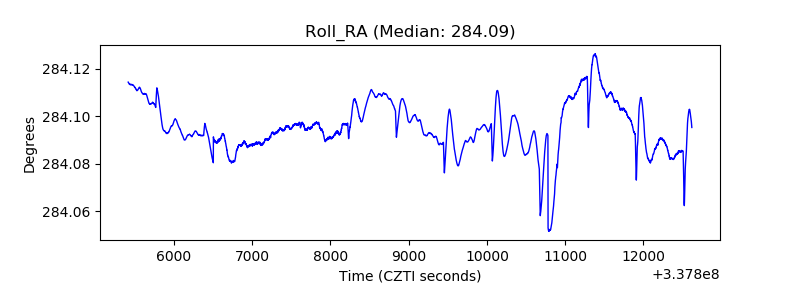 |
| Veto Counter | 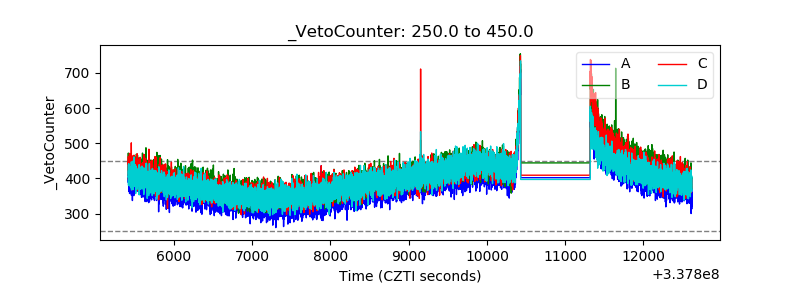 |