| Param | Original file | Final file |
|---|---|---|
| Filename | modeM0/AS1T03_224T01_9000003868_26848cztM0_level2.evt | modeM0/AS1T03_224T01_9000003868_26848cztM0_level2_quad_clean.evt |
| Size (bytes) | 540,696,960 | 90,483,840 |
| Size | 515.6 MB | 86.3 MB |
| Events in quadrant A | 4,046,653 | 571,231 |
| Events in quadrant B | 3,548,002 | 597,289 |
| Events in quadrant C | 3,347,117 | 571,772 |
| Events in quadrant D | 4,982,856 | 536,420 |
| Mode M0 | |||
|---|---|---|---|
| Quadrant | BADHDUFLAG | Total packets | Discarded packets |
| A | 0 | 16324 | 0 |
| B | 0 | 14654 | 0 |
| C | 0 | 13947 | 0 |
| D | 0 | 19306 | 0 |
| Mode M9 | |||
|---|---|---|---|
| Quadrant | BADHDUFLAG | Total packets | Discarded packets |
| A | 0 | 12 | 0 |
| B | 0 | 13 | 0 |
| C | 0 | 13 | 0 |
| D | 0 | 13 | 0 |
| Quadrant | Total seconds | Saturated seconds | Saturation percentage |
|---|---|---|---|
| A | 6650 | 49 | 0.736842% |
| B | 6649 | 59 | 0.887351% |
| C | 6649 | 62 | 0.932471% |
| D | 6649 | 307 | 4.617236% |
Noise dominated data is calculated using 1-second bins in cleaned event files. If a bin has >2000 counts, and if more than 50% of those come from <1% of pixels, then it is considered to be noise-dominated and hence unusable.
| Quadrant | # 1 sec bins | Bins with >0 counts | Bins with >2000 counts | High rate bins dominated by noise | Noise dominated (total time) | Noise dominated (detector-on time) | Marked lightcurve |
|---|---|---|---|---|---|---|---|
| A | 7825 | 6651 | 5 | 5 | 0.06% | 0.08% | 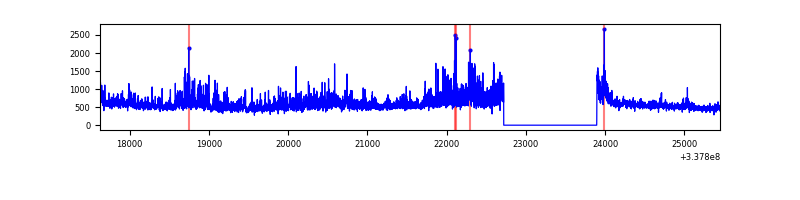 |
| B | 7824 | 6649 | 9 | 9 | 0.12% | 0.14% | 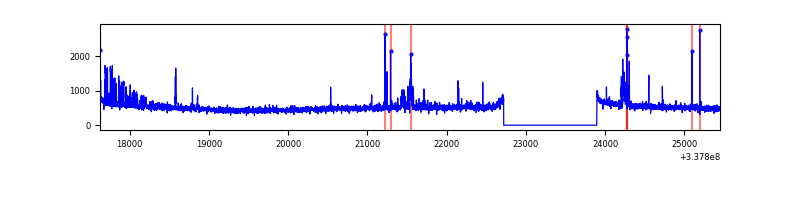 |
| C | 7824 | 6650 | 1 | 1 | 0.01% | 0.02% | 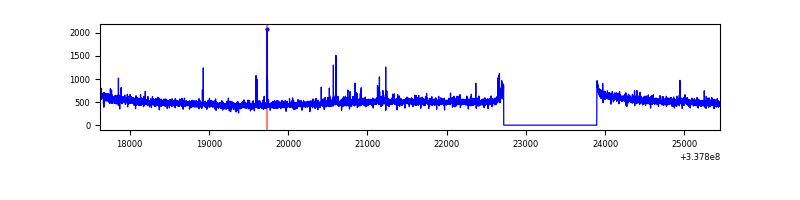 |
| D | 7824 | 6650 | 303 | 303 | 3.87% | 4.56% | 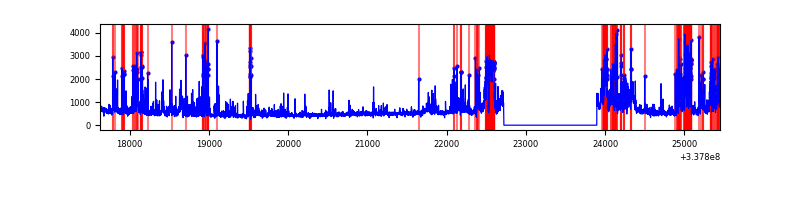 |
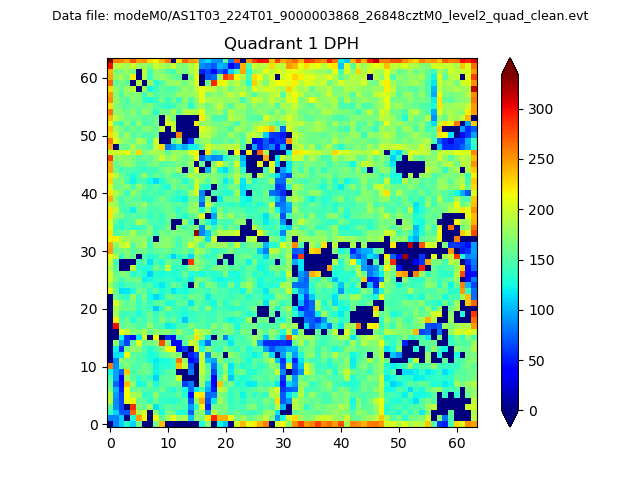
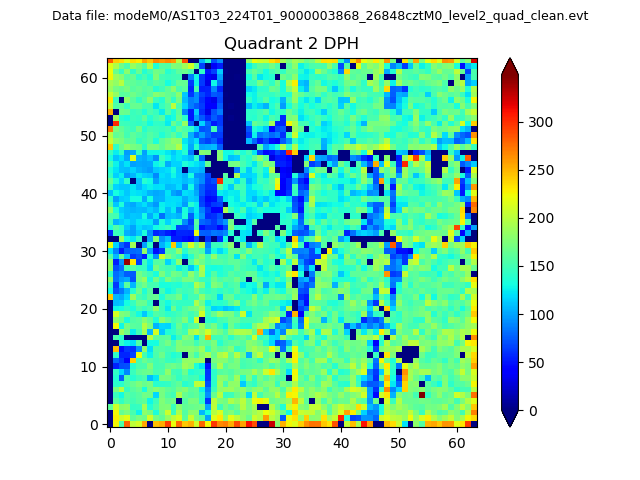
Top three noisy pixels from each quadrant. If the there are fewer than three noisy pixels in the level2.evt file, extra rows are filled as -1
| Pixel properties | Quadrant properties | ||||||
|---|---|---|---|---|---|---|---|
| Quadrant | DetID | PixID | Counts | Sigma | Mean | Median | Sigma |
| A | 0 | 13 | 817451 | 4899.58 | 836 | 820 | 166.7 |
| A | 13 | 254 | 11500 | 64.08 | 836 | 820 | 166.7 |
| A | 3 | 137 | 7375 | 39.33 | 836 | 820 | 166.7 |
| B | 7 | 205 | 110983 | 685.58 | 845 | 823 | 160.7 |
| B | 15 | 33 | 77103 | 474.73 | 845 | 823 | 160.7 |
| B | 0 | 229 | 23146 | 138.93 | 845 | 823 | 160.7 |
| C | 14 | 238 | 132817 | 693.89 | 815 | 822 | 190.2 |
| C | 15 | 208 | 29359 | 150.02 | 815 | 822 | 190.2 |
| C | 7 | 87 | 8083 | 38.17 | 815 | 822 | 190.2 |
| D | 7 | 80 | 1048142 | 5540.72 | 795 | 777 | 189.0 |
| D | 1 | 52 | 747678 | 3951.22 | 795 | 777 | 189.0 |
| D | 2 | 250 | 107488 | 564.52 | 795 | 777 | 189.0 |
Histogram calculated using DETX and DETY for each event in the final _common_clean file
| Quadrant A | 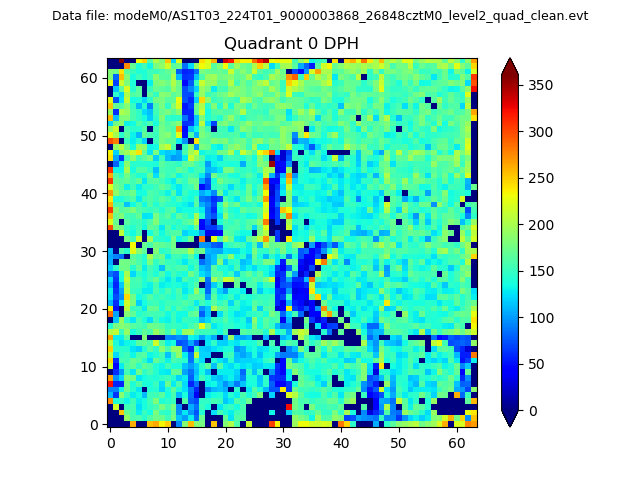 |
 |
Quadrant B |
|---|---|---|---|
| Quadrant D | 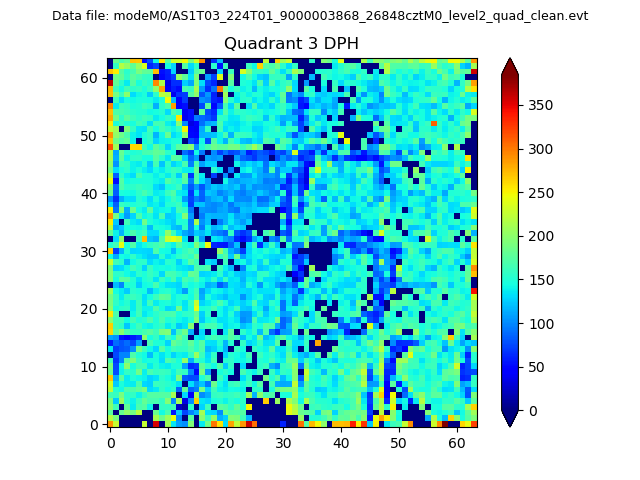 |
 |
Quadrant C |
| Plot type | Count rate plots | Images |
|---|---|---|
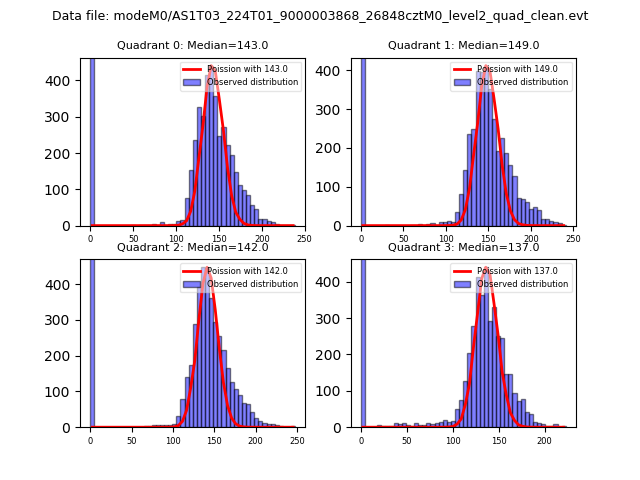
| Comparison with Poisson distribution Blue bars denote a histogram of data divided into 1 sec bins. Red curve is a Poisson curve with rate = median count rate of data. |
 |
 |
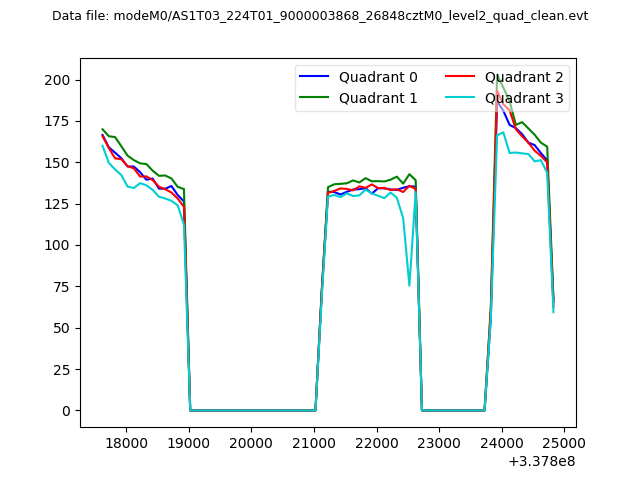
| Quadrant-wise count rates Data is divided into 100 sec bins |
 |
|
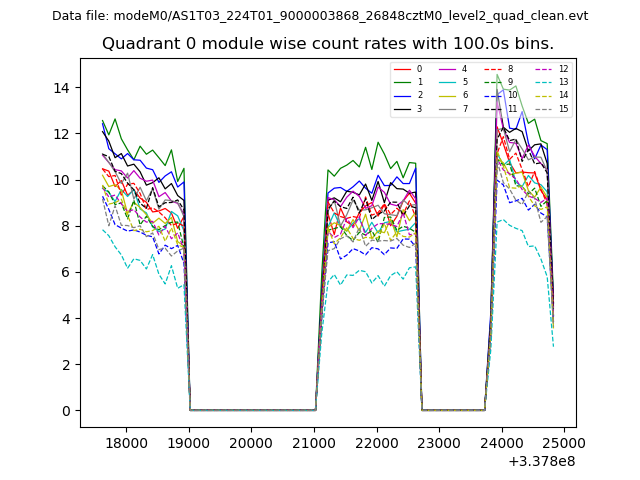
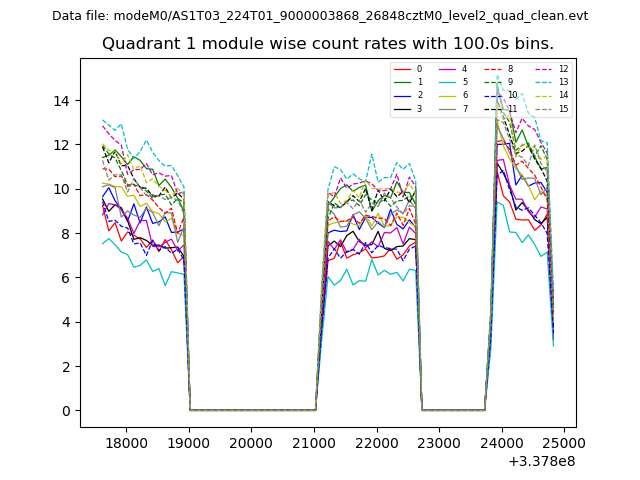
| Module-wise count rates for Quadrant A Data is divided into 100 sec bins |
 |
 |
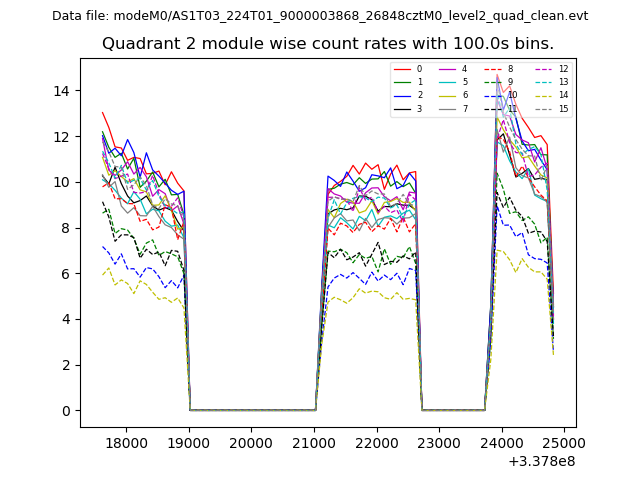
| Module-wise count rates for Quadrant B Data is divided into 100 sec bins |
 |
 |
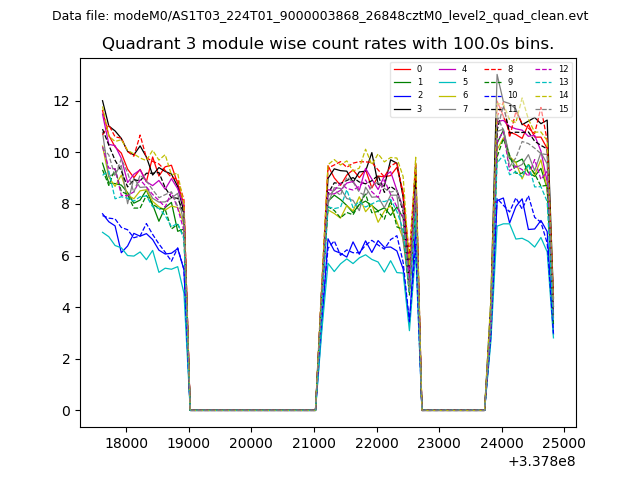
| Module-wise count rates for Quadrant C Data is divided into 100 sec bins |
 |
 |
| Module-wise count rates for Quadrant D Data is divided into 100 sec bins |
 |
 |
| Parameter | Plot |
|---|---|
| CZT HV Monitor | 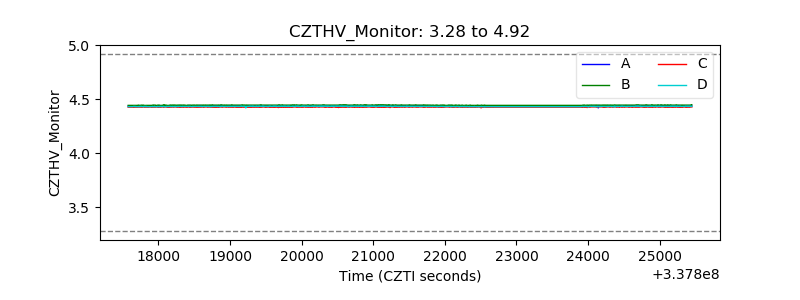 |
| D_VDD | 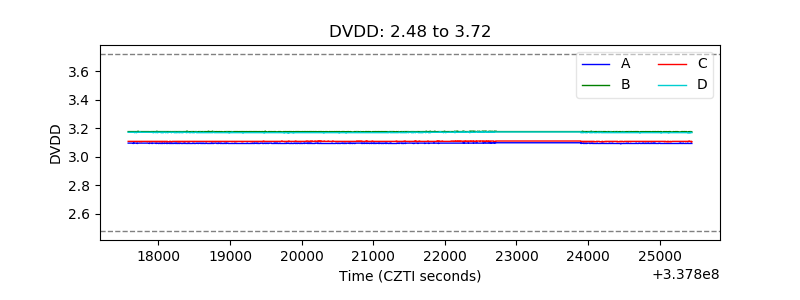 |
| Temperature 1 | 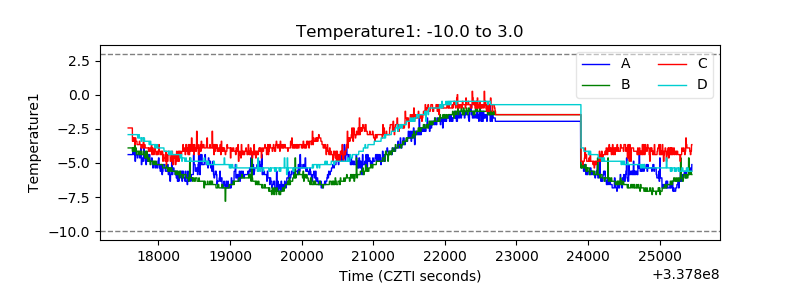 |
| Veto HV Monitor | 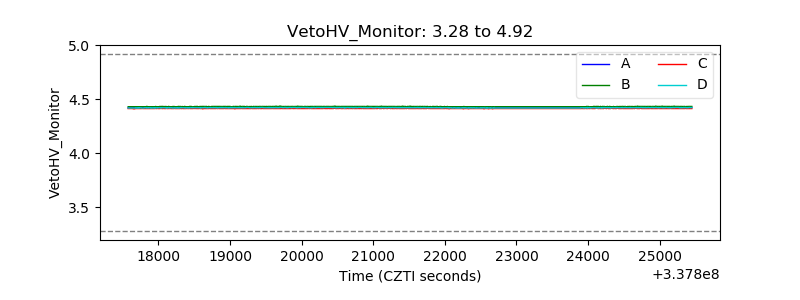 |
| Veto LLD | 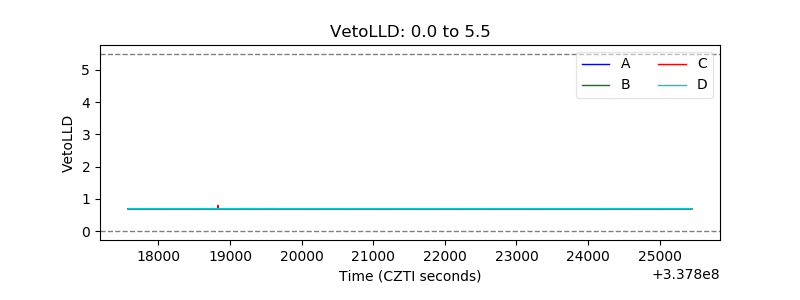 |
| Alpha Counter | 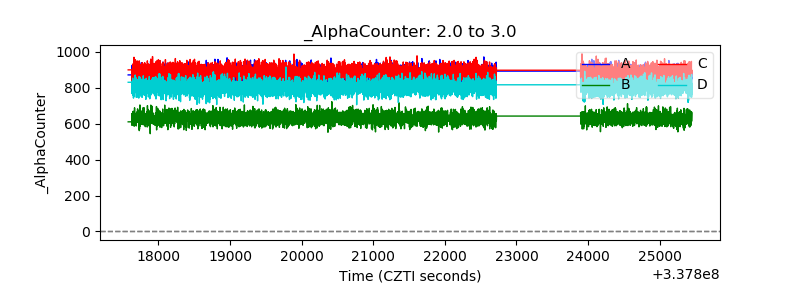 |
| _CPM_Rate | 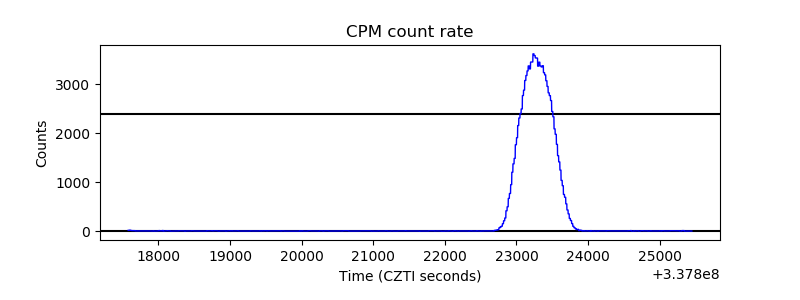 |
| CZT Counter | 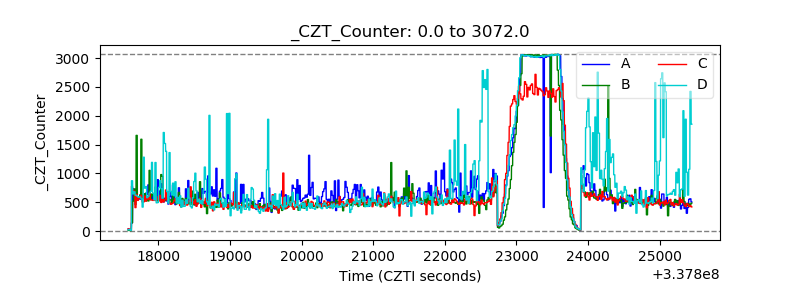 |
| +2.5 Volts monitor |  |
| +5 Volts monitor | 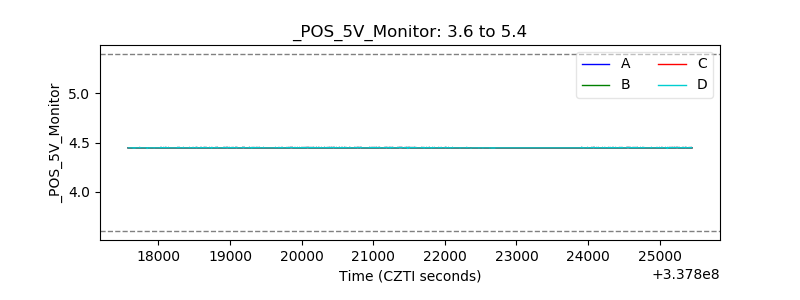 |
| _ROLL_ROT | 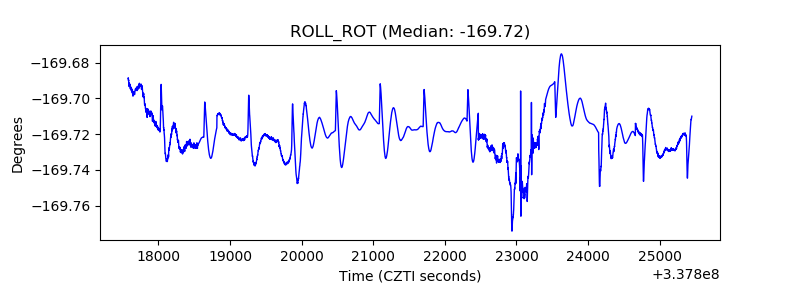 |
| _Roll_DEC | 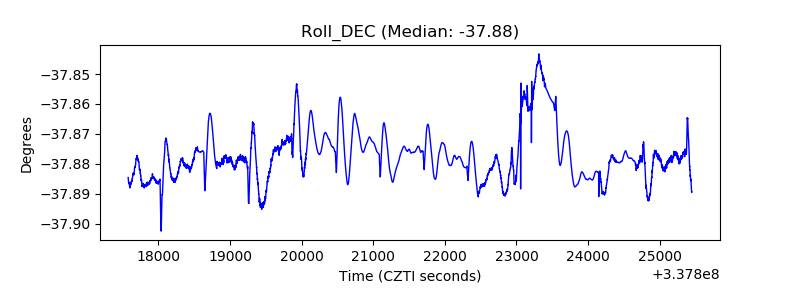 |
| _Roll_RA | 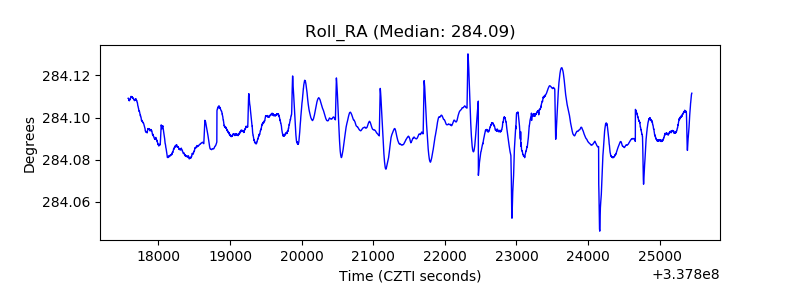 |
| Veto Counter | 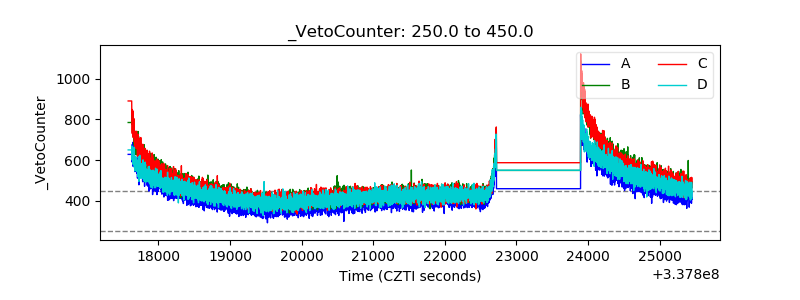 |