| Param | Original file | Final file |
|---|---|---|
| Filename | modeM0/AS1T03_224T01_9000003868_26849cztM0_level2.evt | modeM0/AS1T03_224T01_9000003868_26849cztM0_level2_quad_clean.evt |
| Size (bytes) | 1,911,104,640 | 277,485,120 |
| Size | 1.8 GB | 264.6 MB |
| Events in quadrant A | 13,468,577 | 1,760,083 |
| Events in quadrant B | 14,097,361 | 1,778,392 |
| Events in quadrant C | 11,042,850 | 1,754,361 |
| Events in quadrant D | 17,771,436 | 1,580,088 |
| Mode M0 | |||
|---|---|---|---|
| Quadrant | BADHDUFLAG | Total packets | Discarded packets |
| A | 0 | 54473 | 0 |
| B | 0 | 55633 | 0 |
| C | 0 | 46539 | 0 |
| D | 0 | 67943 | 0 |
| Mode M9 | |||
|---|---|---|---|
| Quadrant | BADHDUFLAG | Total packets | Discarded packets |
| A | 0 | 46 | 0 |
| B | 0 | 46 | 0 |
| C | 0 | 46 | 0 |
| D | 0 | 46 | 0 |
| Quadrant | Total seconds | Saturated seconds | Saturation percentage |
|---|---|---|---|
| A | 22236 | 227 | 1.020867% |
| B | 22236 | 1004 | 4.515201% |
| C | 22236 | 226 | 1.016370% |
| D | 22236 | 1902 | 8.553697% |
Noise dominated data is calculated using 1-second bins in cleaned event files. If a bin has >2000 counts, and if more than 50% of those come from <1% of pixels, then it is considered to be noise-dominated and hence unusable.
| Quadrant | # 1 sec bins | Bins with >0 counts | Bins with >2000 counts | High rate bins dominated by noise | Noise dominated (total time) | Noise dominated (detector-on time) | Marked lightcurve |
|---|---|---|---|---|---|---|---|
| A | 26641 | 22240 | 73 | 73 | 0.27% | 0.33% | 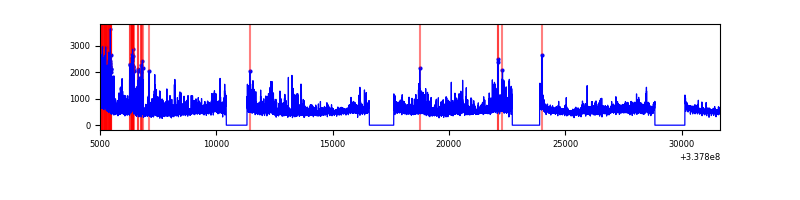 |
| B | 26641 | 22239 | 807 | 807 | 3.03% | 3.63% | 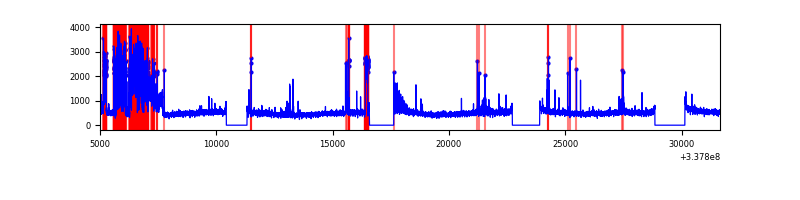 |
| C | 26641 | 22240 | 8 | 8 | 0.03% | 0.04% | 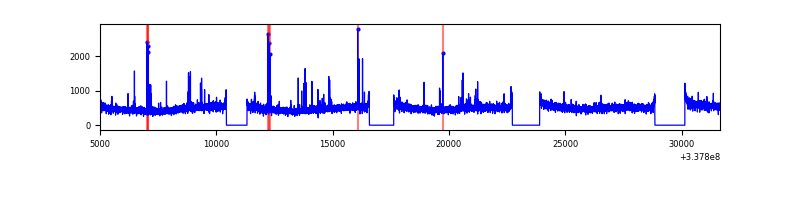 |
| D | 26641 | 22239 | 1607 | 1607 | 6.03% | 7.23% | 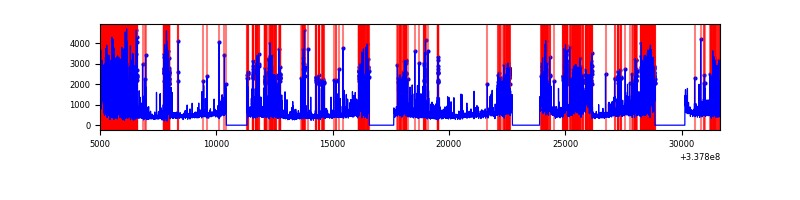 |
Top three noisy pixels from each quadrant. If the there are fewer than three noisy pixels in the level2.evt file, extra rows are filled as -1
| Pixel properties | Quadrant properties | ||||||
|---|---|---|---|---|---|---|---|
| Quadrant | DetID | PixID | Counts | Sigma | Mean | Median | Sigma |
| A | 0 | 13 | 2791957 | 5078.03 | 2765 | 2714 | 549.3 |
| A | 13 | 254 | 36608 | 61.71 | 2765 | 2714 | 549.3 |
| A | 3 | 137 | 25222 | 40.98 | 2765 | 2714 | 549.3 |
| B | 0 | 189 | 2673688 | 5231.53 | 2749 | 2684 | 510.6 |
| B | 7 | 205 | 366730 | 713.03 | 2749 | 2684 | 510.6 |
| B | 15 | 33 | 199391 | 385.28 | 2749 | 2684 | 510.6 |
| C | 14 | 238 | 433332 | 691.52 | 2681 | 2700 | 622.7 |
| C | 15 | 208 | 141443 | 222.8 | 2681 | 2700 | 622.7 |
| C | 13 | 61 | 18359 | 25.14 | 2681 | 2700 | 622.7 |
| D | 1 | 52 | 4721350 | 7771.98 | 2566 | 2513 | 607.2 |
| D | 7 | 80 | 2735438 | 4501.16 | 2566 | 2513 | 607.2 |
| D | 2 | 250 | 470943 | 771.51 | 2566 | 2513 | 607.2 |
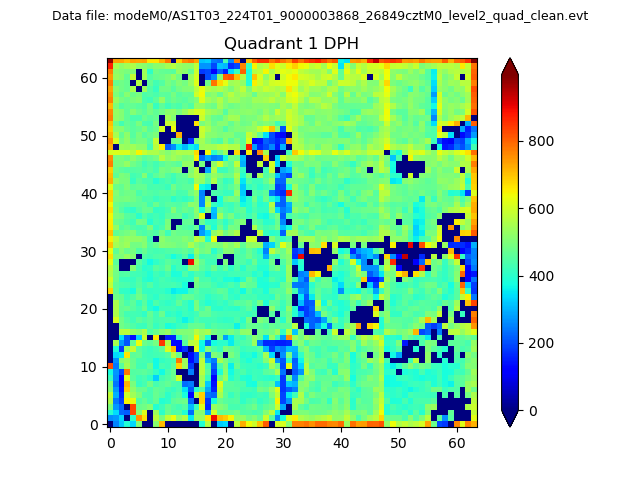
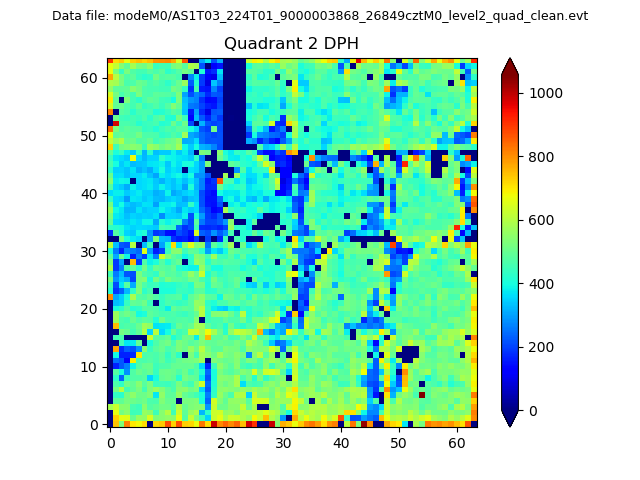
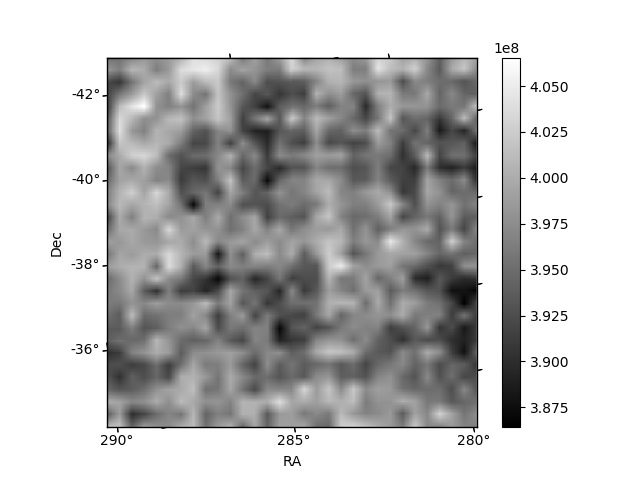
Histogram calculated using DETX and DETY for each event in the final _common_clean file
| Quadrant A |  |
 |
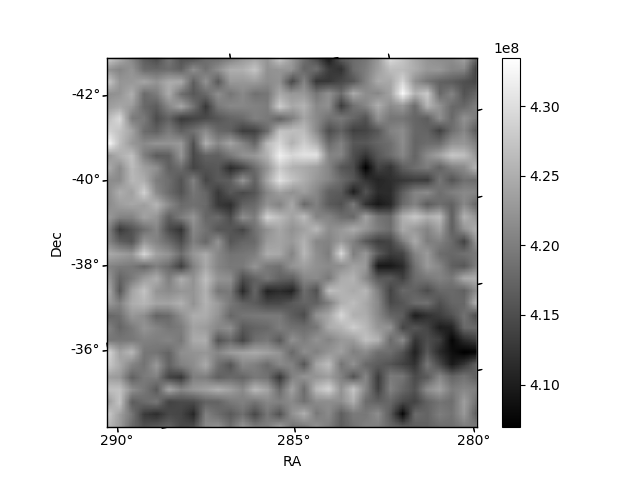
Quadrant B |
|---|---|---|---|
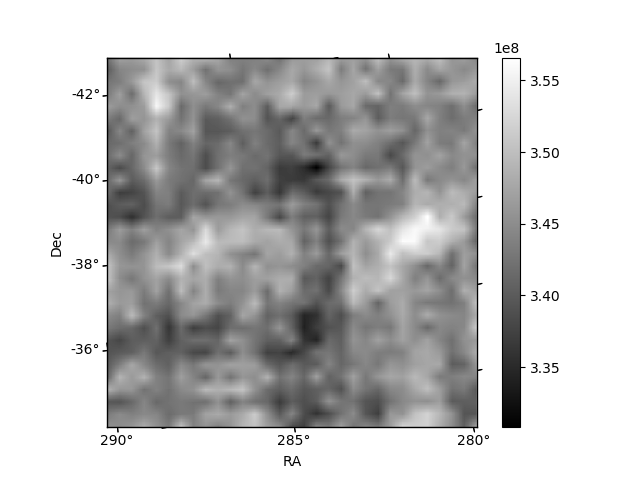
| Quadrant D |  |
 |
Quadrant C |
| Plot type | Count rate plots | Images |
|---|---|---|
| Comparison with Poisson distribution Blue bars denote a histogram of data divided into 1 sec bins. Red curve is a Poisson curve with rate = median count rate of data. |
 |
 |
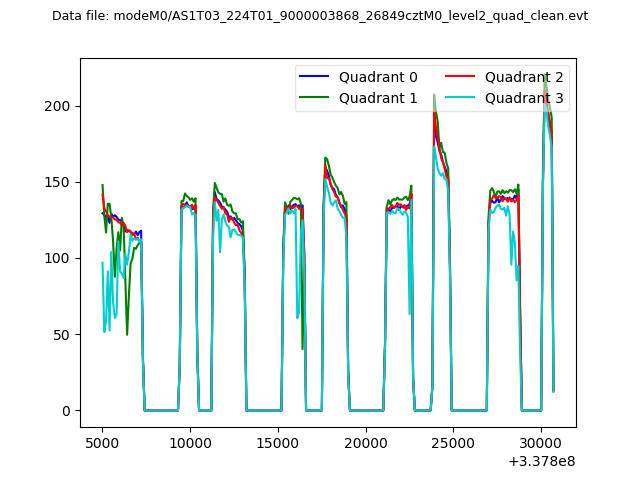
| Quadrant-wise count rates Data is divided into 100 sec bins |
 |
|
| Module-wise count rates for Quadrant A Data is divided into 100 sec bins |
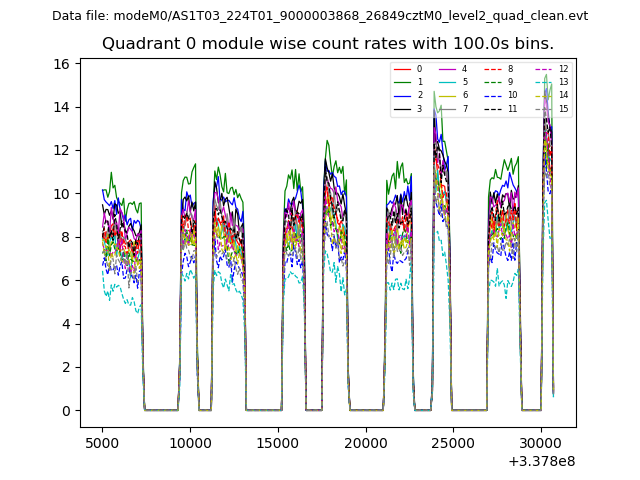 |
 |
| Module-wise count rates for Quadrant B Data is divided into 100 sec bins |
 |
 |
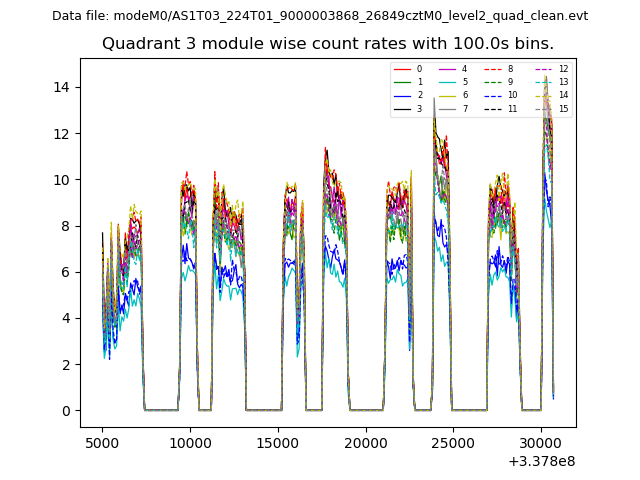
| Module-wise count rates for Quadrant C Data is divided into 100 sec bins |
 |
 |
| Module-wise count rates for Quadrant D Data is divided into 100 sec bins |
 |
 |
| Parameter | Plot |
|---|---|
| CZT HV Monitor |  |
| D_VDD | 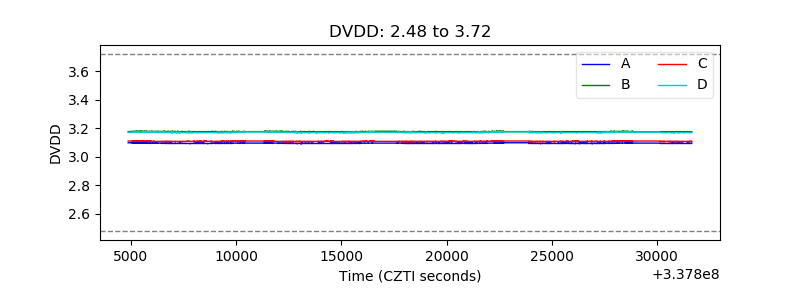 |
| Temperature 1 | 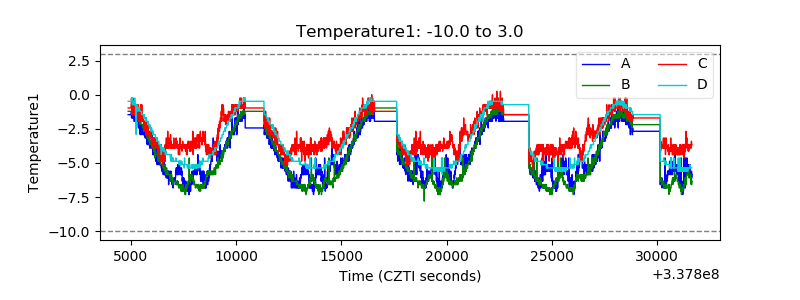 |
| Veto HV Monitor | 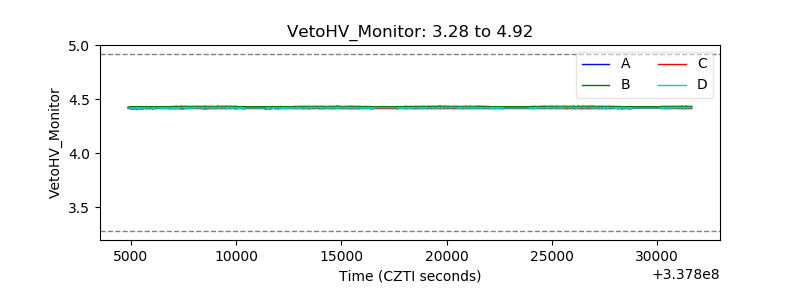 |
| Veto LLD | 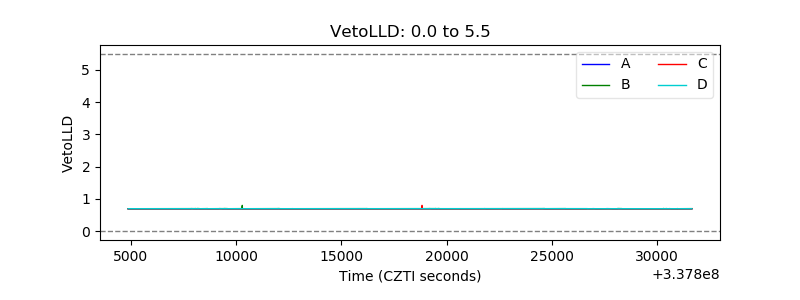 |
| Alpha Counter | 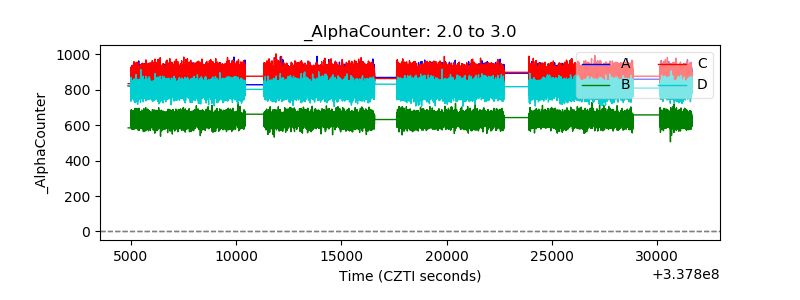 |
| _CPM_Rate | 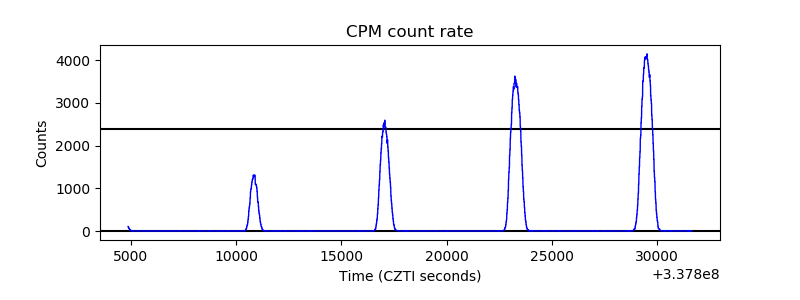 |
| CZT Counter | 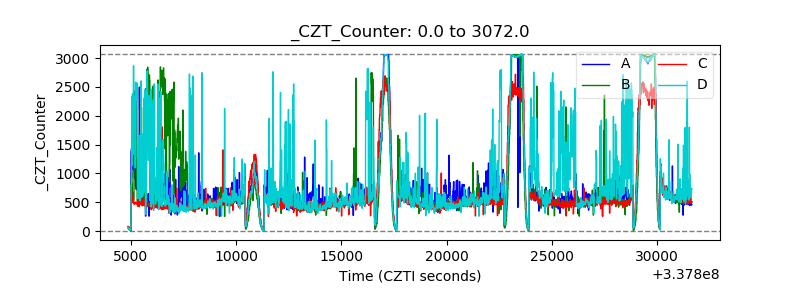 |
| +2.5 Volts monitor |  |
| +5 Volts monitor |  |
| _ROLL_ROT | 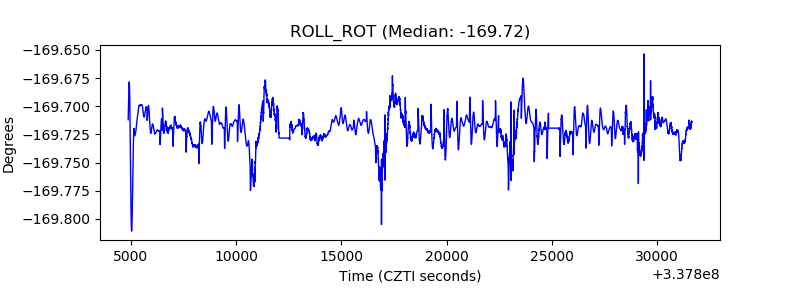 |
| _Roll_DEC | 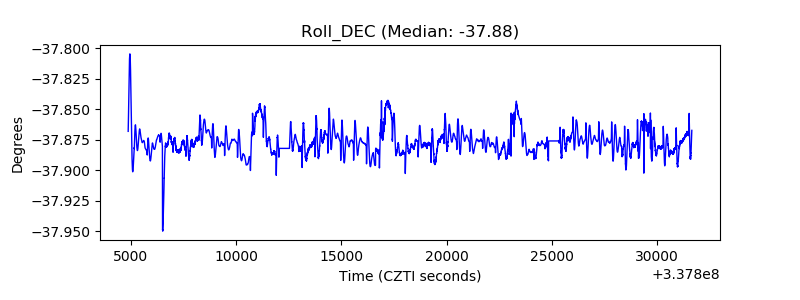 |
| _Roll_RA | 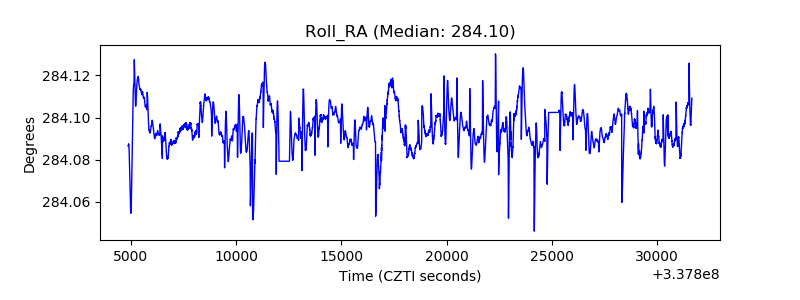 |
| Veto Counter | 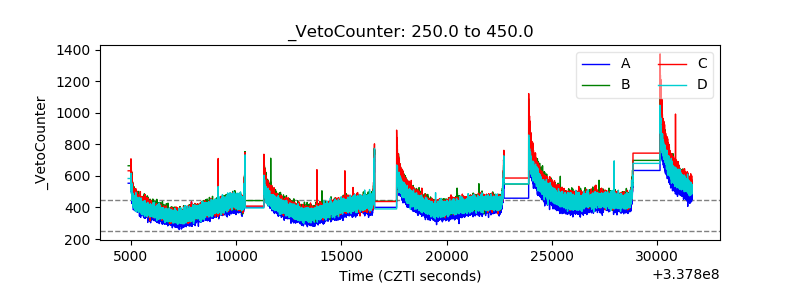 |