| Param | Original file | Final file |
|---|---|---|
| Filename | modeM0/AS1T03_224T01_9000003868_26850cztM0_level2.evt | modeM0/AS1T03_224T01_9000003868_26850cztM0_level2_quad_clean.evt |
| Size (bytes) | 530,553,600 | 66,666,240 |
| Size | 506.0 MB | 63.6 MB |
| Events in quadrant A | 3,476,404 | 409,116 |
| Events in quadrant B | 3,427,498 | 420,772 |
| Events in quadrant C | 3,373,812 | 407,962 |
| Events in quadrant D | 5,385,177 | 362,858 |
| Mode M0 | |||
|---|---|---|---|
| Quadrant | BADHDUFLAG | Total packets | Discarded packets |
| A | 0 | 13930 | 0 |
| B | 0 | 13717 | 0 |
| C | 0 | 13527 | 0 |
| D | 0 | 20053 | 0 |
| Mode M9 | |||
|---|---|---|---|
| Quadrant | BADHDUFLAG | Total packets | Discarded packets |
| A | 0 | 14 | 0 |
| B | 0 | 14 | 0 |
| C | 0 | 14 | 0 |
| D | 0 | 14 | 0 |
| Quadrant | Total seconds | Saturated seconds | Saturation percentage |
|---|---|---|---|
| A | 5983 | 18 | 0.300852% |
| B | 5983 | 73 | 1.220124% |
| C | 5983 | 67 | 1.119840% |
| D | 5984 | 517 | 8.639706% |
Noise dominated data is calculated using 1-second bins in cleaned event files. If a bin has >2000 counts, and if more than 50% of those come from <1% of pixels, then it is considered to be noise-dominated and hence unusable.
| Quadrant | # 1 sec bins | Bins with >0 counts | Bins with >2000 counts | High rate bins dominated by noise | Noise dominated (total time) | Noise dominated (detector-on time) | Marked lightcurve |
|---|---|---|---|---|---|---|---|
| A | 7373 | 5984 | 1 | 1 | 0.01% | 0.02% | 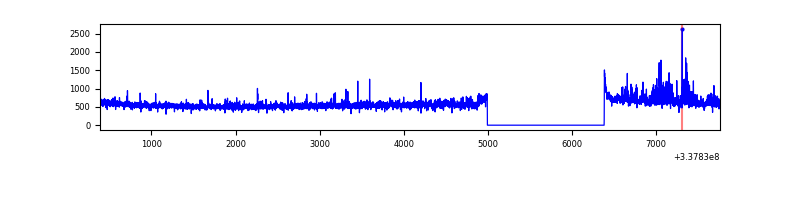 |
| B | 7373 | 5984 | 24 | 24 | 0.33% | 0.40% | 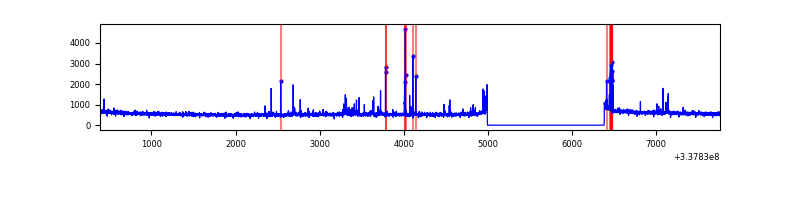 |
| C | 7373 | 5984 | 9 | 9 | 0.12% | 0.15% | 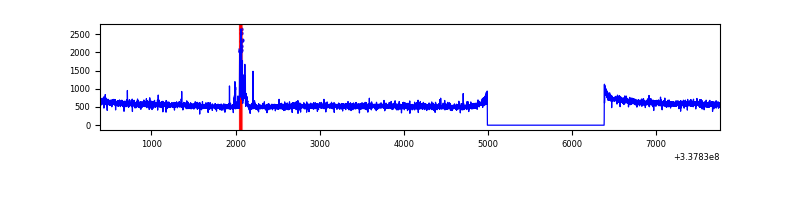 |
| D | 7374 | 5984 | 409 | 409 | 5.55% | 6.83% | 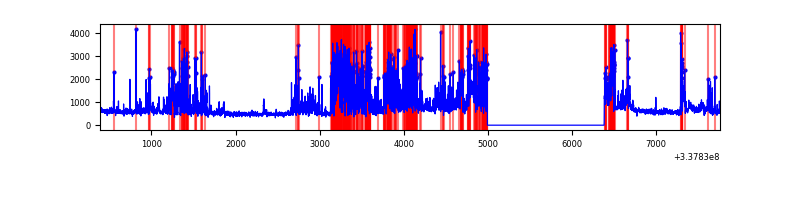 |
Top three noisy pixels from each quadrant. If the there are fewer than three noisy pixels in the level2.evt file, extra rows are filled as -1
| Pixel properties | Quadrant properties | ||||||
|---|---|---|---|---|---|---|---|
| Quadrant | DetID | PixID | Counts | Sigma | Mean | Median | Sigma |
| A | 0 | 13 | 258422 | 1593.73 | 826 | 815 | 161.6 |
| A | 12 | 96 | 32061 | 193.31 | 826 | 815 | 161.6 |
| A | 13 | 254 | 9381 | 53.0 | 826 | 815 | 161.6 |
| B | 10 | 246 | 148951 | 985.2 | 828 | 812 | 150.4 |
| B | 15 | 33 | 23649 | 151.88 | 828 | 812 | 150.4 |
| B | 12 | 111 | 17550 | 111.31 | 828 | 812 | 150.4 |
| C | 14 | 238 | 133050 | 708.18 | 811 | 818 | 186.7 |
| C | 7 | 87 | 75262 | 398.69 | 811 | 818 | 186.7 |
| C | 2 | 16 | 6625 | 31.1 | 811 | 818 | 186.7 |
| D | 7 | 80 | 2188301 | 11898.41 | 783 | 768 | 183.9 |
| D | 1 | 52 | 161477 | 874.13 | 783 | 768 | 183.9 |
| D | 2 | 250 | 68048 | 365.95 | 783 | 768 | 183.9 |
Histogram calculated using DETX and DETY for each event in the final _common_clean file
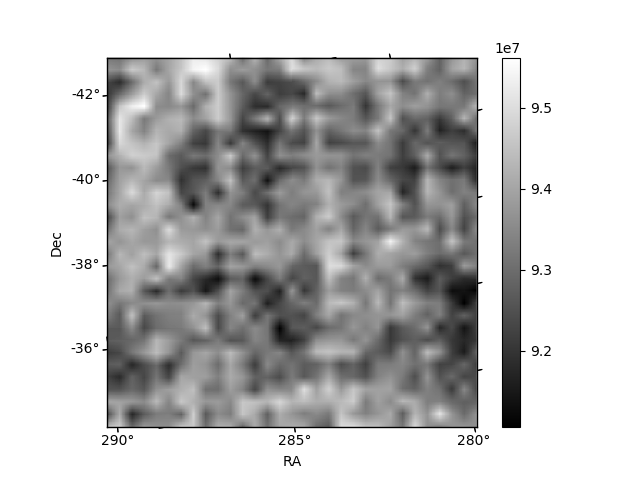
| Quadrant A |  |
 |
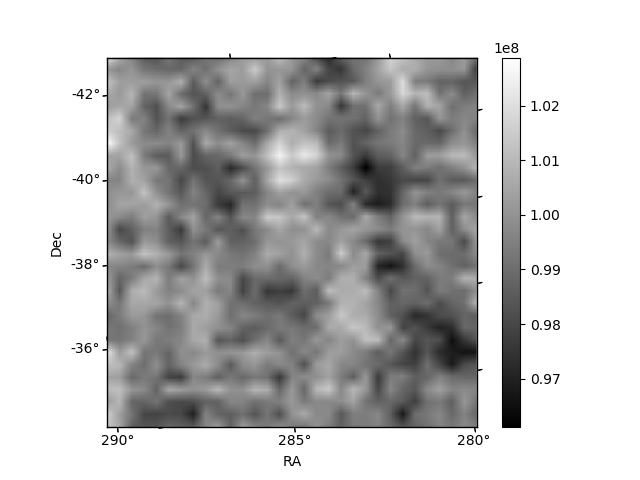
Quadrant B |
|---|---|---|---|
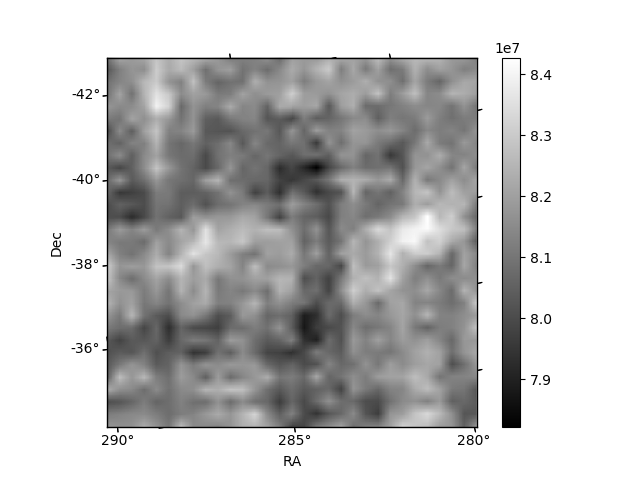
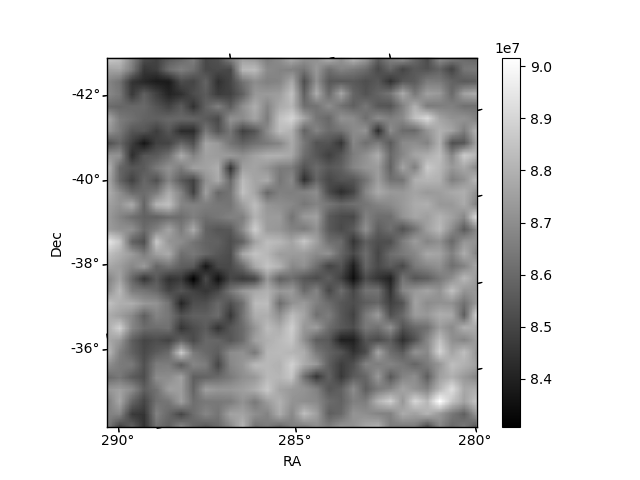
| Quadrant D |  |
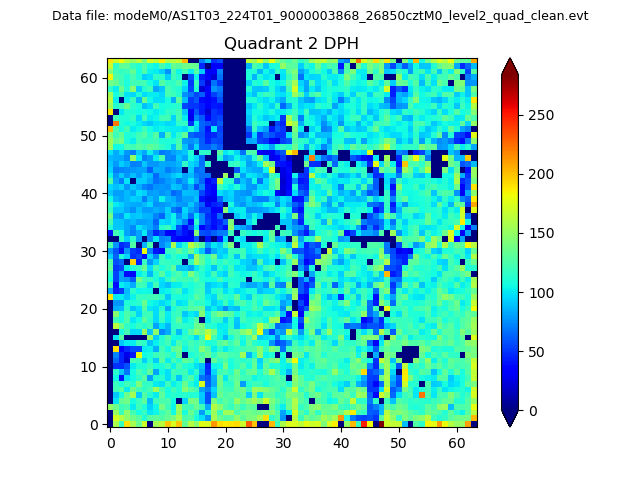 |
Quadrant C |
| Plot type | Count rate plots | Images |
|---|---|---|
| Comparison with Poisson distribution Blue bars denote a histogram of data divided into 1 sec bins. Red curve is a Poisson curve with rate = median count rate of data. |
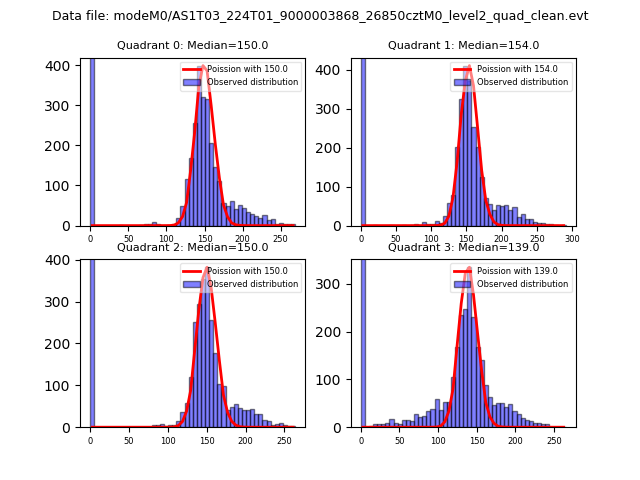 |
 |
| Quadrant-wise count rates Data is divided into 100 sec bins |
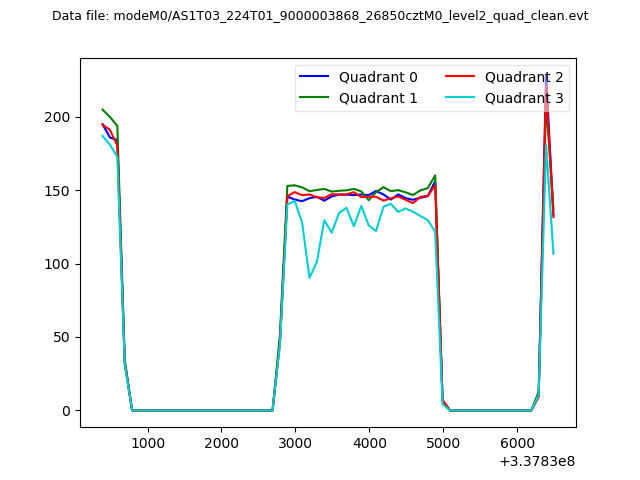 |
|
| Module-wise count rates for Quadrant A Data is divided into 100 sec bins |
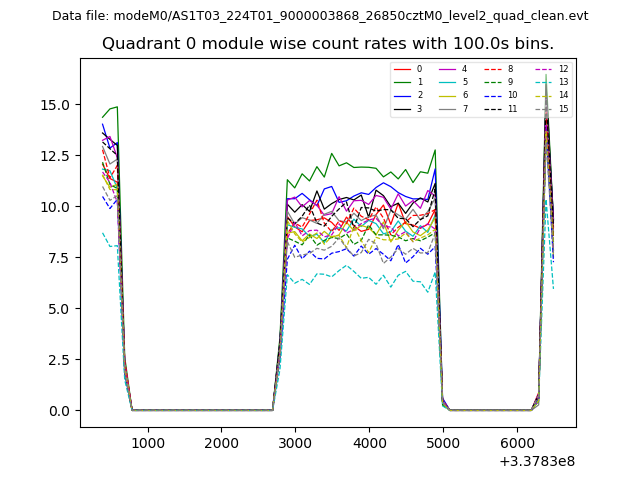 |
 |
| Module-wise count rates for Quadrant B Data is divided into 100 sec bins |
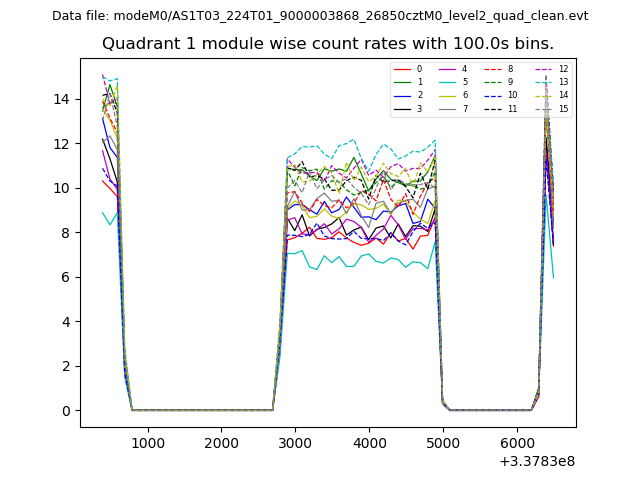 |
 |
| Module-wise count rates for Quadrant C Data is divided into 100 sec bins |
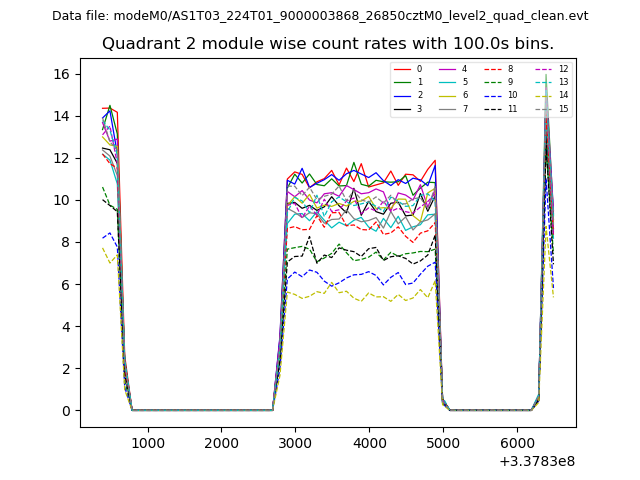 |
 |
| Module-wise count rates for Quadrant D Data is divided into 100 sec bins |
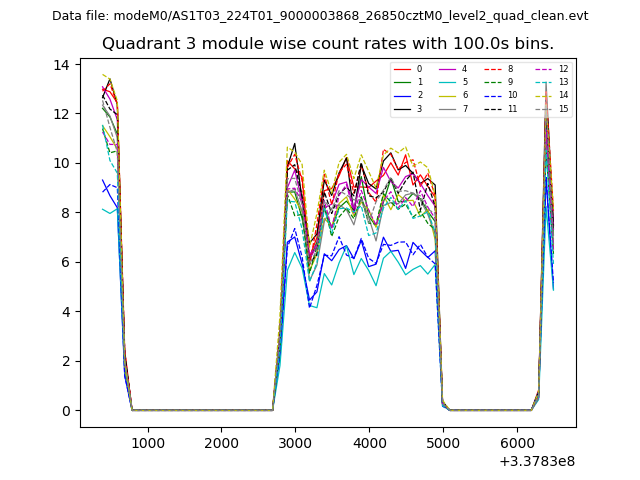 |
 |
| Parameter | Plot |
|---|---|
| CZT HV Monitor | 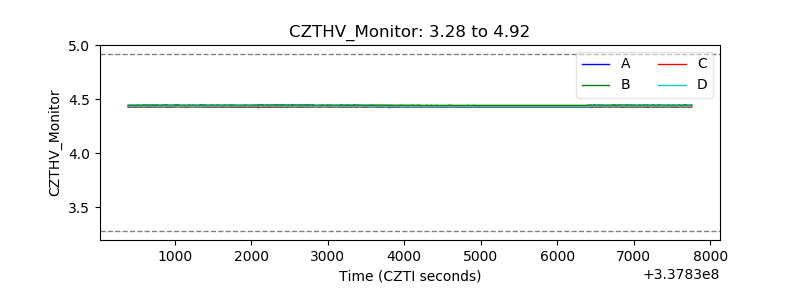 |
| D_VDD | 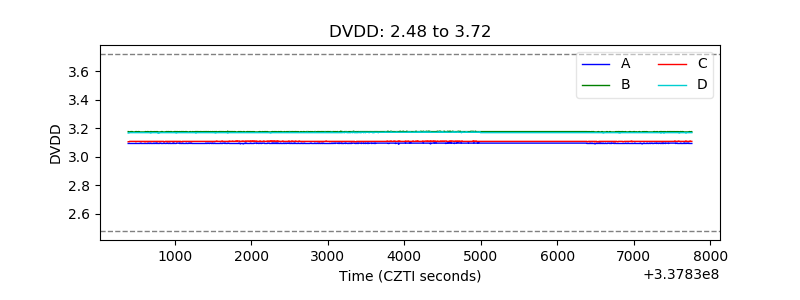 |
| Temperature 1 | 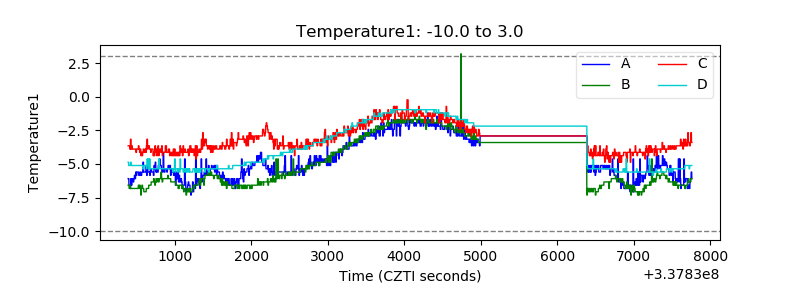 |
| Veto HV Monitor | 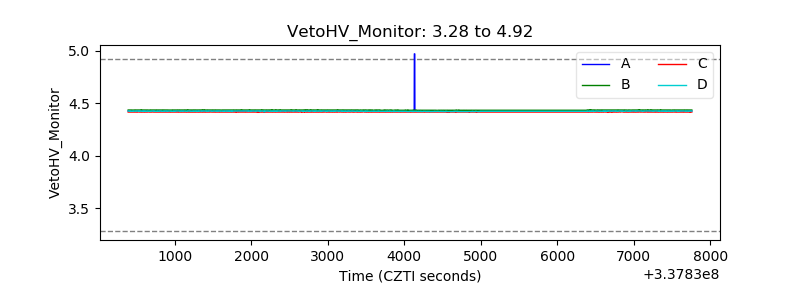 |
| Veto LLD |  |
| Alpha Counter | 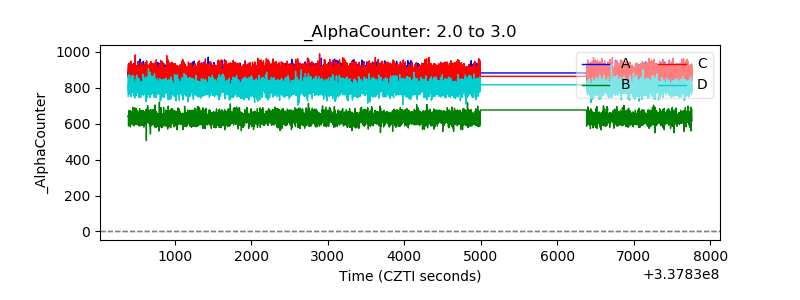 |
| _CPM_Rate | 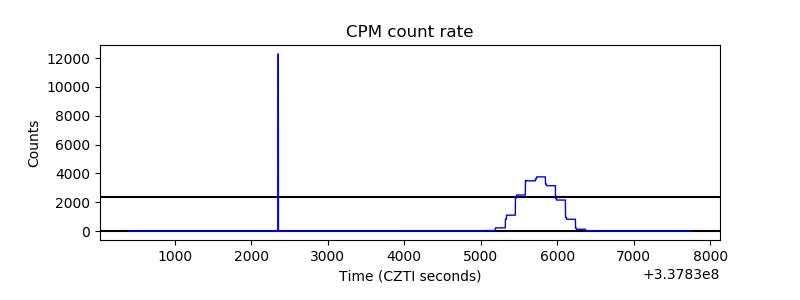 |
| CZT Counter | 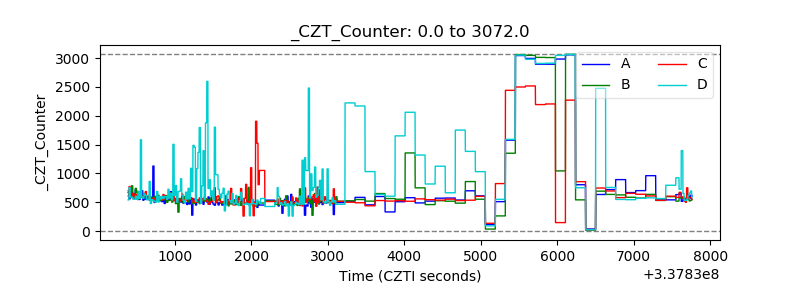 |
| +2.5 Volts monitor |  |
| +5 Volts monitor | 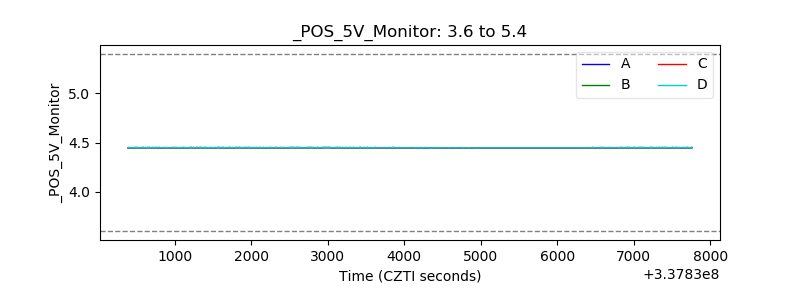 |
| _ROLL_ROT | 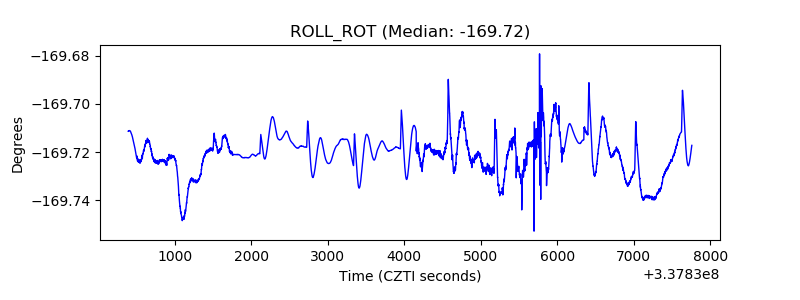 |
| _Roll_DEC | 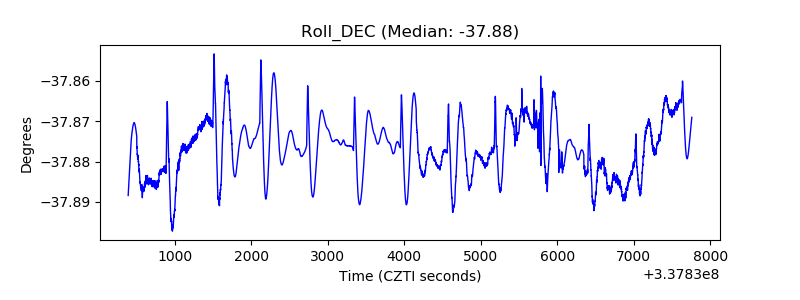 |
| _Roll_RA | 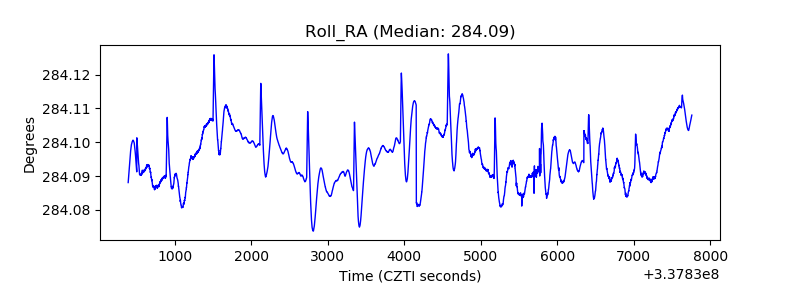 |
| Veto Counter | 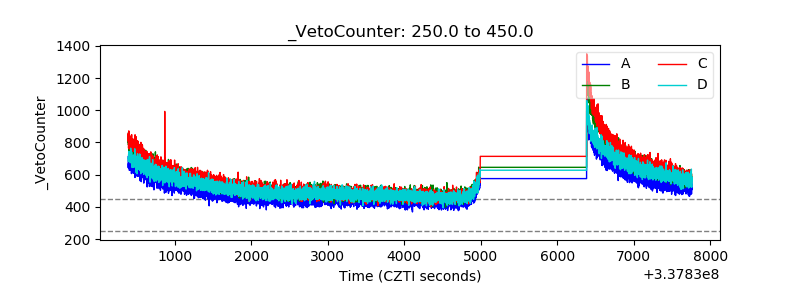 |