| Param | Original file | Final file |
|---|---|---|
| Filename | modeM0/AS1T03_224T01_9000003868_26851cztM0_level2.evt | modeM0/AS1T03_224T01_9000003868_26851cztM0_level2_quad_clean.evt |
| Size (bytes) | 609,324,480 | 64,154,880 |
| Size | 581.1 MB | 61.2 MB |
| Events in quadrant A | 4,026,510 | 409,970 |
| Events in quadrant B | 3,614,214 | 425,714 |
| Events in quadrant C | 3,554,491 | 413,606 |
| Events in quadrant D | 6,835,635 | 256,453 |
| Mode M0 | |||
|---|---|---|---|
| Quadrant | BADHDUFLAG | Total packets | Discarded packets |
| A | 0 | 16197 | 0 |
| B | 0 | 14477 | 0 |
| C | 0 | 14355 | 0 |
| D | 0 | 24442 | 0 |
| Mode M9 | |||
|---|---|---|---|
| Quadrant | BADHDUFLAG | Total packets | Discarded packets |
| A | 0 | 22 | 0 |
| B | 0 | 23 | 0 |
| C | 0 | 23 | 0 |
| D | 0 | 23 | 0 |
| Quadrant | Total seconds | Saturated seconds | Saturation percentage |
|---|---|---|---|
| A | 6251 | 47 | 0.751880% |
| B | 6251 | 84 | 1.343785% |
| C | 6251 | 100 | 1.599744% |
| D | 6251 | 1280 | 20.476724% |
Noise dominated data is calculated using 1-second bins in cleaned event files. If a bin has >2000 counts, and if more than 50% of those come from <1% of pixels, then it is considered to be noise-dominated and hence unusable.
| Quadrant | # 1 sec bins | Bins with >0 counts | Bins with >2000 counts | High rate bins dominated by noise | Noise dominated (total time) | Noise dominated (detector-on time) | Marked lightcurve |
|---|---|---|---|---|---|---|---|
| A | 7661 | 6252 | 2 | 2 | 0.03% | 0.03% | 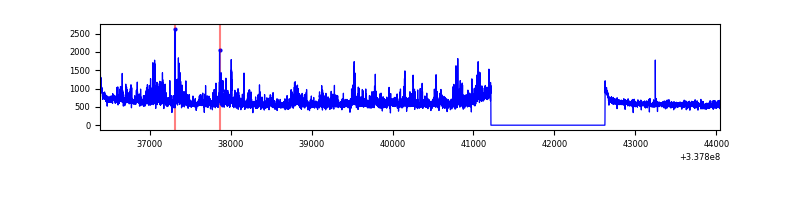 |
| B | 7661 | 6252 | 18 | 18 | 0.23% | 0.29% | 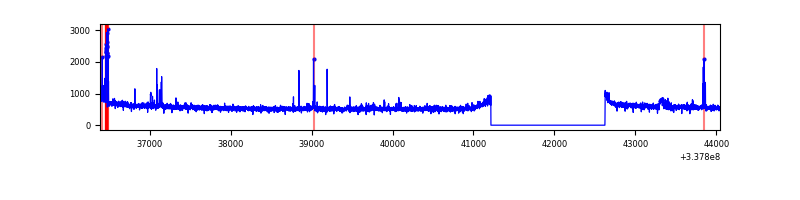 |
| C | 7661 | 6252 | 0 | 0 | 0.00% | 0.00% | 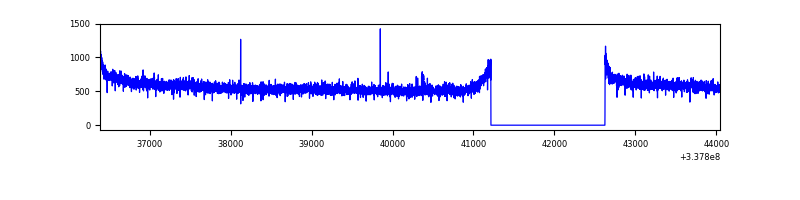 |
| D | 7661 | 6251 | 1212 | 1212 | 15.82% | 19.39% | 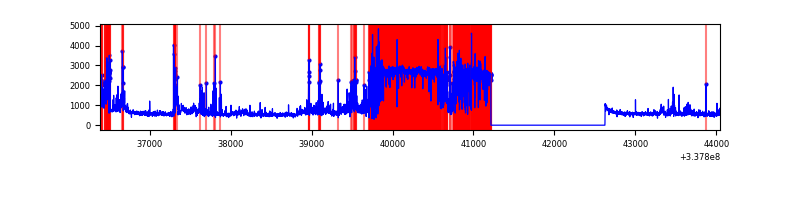 |
Top three noisy pixels from each quadrant. If the there are fewer than three noisy pixels in the level2.evt file, extra rows are filled as -1
| Pixel properties | Quadrant properties | ||||||
|---|---|---|---|---|---|---|---|
| Quadrant | DetID | PixID | Counts | Sigma | Mean | Median | Sigma |
| A | 0 | 13 | 600183 | 3474.83 | 888 | 876 | 172.5 |
| A | 13 | 254 | 9165 | 48.06 | 888 | 876 | 172.5 |
| A | 0 | 226 | 7440 | 38.06 | 888 | 876 | 172.5 |
| B | 10 | 246 | 86876 | 526.63 | 890 | 873 | 163.3 |
| B | 0 | 229 | 29013 | 172.31 | 890 | 873 | 163.3 |
| B | 12 | 111 | 18816 | 109.87 | 890 | 873 | 163.3 |
| C | 14 | 238 | 142499 | 706.8 | 873 | 882 | 200.4 |
| C | 7 | 87 | 9327 | 42.15 | 873 | 882 | 200.4 |
| C | 13 | 61 | 6030 | 25.69 | 873 | 882 | 200.4 |
| D | 7 | 80 | 3747808 | 21220.87 | 750 | 736 | 176.6 |
| D | 2 | 250 | 123188 | 693.48 | 750 | 736 | 176.6 |
| D | 1 | 52 | 87098 | 489.1 | 750 | 736 | 176.6 |
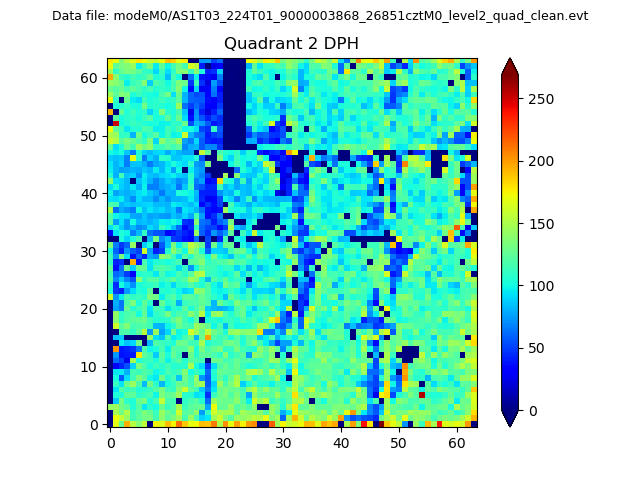
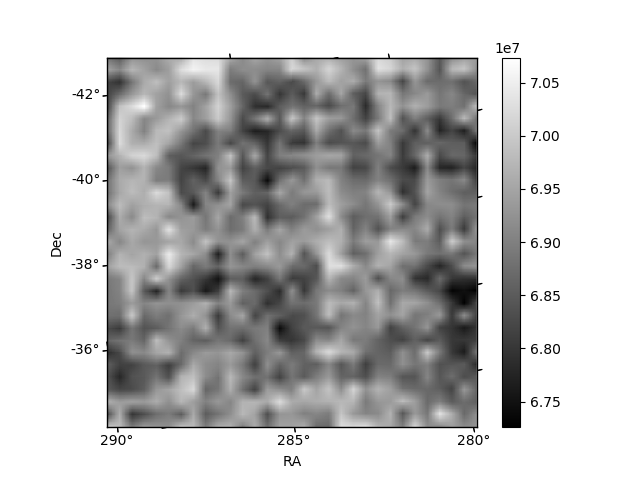
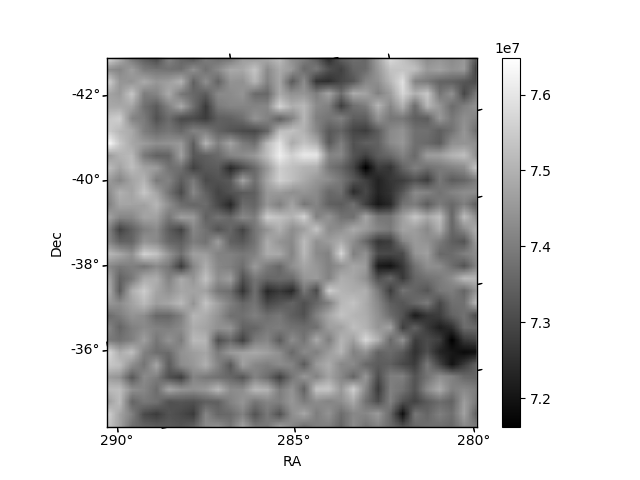
Histogram calculated using DETX and DETY for each event in the final _common_clean file
| Quadrant A | 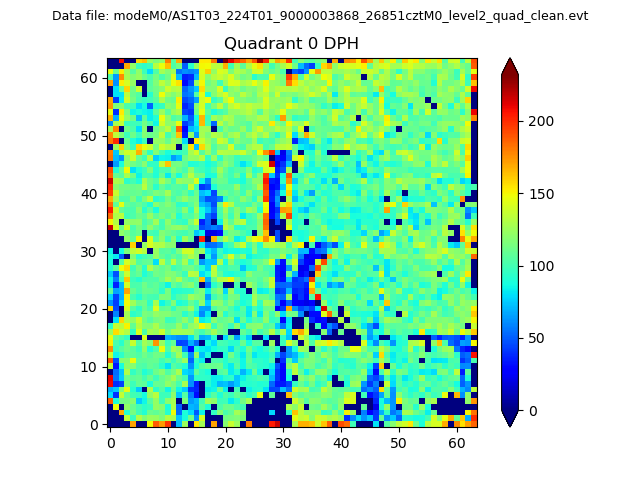 |
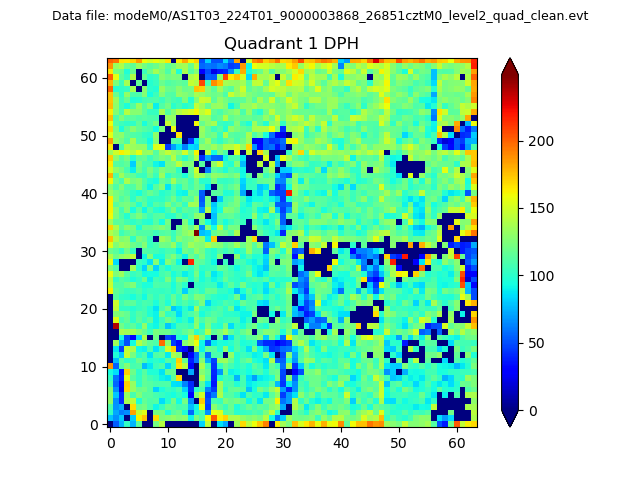 |
Quadrant B |
|---|---|---|---|
| Quadrant D | 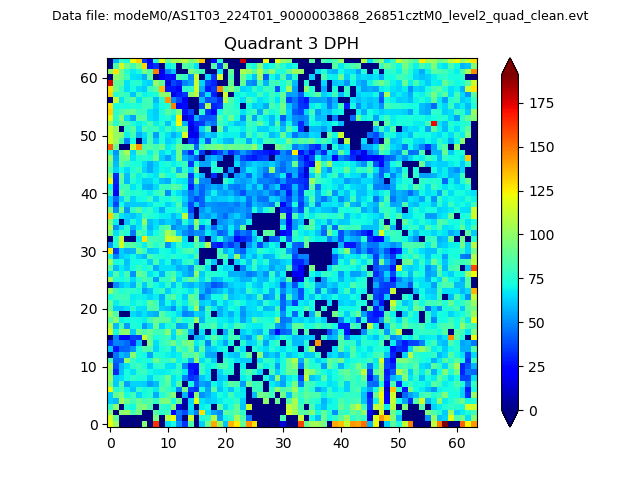 |
 |
Quadrant C |
| Plot type | Count rate plots | Images |
|---|---|---|
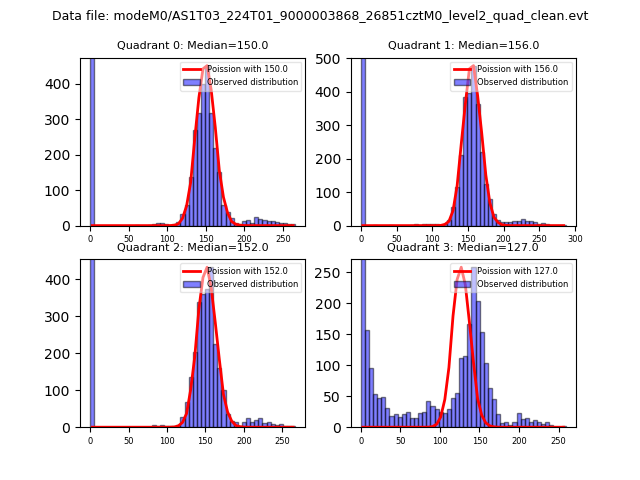
| Comparison with Poisson distribution Blue bars denote a histogram of data divided into 1 sec bins. Red curve is a Poisson curve with rate = median count rate of data. |
 |
 |
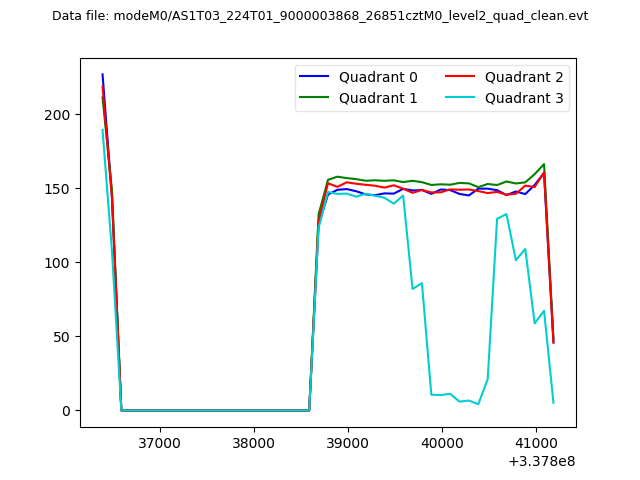
| Quadrant-wise count rates Data is divided into 100 sec bins |
 |
|
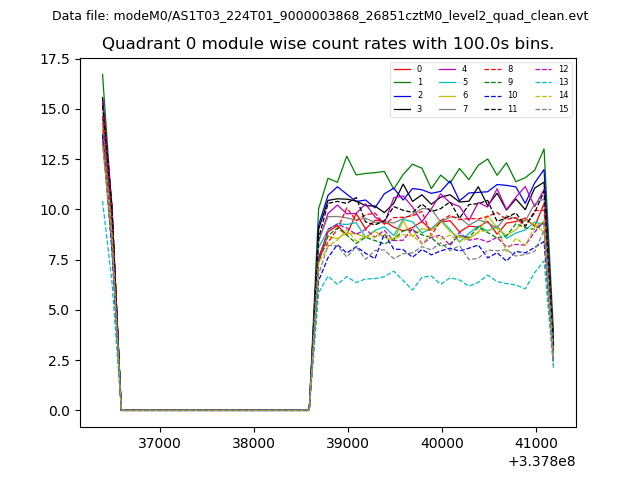
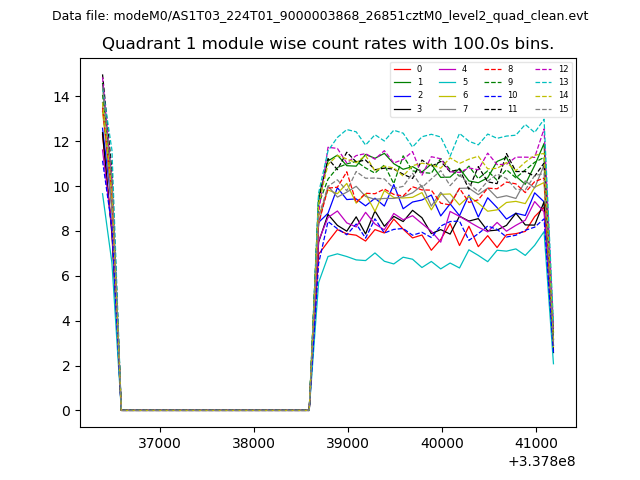
| Module-wise count rates for Quadrant A Data is divided into 100 sec bins |
 |
 |
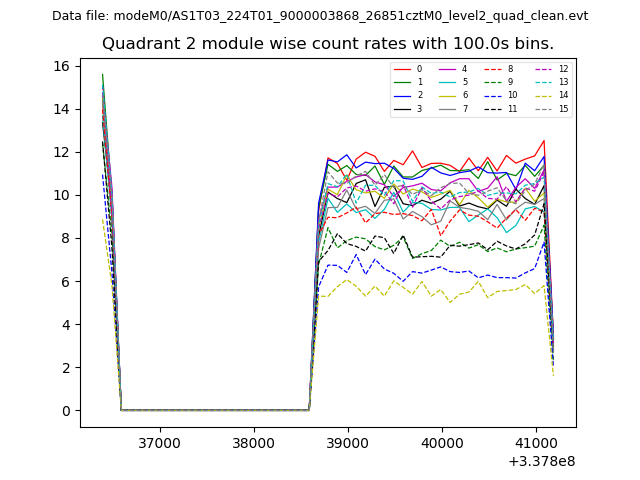
| Module-wise count rates for Quadrant B Data is divided into 100 sec bins |
 |
 |
| Module-wise count rates for Quadrant C Data is divided into 100 sec bins |
 |
 |
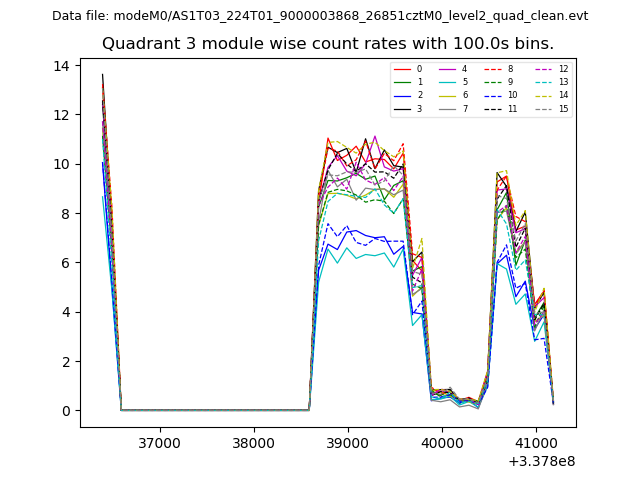
| Module-wise count rates for Quadrant D Data is divided into 100 sec bins |
 |
 |
| Parameter | Plot |
|---|---|
| CZT HV Monitor | 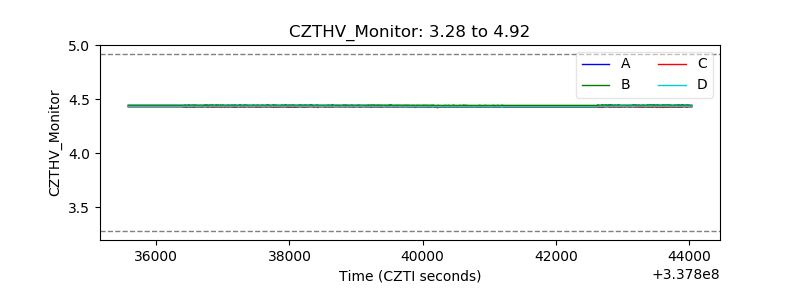 |
| D_VDD | 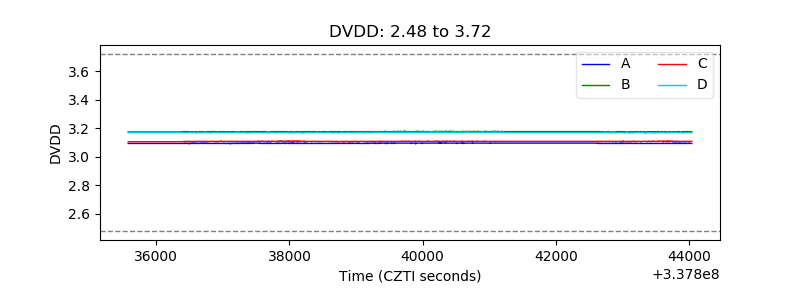 |
| Temperature 1 | 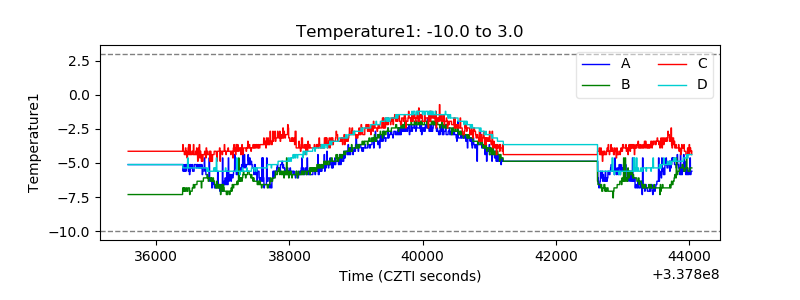 |
| Veto HV Monitor | 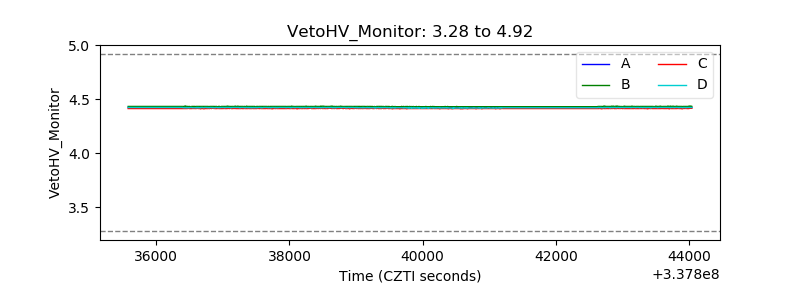 |
| Veto LLD | 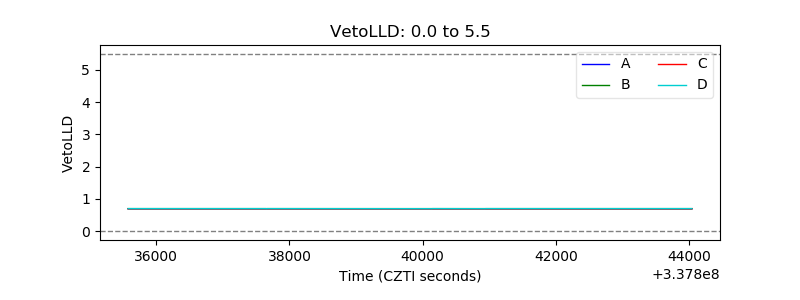 |
| Alpha Counter | 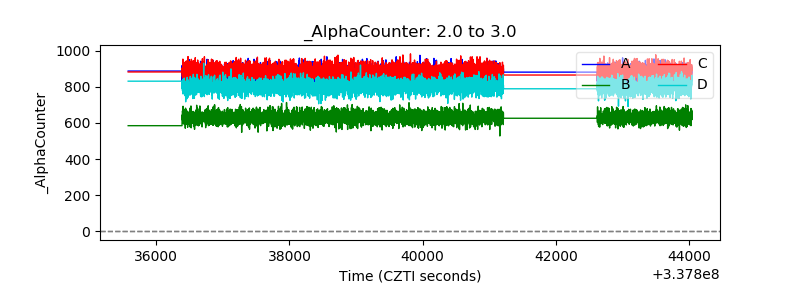 |
| _CPM_Rate | 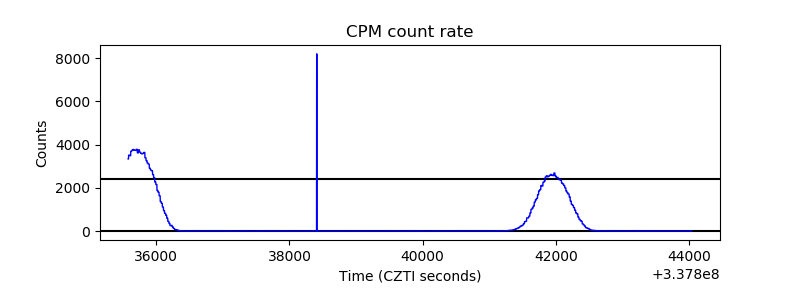 |
| CZT Counter | 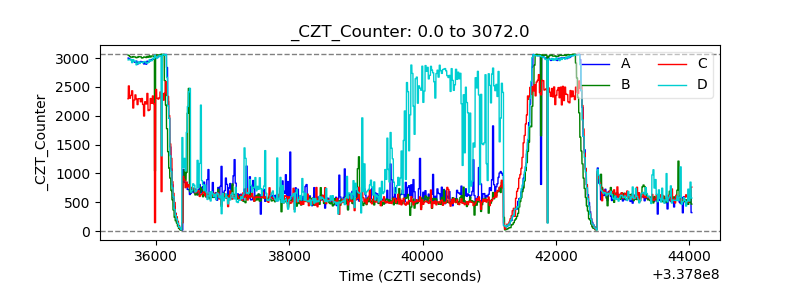 |
| +2.5 Volts monitor |  |
| +5 Volts monitor |  |
| _ROLL_ROT | 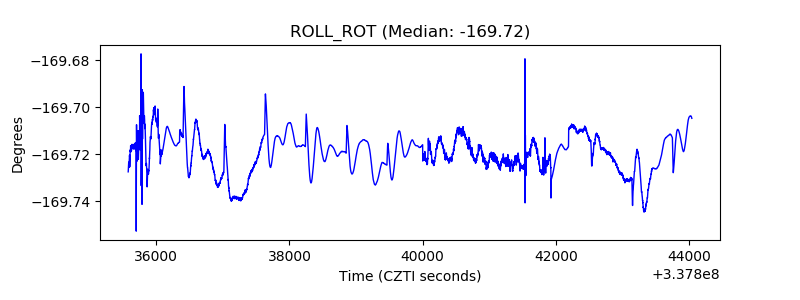 |
| _Roll_DEC | 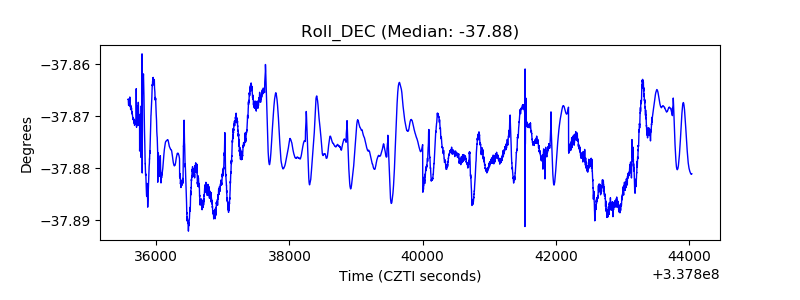 |
| _Roll_RA | 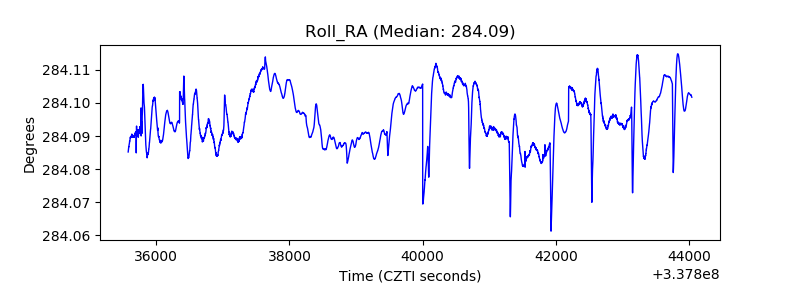 |
| Veto Counter | 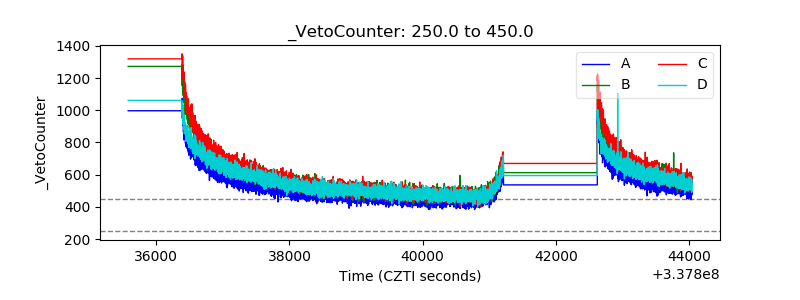 |