| Param | Original file | Final file |
|---|---|---|
| Filename | modeM0/AS1T03_224T01_9000003868_26852cztM0_level2.evt | modeM0/AS1T03_224T01_9000003868_26852cztM0_level2_quad_clean.evt |
| Size (bytes) | 532,774,080 | 72,527,040 |
| Size | 508.1 MB | 69.2 MB |
| Events in quadrant A | 4,086,316 | 438,769 |
| Events in quadrant B | 3,562,386 | 454,680 |
| Events in quadrant C | 3,435,117 | 441,968 |
| Events in quadrant D | 4,629,041 | 425,696 |
| Mode M0 | |||
|---|---|---|---|
| Quadrant | BADHDUFLAG | Total packets | Discarded packets |
| A | 0 | 16246 | 0 |
| B | 0 | 14204 | 0 |
| C | 0 | 13860 | 0 |
| D | 0 | 17689 | 0 |
| Mode M9 | |||
|---|---|---|---|
| Quadrant | BADHDUFLAG | Total packets | Discarded packets |
| A | 0 | 20 | 0 |
| B | 0 | 21 | 0 |
| C | 0 | 21 | 0 |
| D | 0 | 21 | 0 |
| Quadrant | Total seconds | Saturated seconds | Saturation percentage |
|---|---|---|---|
| A | 6225 | 81 | 1.301205% |
| B | 6225 | 109 | 1.751004% |
| C | 6225 | 124 | 1.991968% |
| D | 6225 | 344 | 5.526104% |
Noise dominated data is calculated using 1-second bins in cleaned event files. If a bin has >2000 counts, and if more than 50% of those come from <1% of pixels, then it is considered to be noise-dominated and hence unusable.
| Quadrant | # 1 sec bins | Bins with >0 counts | Bins with >2000 counts | High rate bins dominated by noise | Noise dominated (total time) | Noise dominated (detector-on time) | Marked lightcurve |
|---|---|---|---|---|---|---|---|
| A | 7555 | 6226 | 15 | 15 | 0.20% | 0.24% | 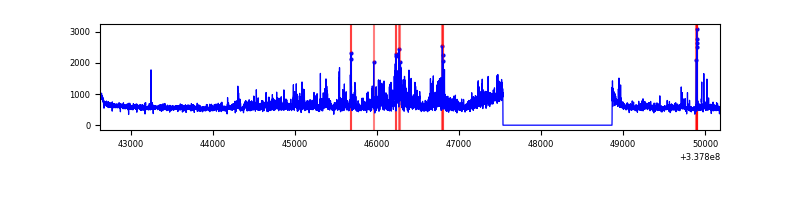 |
| B | 7555 | 6226 | 21 | 21 | 0.28% | 0.34% | 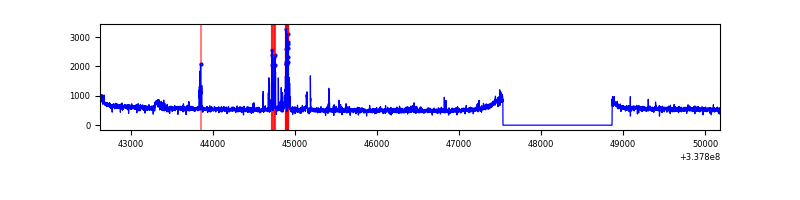 |
| C | 7555 | 6226 | 0 | 0 | 0.00% | 0.00% | 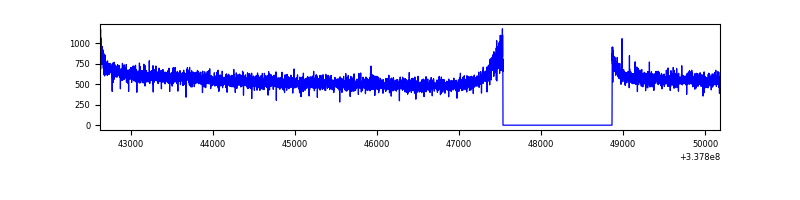 |
| D | 7555 | 6226 | 297 | 297 | 3.93% | 4.77% | 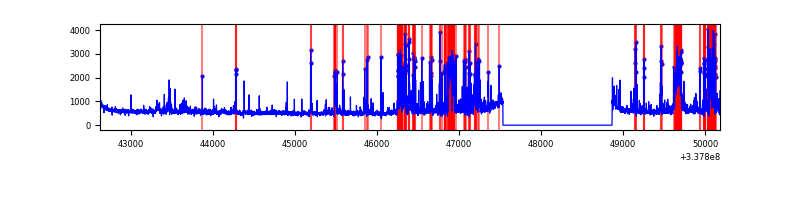 |
Top three noisy pixels from each quadrant. If the there are fewer than three noisy pixels in the level2.evt file, extra rows are filled as -1
| Pixel properties | Quadrant properties | ||||||
|---|---|---|---|---|---|---|---|
| Quadrant | DetID | PixID | Counts | Sigma | Mean | Median | Sigma |
| A | 0 | 13 | 751926 | 4409.37 | 864 | 851 | 170.3 |
| A | 13 | 254 | 9315 | 49.69 | 864 | 851 | 170.3 |
| A | 3 | 137 | 7367 | 38.25 | 864 | 851 | 170.3 |
| B | 10 | 246 | 84111 | 517.96 | 865 | 845 | 160.8 |
| B | 15 | 33 | 59410 | 364.31 | 865 | 845 | 160.8 |
| B | 12 | 111 | 18902 | 112.32 | 865 | 845 | 160.8 |
| C | 14 | 238 | 138636 | 711.79 | 845 | 854 | 193.6 |
| C | 13 | 61 | 5809 | 25.6 | 845 | 854 | 193.6 |
| C | 7 | 87 | 2344 | 7.7 | 845 | 854 | 193.6 |
| D | 1 | 52 | 1006659 | 5192.18 | 832 | 816 | 193.7 |
| D | 7 | 80 | 310662 | 1599.43 | 832 | 816 | 193.7 |
| D | 2 | 250 | 81058 | 414.21 | 832 | 816 | 193.7 |
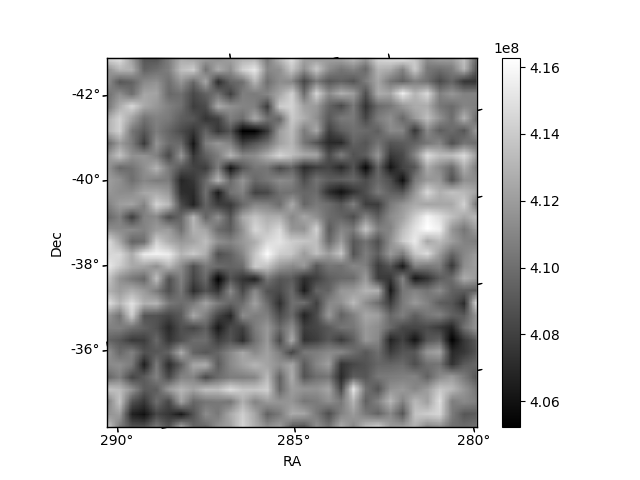
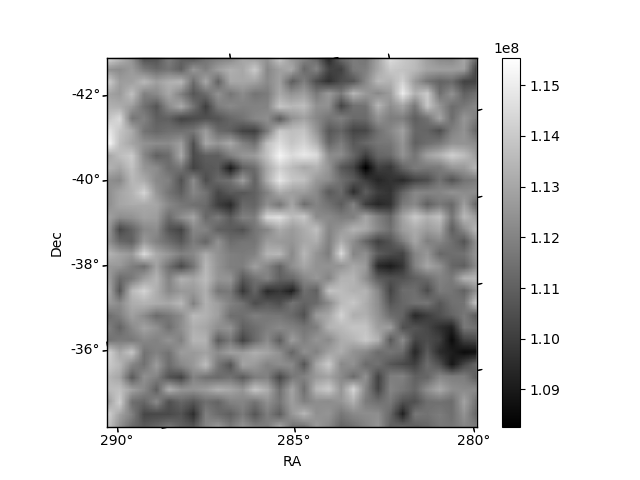
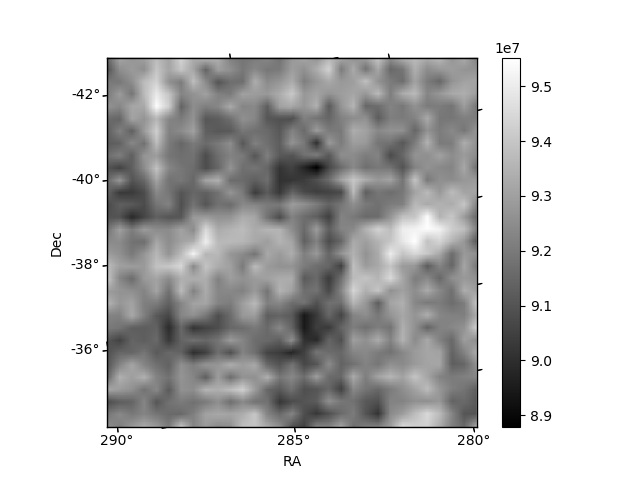
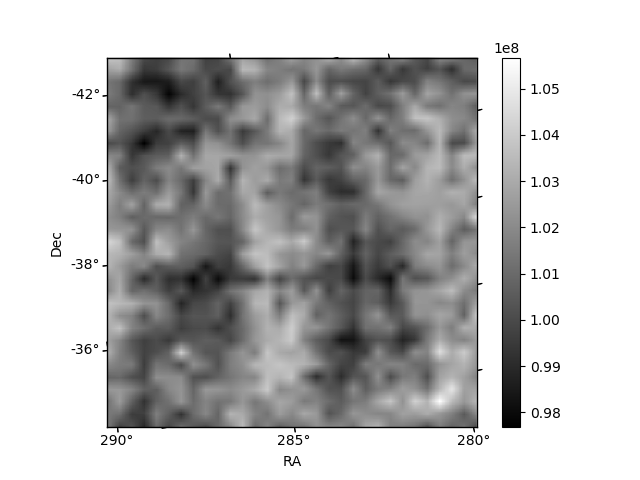
Histogram calculated using DETX and DETY for each event in the final _common_clean file
| Quadrant A | 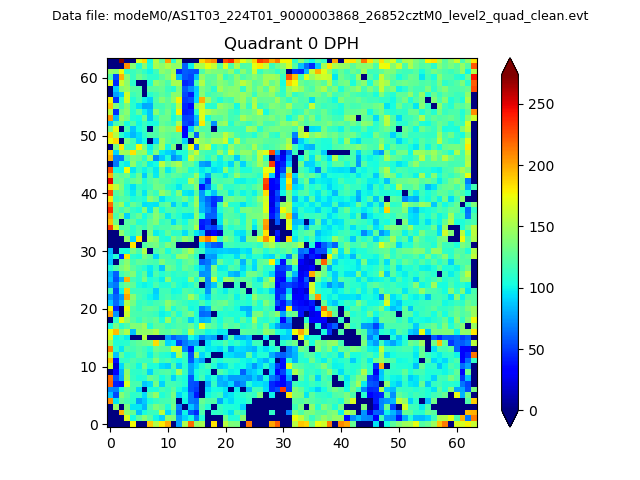 |
 |
Quadrant B |
|---|---|---|---|
| Quadrant D | 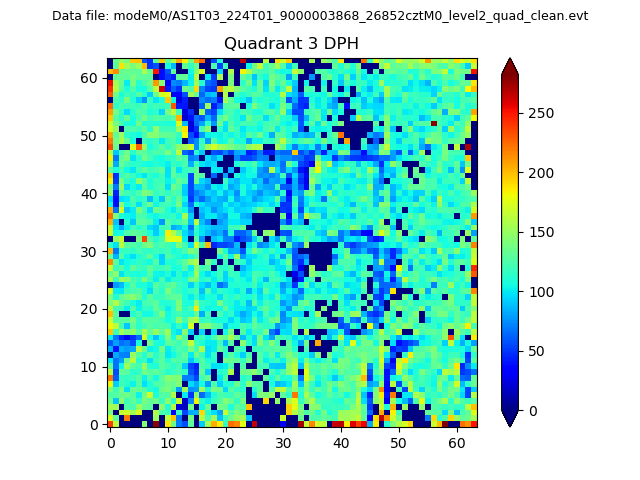 |
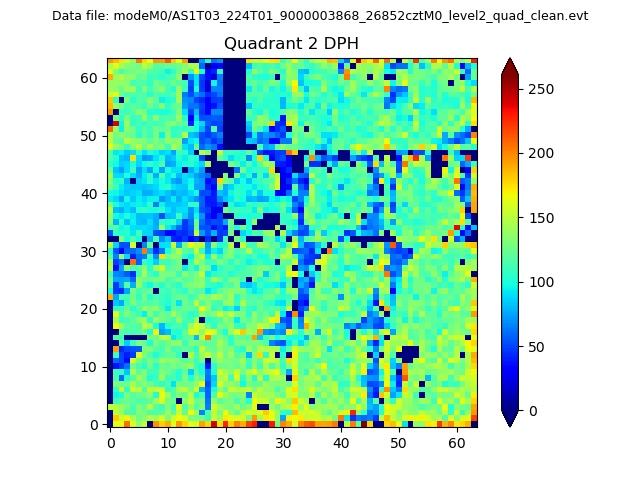 |
Quadrant C |
| Plot type | Count rate plots | Images |
|---|---|---|
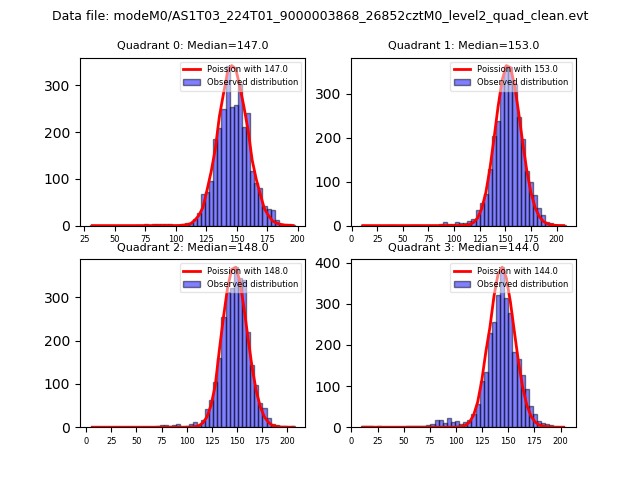
| Comparison with Poisson distribution Blue bars denote a histogram of data divided into 1 sec bins. Red curve is a Poisson curve with rate = median count rate of data. |
 |
 |
| Quadrant-wise count rates Data is divided into 100 sec bins |
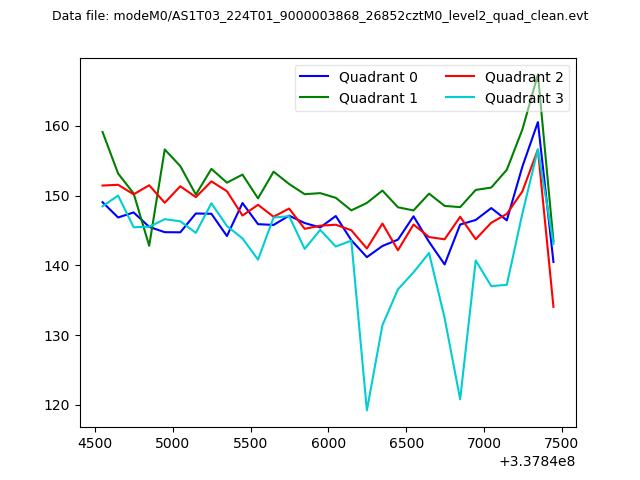 |
|
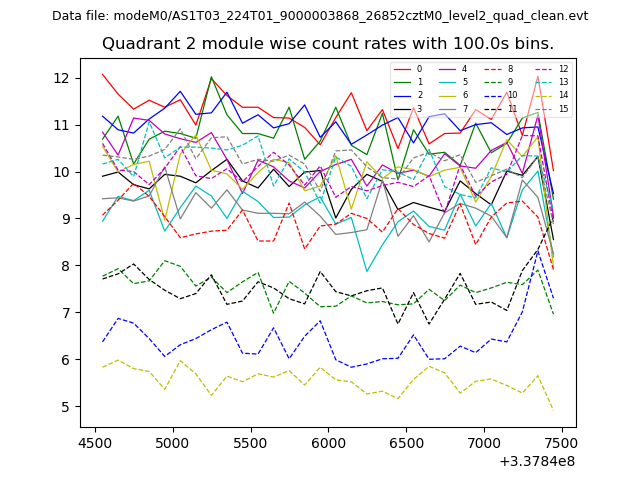
| Module-wise count rates for Quadrant A Data is divided into 100 sec bins |
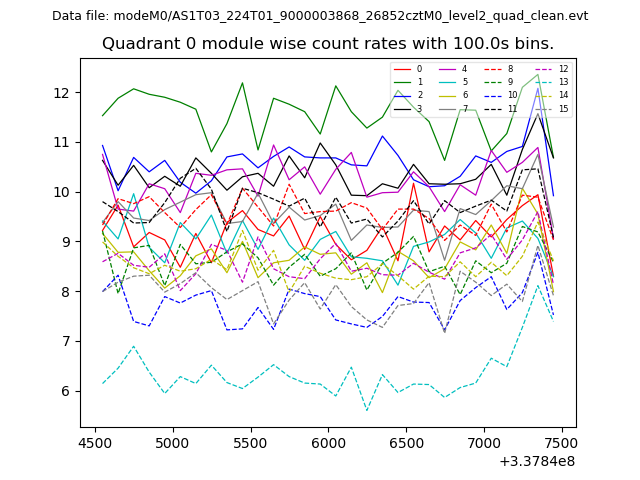 |
 |
| Module-wise count rates for Quadrant B Data is divided into 100 sec bins |
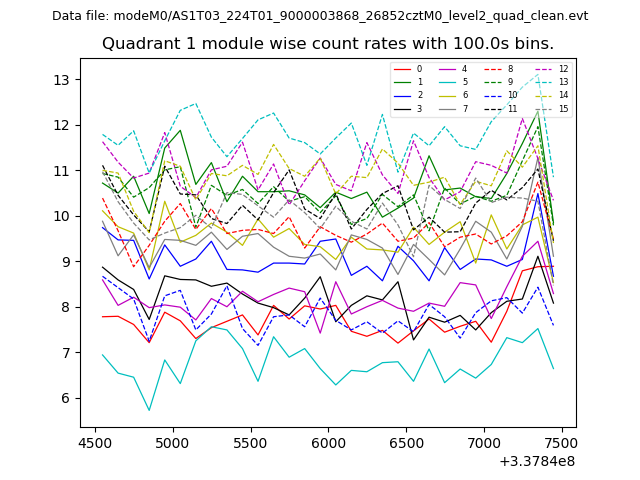 |
 |
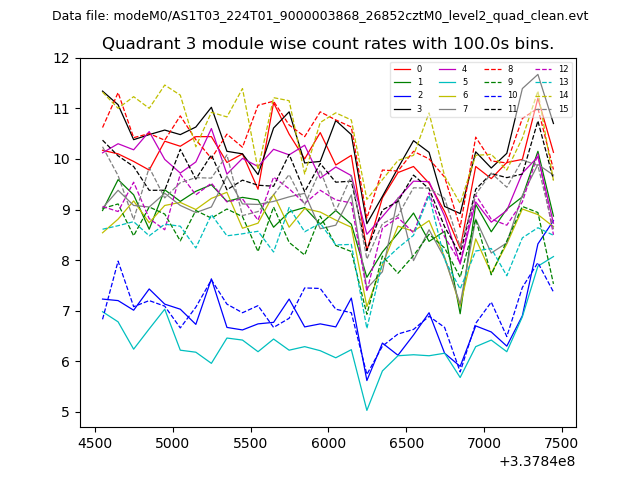
| Module-wise count rates for Quadrant C Data is divided into 100 sec bins |
 |
 |
| Module-wise count rates for Quadrant D Data is divided into 100 sec bins |
 |
 |
| Parameter | Plot |
|---|---|
| CZT HV Monitor | 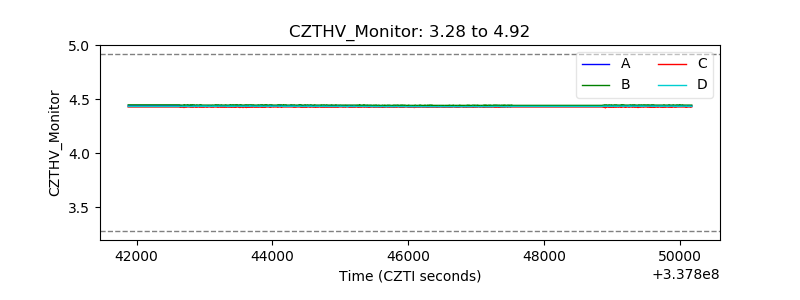 |
| D_VDD | 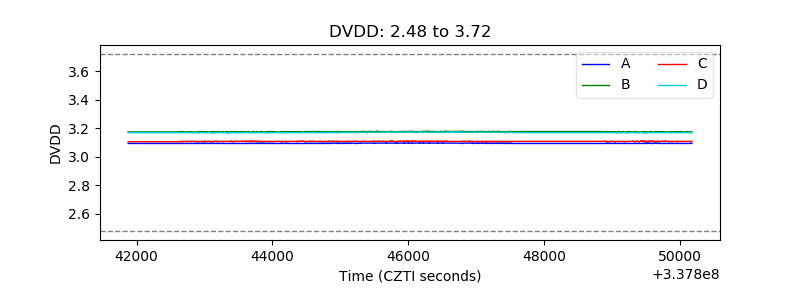 |
| Temperature 1 | 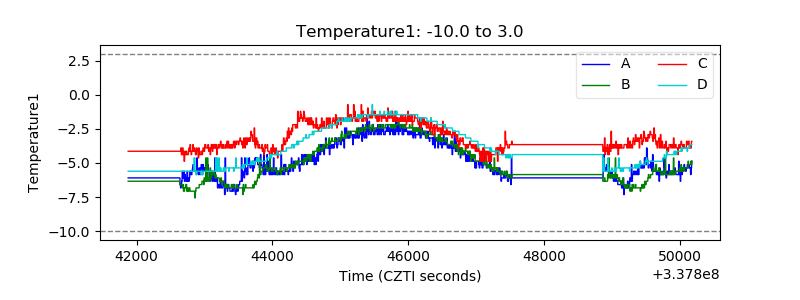 |
| Veto HV Monitor | 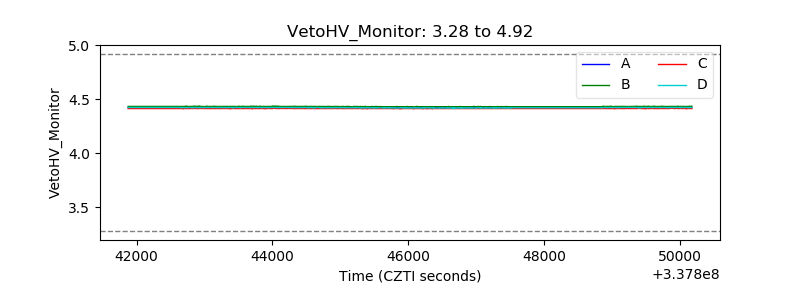 |
| Veto LLD | 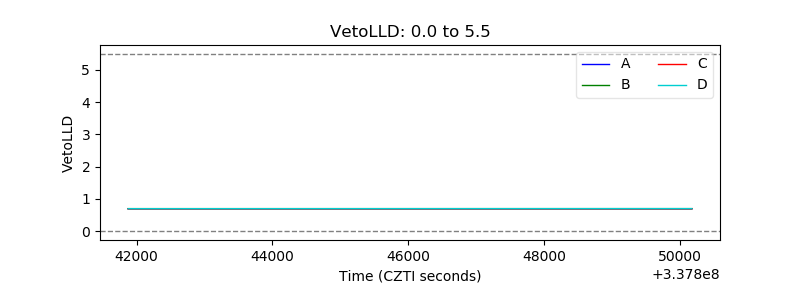 |
| Alpha Counter | 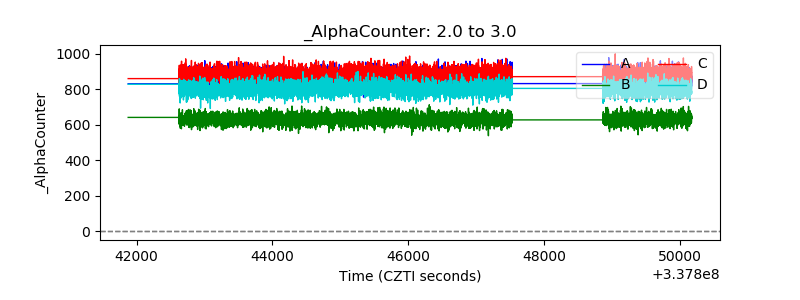 |
| _CPM_Rate | 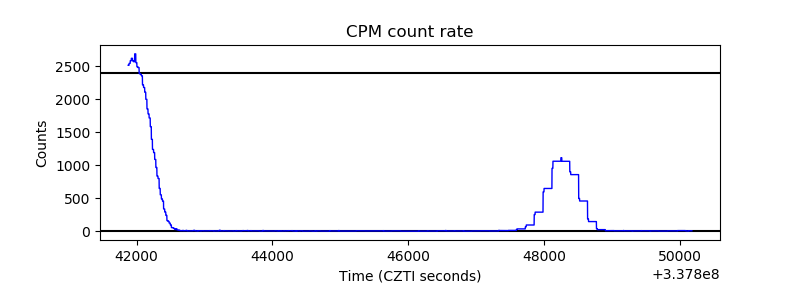 |
| CZT Counter | 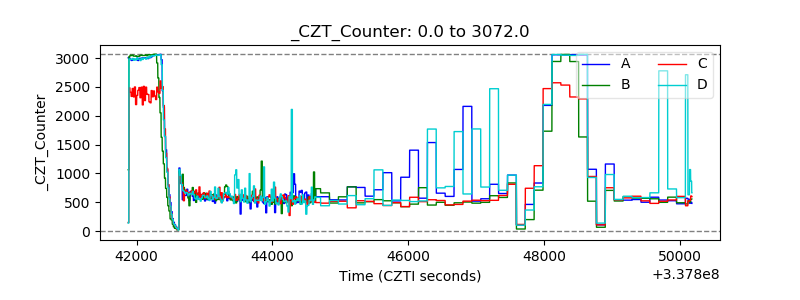 |
| +2.5 Volts monitor |  |
| +5 Volts monitor |  |
| _ROLL_ROT | 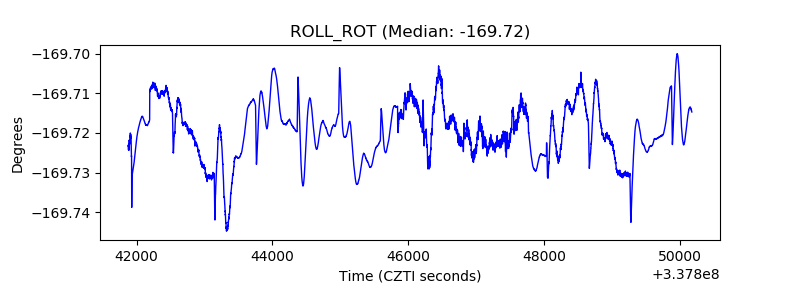 |
| _Roll_DEC | 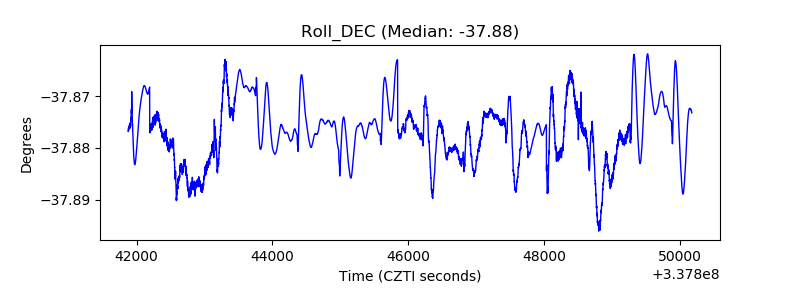 |
| _Roll_RA | 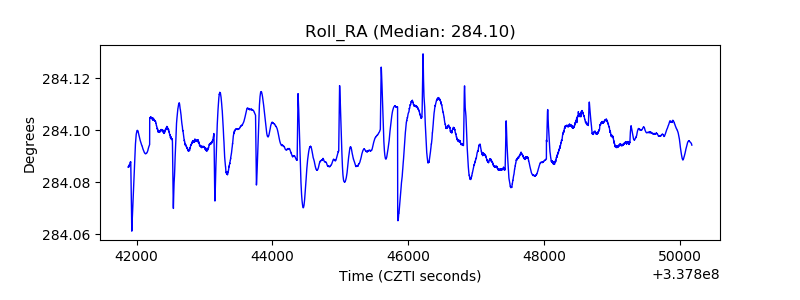 |
| Veto Counter | 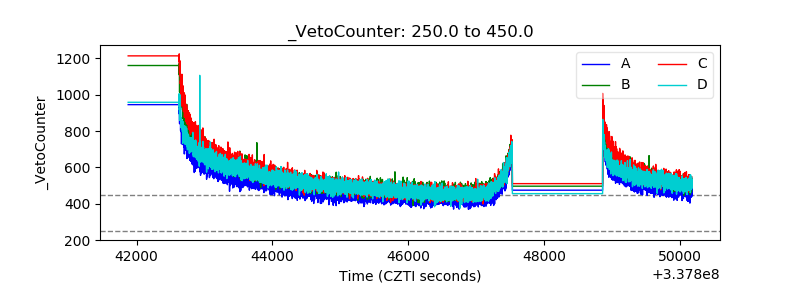 |