| Param | Original file | Final file |
|---|---|---|
| Filename | modeM0/AS1T03_224T01_9000003868_26853cztM0_level2.evt | modeM0/AS1T03_224T01_9000003868_26853cztM0_level2_quad_clean.evt |
| Size (bytes) | 576,368,640 | 88,421,760 |
| Size | 549.7 MB | 84.3 MB |
| Events in quadrant A | 4,929,898 | 549,933 |
| Events in quadrant B | 3,987,394 | 567,614 |
| Events in quadrant C | 3,462,857 | 557,034 |
| Events in quadrant D | 4,624,921 | 539,422 |
| Mode M0 | |||
|---|---|---|---|
| Quadrant | BADHDUFLAG | Total packets | Discarded packets |
| A | 0 | 19013 | 0 |
| B | 0 | 15741 | 0 |
| C | 0 | 14077 | 0 |
| D | 0 | 18002 | 0 |
| Mode M9 | |||
|---|---|---|---|
| Quadrant | BADHDUFLAG | Total packets | Discarded packets |
| A | 0 | 14 | 0 |
| B | 0 | 15 | 0 |
| C | 0 | 15 | 0 |
| D | 0 | 15 | 0 |
| Quadrant | Total seconds | Saturated seconds | Saturation percentage |
|---|---|---|---|
| A | 6645 | 256 | 3.852521% |
| B | 6645 | 253 | 3.807374% |
| C | 6645 | 151 | 2.272385% |
| D | 6645 | 349 | 5.252069% |
Noise dominated data is calculated using 1-second bins in cleaned event files. If a bin has >2000 counts, and if more than 50% of those come from <1% of pixels, then it is considered to be noise-dominated and hence unusable.
| Quadrant | # 1 sec bins | Bins with >0 counts | Bins with >2000 counts | High rate bins dominated by noise | Noise dominated (total time) | Noise dominated (detector-on time) | Marked lightcurve |
|---|---|---|---|---|---|---|---|
| A | 7655 | 6645 | 92 | 92 | 1.20% | 1.38% | 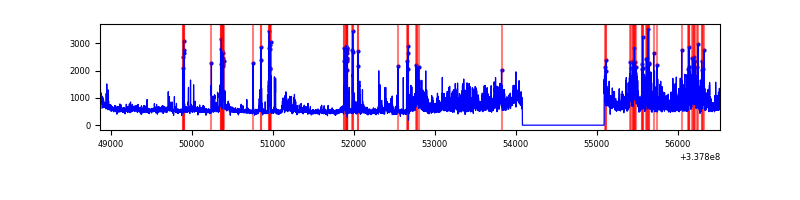 |
| B | 7655 | 6645 | 84 | 84 | 1.10% | 1.26% | 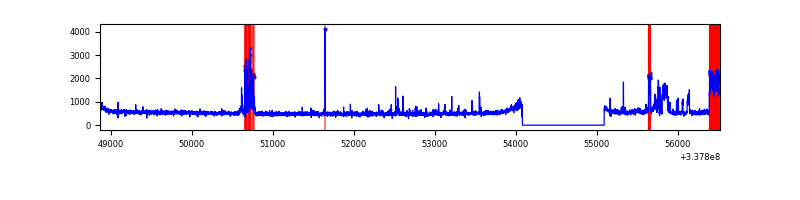 |
| C | 7655 | 6645 | 0 | 0 | 0.00% | 0.00% | 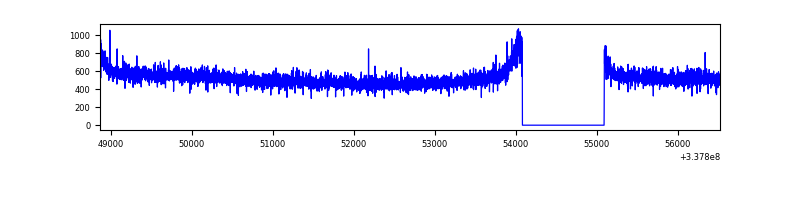 |
| D | 7655 | 6645 | 251 | 251 | 3.28% | 3.78% | 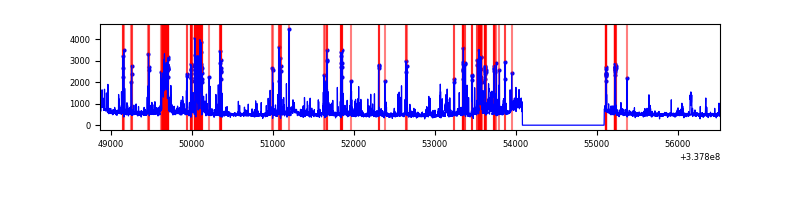 |
Top three noisy pixels from each quadrant. If the there are fewer than three noisy pixels in the level2.evt file, extra rows are filled as -1
| Pixel properties | Quadrant properties | ||||||
|---|---|---|---|---|---|---|---|
| Quadrant | DetID | PixID | Counts | Sigma | Mean | Median | Sigma |
| A | 0 | 13 | 1524100 | 8722.03 | 871 | 855 | 174.6 |
| A | 12 | 96 | 48801 | 274.54 | 871 | 855 | 174.6 |
| A | 13 | 254 | 9690 | 50.59 | 871 | 855 | 174.6 |
| B | 0 | 189 | 356389 | 2149.92 | 871 | 848 | 165.4 |
| B | 10 | 246 | 131774 | 791.7 | 871 | 848 | 165.4 |
| B | 15 | 33 | 49443 | 293.85 | 871 | 848 | 165.4 |
| C | 14 | 238 | 138394 | 692.12 | 853 | 859 | 198.7 |
| C | 13 | 61 | 5767 | 24.7 | 853 | 859 | 198.7 |
| C | 3 | 202 | 1979 | 5.64 | 853 | 859 | 198.7 |
| D | 1 | 52 | 879033 | 4496.4 | 837 | 821 | 195.3 |
| D | 7 | 80 | 292062 | 1491.14 | 837 | 821 | 195.3 |
| D | 11 | 176 | 160024 | 815.11 | 837 | 821 | 195.3 |
Histogram calculated using DETX and DETY for each event in the final _common_clean file
| Quadrant A |  |
 |
Quadrant B |
|---|---|---|---|
| Quadrant D | 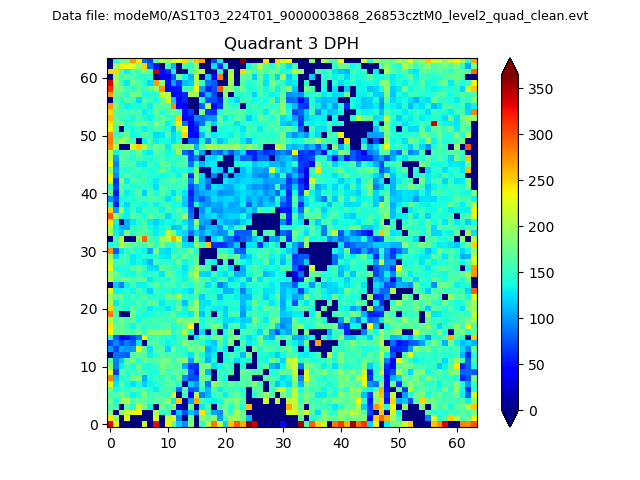 |
 |
Quadrant C |
| Plot type | Count rate plots | Images |
|---|---|---|
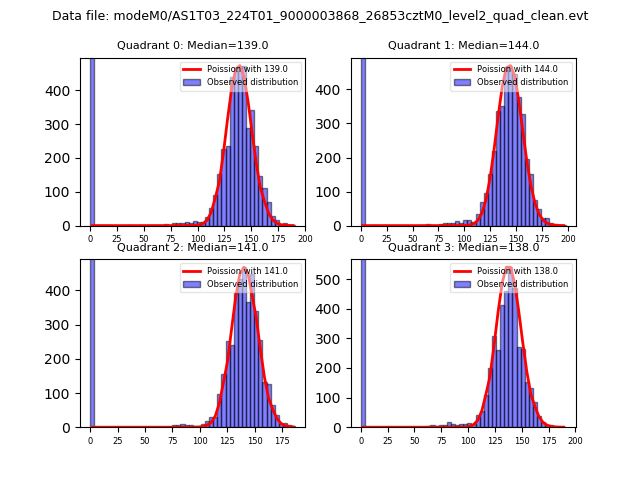
| Comparison with Poisson distribution Blue bars denote a histogram of data divided into 1 sec bins. Red curve is a Poisson curve with rate = median count rate of data. |
 |
 |
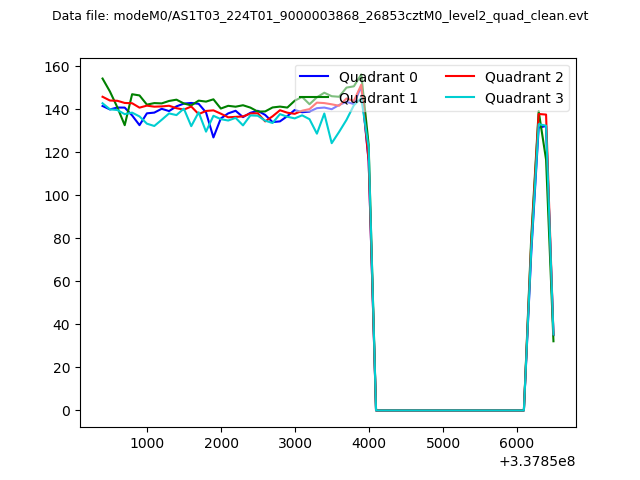
| Quadrant-wise count rates Data is divided into 100 sec bins |
 |
|
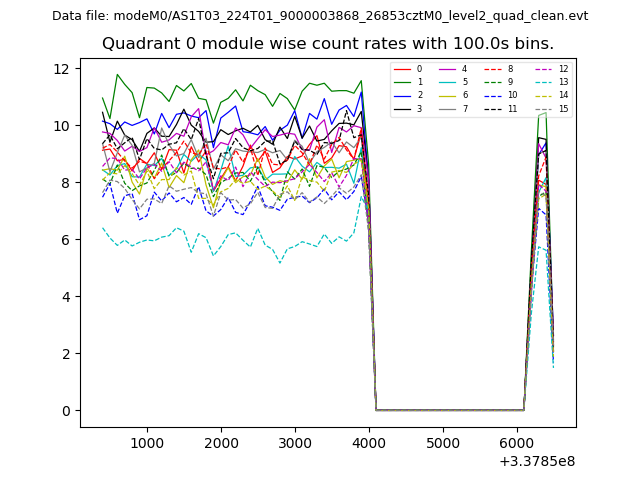
| Module-wise count rates for Quadrant A Data is divided into 100 sec bins |
 |
 |
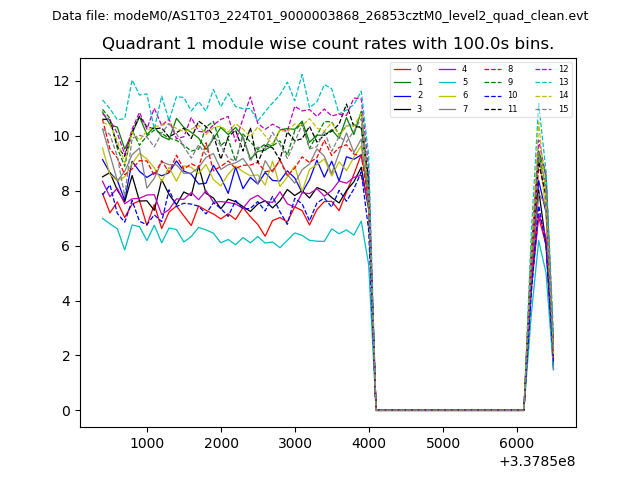
| Module-wise count rates for Quadrant B Data is divided into 100 sec bins |
 |
 |
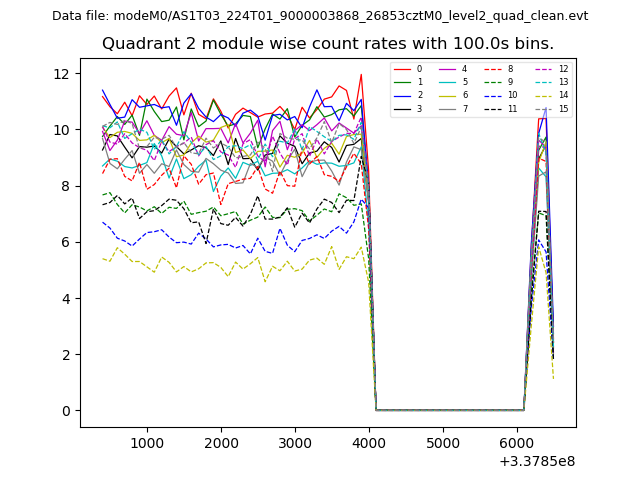
| Module-wise count rates for Quadrant C Data is divided into 100 sec bins |
 |
 |
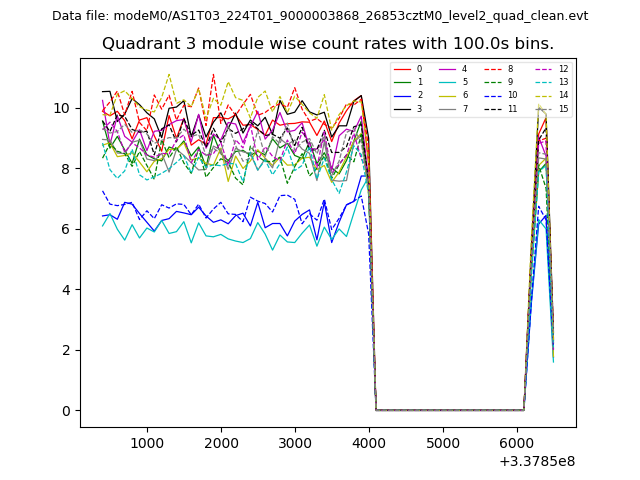
| Module-wise count rates for Quadrant D Data is divided into 100 sec bins |
 |
 |
| Parameter | Plot |
|---|---|
| CZT HV Monitor | 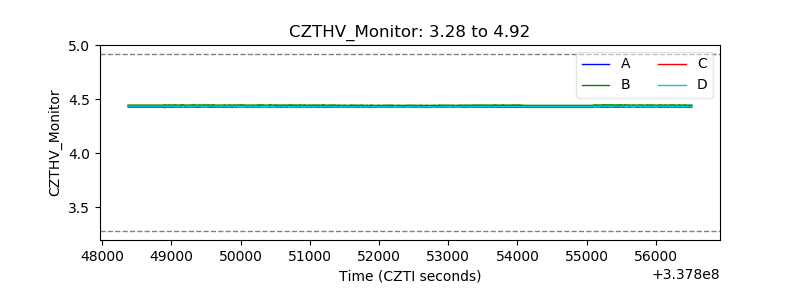 |
| D_VDD | 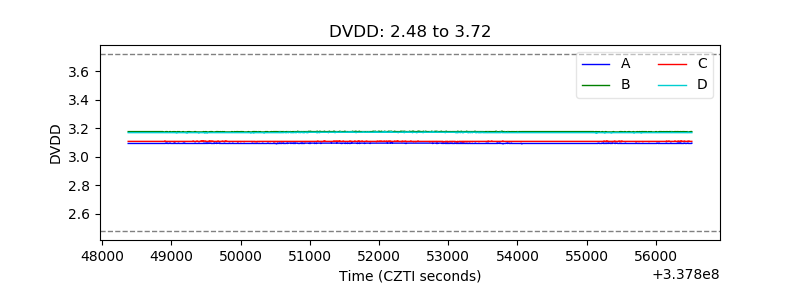 |
| Temperature 1 | 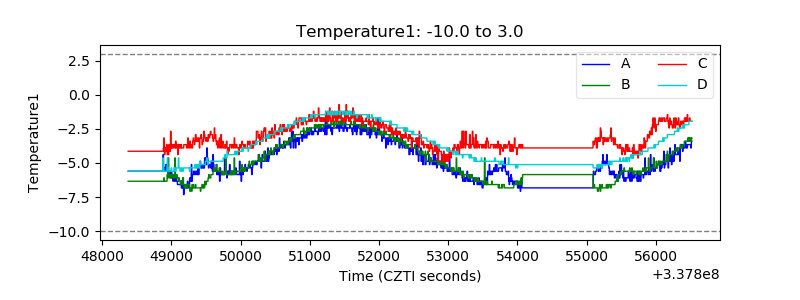 |
| Veto HV Monitor | 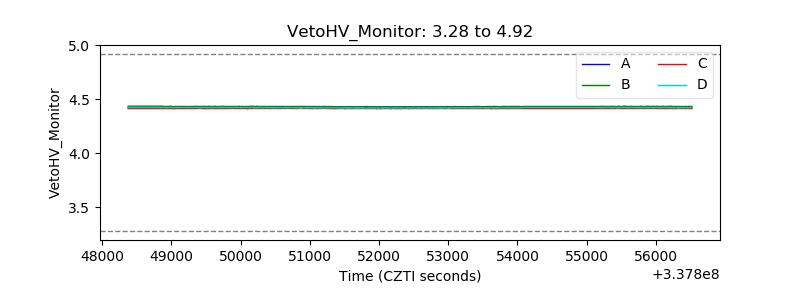 |
| Veto LLD | 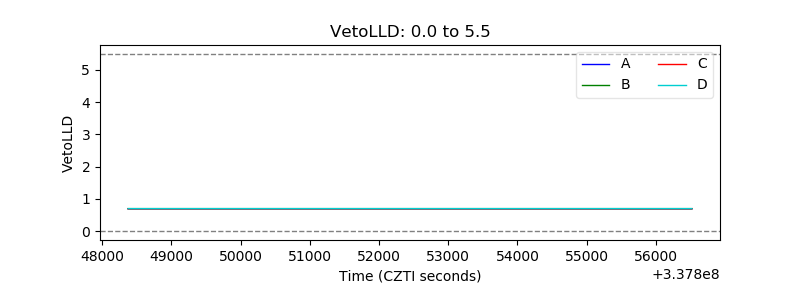 |
| Alpha Counter | 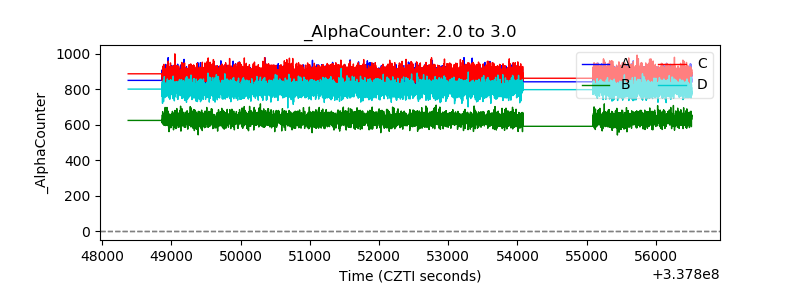 |
| _CPM_Rate | 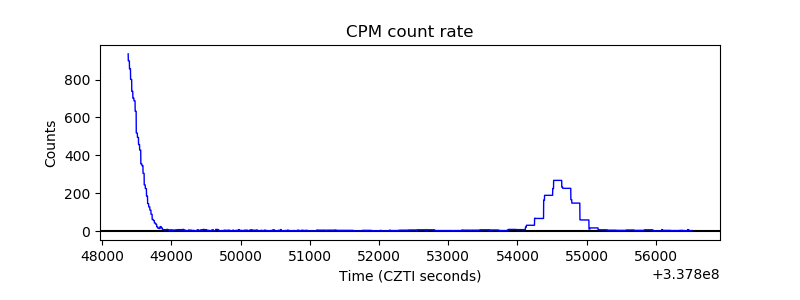 |
| CZT Counter | 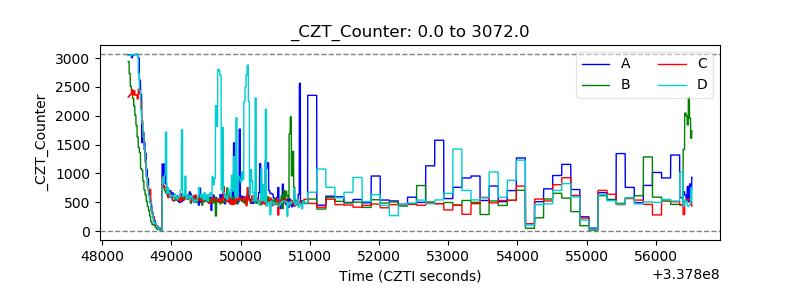 |
| +2.5 Volts monitor |  |
| +5 Volts monitor | 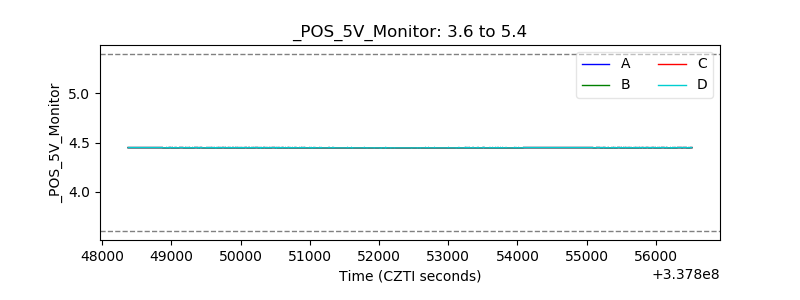 |
| _ROLL_ROT | 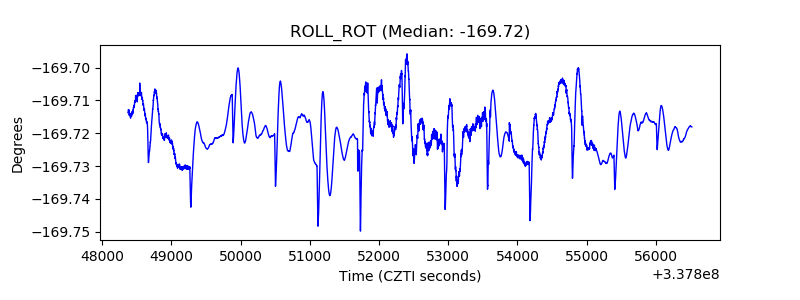 |
| _Roll_DEC | 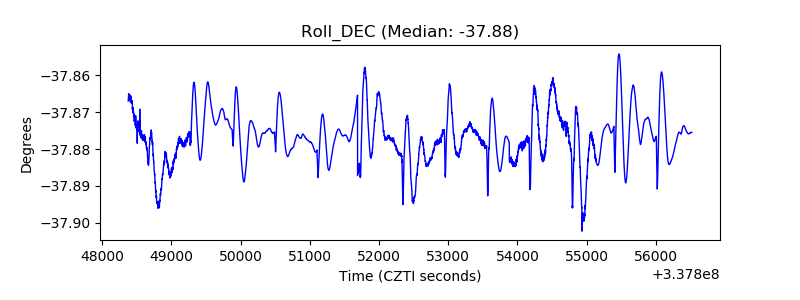 |
| _Roll_RA | 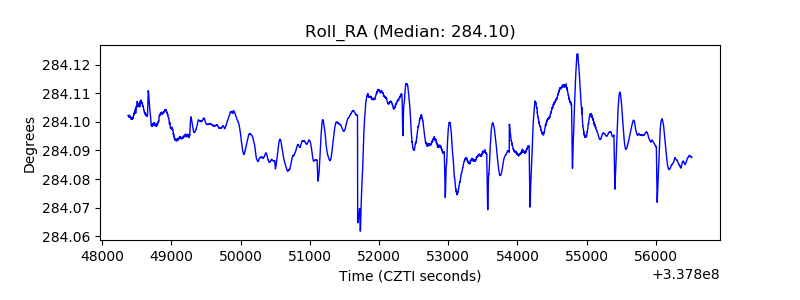 |
| Veto Counter | 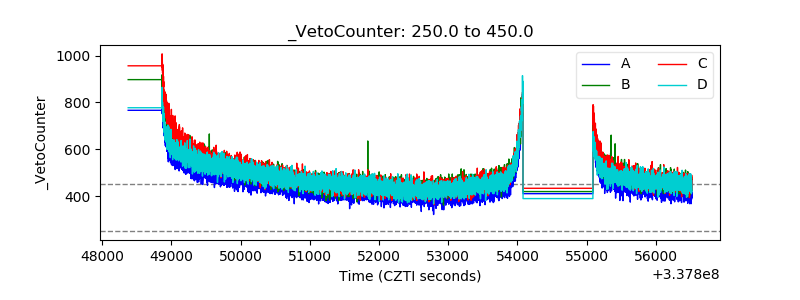 |