| Param | Original file | Final file |
|---|---|---|
| Filename | modeM0/AS1T03_224T01_9000003868_26854cztM0_level2.evt | modeM0/AS1T03_224T01_9000003868_26854cztM0_level2_quad_clean.evt |
| Size (bytes) | 677,891,520 | 91,834,560 |
| Size | 646.5 MB | 87.6 MB |
| Events in quadrant A | 5,970,177 | 569,241 |
| Events in quadrant B | 5,664,202 | 581,384 |
| Events in quadrant C | 3,491,733 | 581,793 |
| Events in quadrant D | 4,927,497 | 557,514 |
| Mode M0 | |||
|---|---|---|---|
| Quadrant | BADHDUFLAG | Total packets | Discarded packets |
| A | 0 | 22640 | 0 |
| B | 0 | 21482 | 0 |
| C | 0 | 14566 | 0 |
| D | 0 | 19189 | 0 |
| Mode M9 | |||
|---|---|---|---|
| Quadrant | BADHDUFLAG | Total packets | Discarded packets |
| A | 0 | 5 | 0 |
| B | 0 | 5 | 0 |
| C | 0 | 5 | 0 |
| D | 0 | 5 | 0 |
| Quadrant | Total seconds | Saturated seconds | Saturation percentage |
|---|---|---|---|
| A | 7046 | 410 | 5.818904% |
| B | 7047 | 512 | 7.265503% |
| C | 7047 | 206 | 2.923230% |
| D | 7047 | 293 | 4.157798% |
Noise dominated data is calculated using 1-second bins in cleaned event files. If a bin has >2000 counts, and if more than 50% of those come from <1% of pixels, then it is considered to be noise-dominated and hence unusable.
| Quadrant | # 1 sec bins | Bins with >0 counts | Bins with >2000 counts | High rate bins dominated by noise | Noise dominated (total time) | Noise dominated (detector-on time) | Marked lightcurve |
|---|---|---|---|---|---|---|---|
| A | 7546 | 7046 | 141 | 141 | 1.87% | 2.00% | 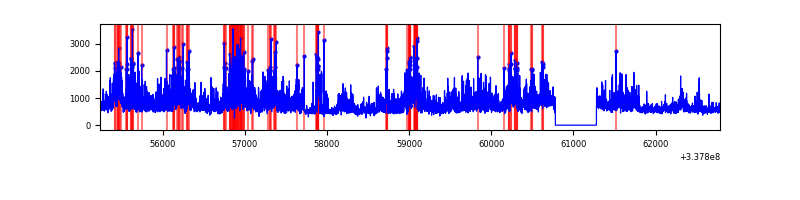 |
| B | 7547 | 7047 | 193 | 193 | 2.56% | 2.74% | 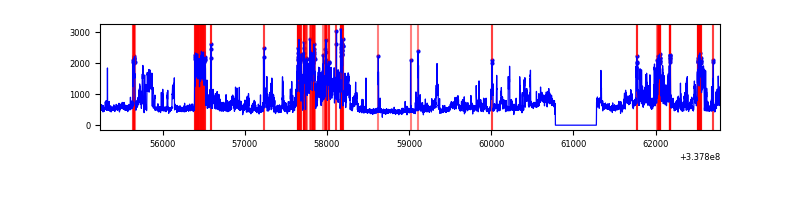 |
| C | 7547 | 7047 | 0 | 0 | 0.00% | 0.00% | 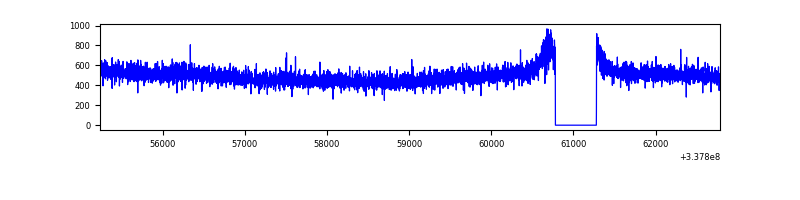 |
| D | 7547 | 7047 | 152 | 152 | 2.01% | 2.16% | 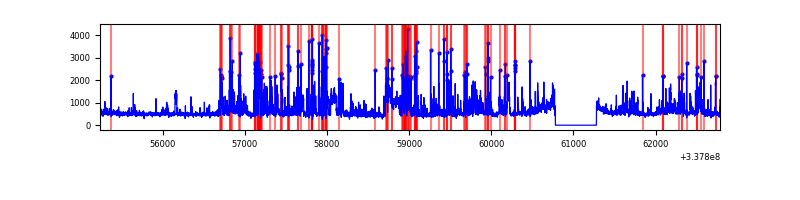 |
Top three noisy pixels from each quadrant. If the there are fewer than three noisy pixels in the level2.evt file, extra rows are filled as -1
| Pixel properties | Quadrant properties | ||||||
|---|---|---|---|---|---|---|---|
| Quadrant | DetID | PixID | Counts | Sigma | Mean | Median | Sigma |
| A | 0 | 13 | 2573863 | 14407.13 | 881 | 863 | 178.6 |
| A | 13 | 254 | 10746 | 55.34 | 881 | 863 | 178.6 |
| A | 3 | 137 | 8365 | 42.01 | 881 | 863 | 178.6 |
| B | 0 | 189 | 2090890 | 12394.49 | 878 | 855 | 168.6 |
| B | 10 | 246 | 100687 | 592.03 | 878 | 855 | 168.6 |
| B | 12 | 111 | 20565 | 116.89 | 878 | 855 | 168.6 |
| C | 14 | 238 | 137343 | 674.96 | 861 | 865 | 202.2 |
| C | 13 | 61 | 5942 | 25.11 | 861 | 865 | 202.2 |
| C | 9 | 209 | 1936 | 5.3 | 861 | 865 | 202.2 |
| D | 1 | 52 | 1183109 | 5893.99 | 858 | 839 | 200.6 |
| D | 11 | 176 | 215314 | 1069.23 | 858 | 839 | 200.6 |
| D | 7 | 80 | 185793 | 922.05 | 858 | 839 | 200.6 |
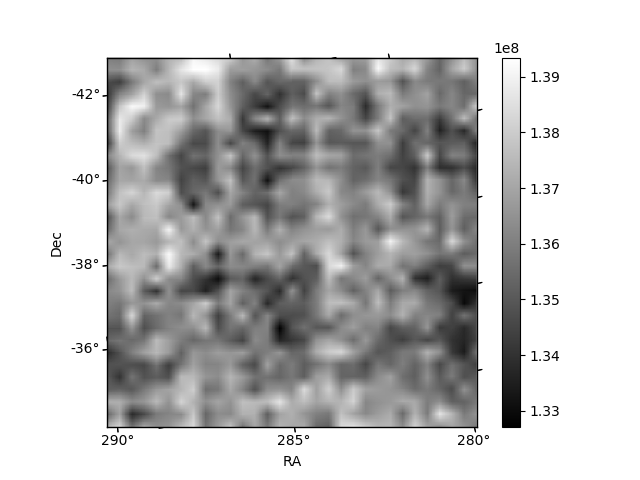
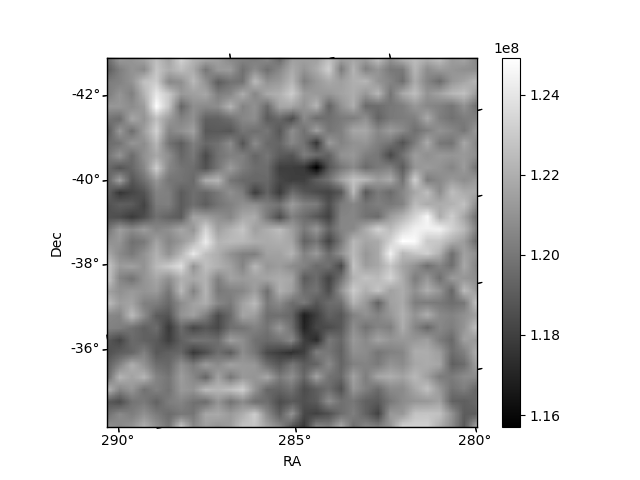
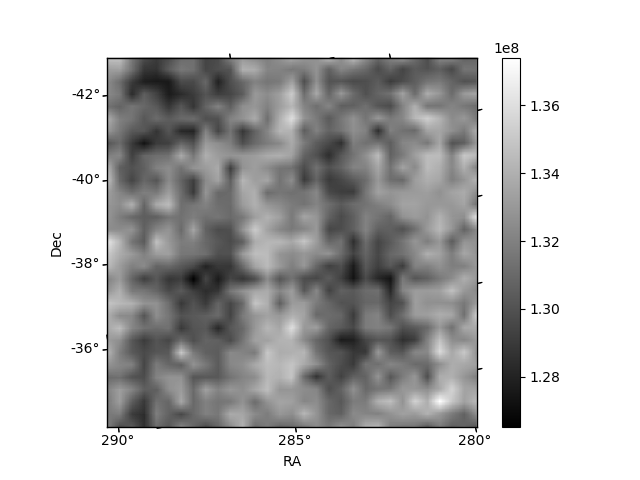
Histogram calculated using DETX and DETY for each event in the final _common_clean file
| Quadrant A |  |
 |
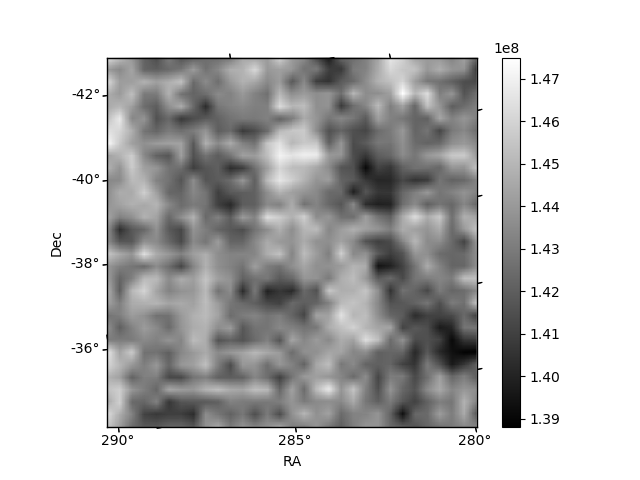
Quadrant B |
|---|---|---|---|
| Quadrant D |  |
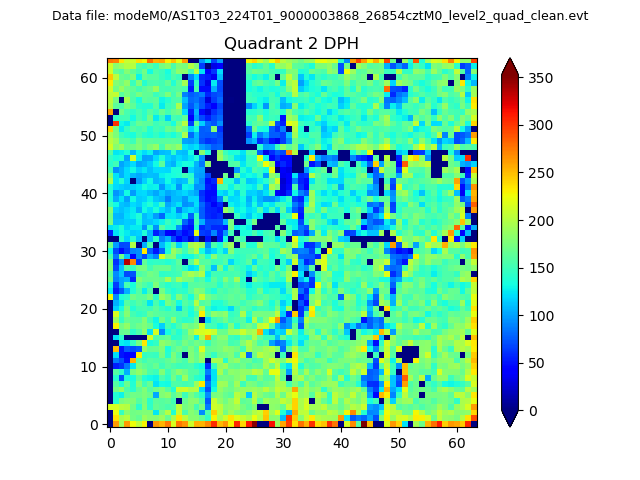 |
Quadrant C |
| Plot type | Count rate plots | Images |
|---|---|---|
| Comparison with Poisson distribution Blue bars denote a histogram of data divided into 1 sec bins. Red curve is a Poisson curve with rate = median count rate of data. |
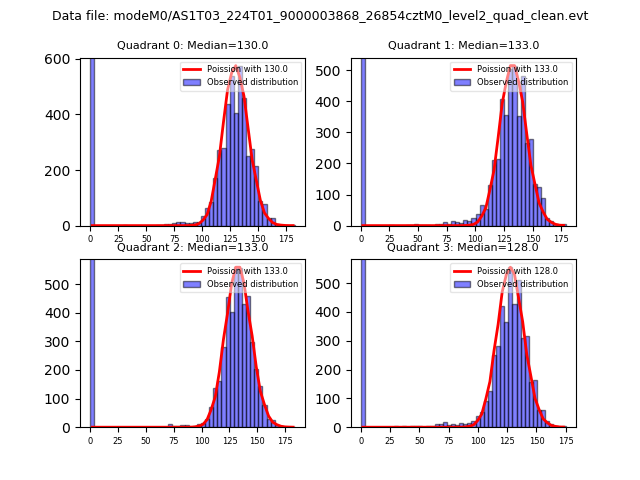 |
 |
| Quadrant-wise count rates Data is divided into 100 sec bins |
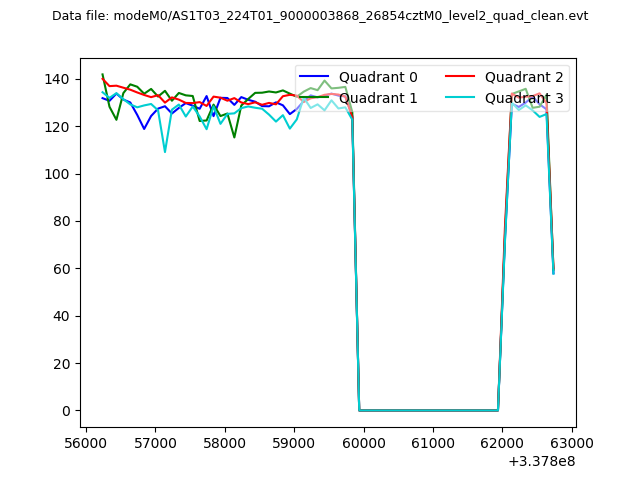 |
|
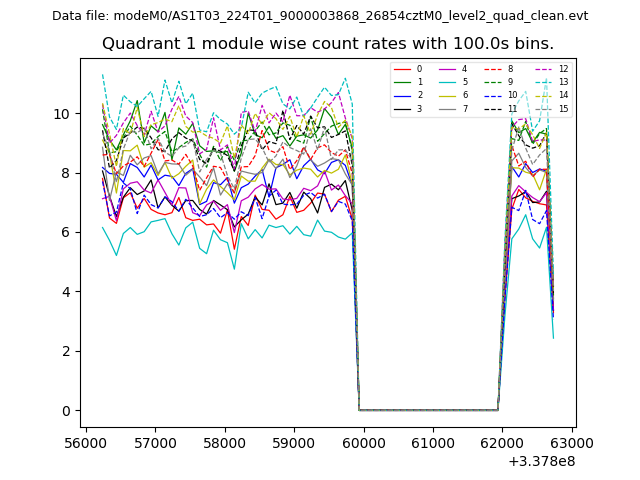
| Module-wise count rates for Quadrant A Data is divided into 100 sec bins |
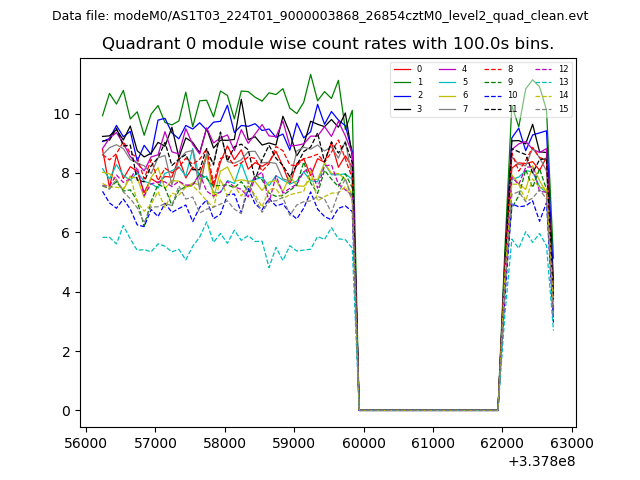 |
 |
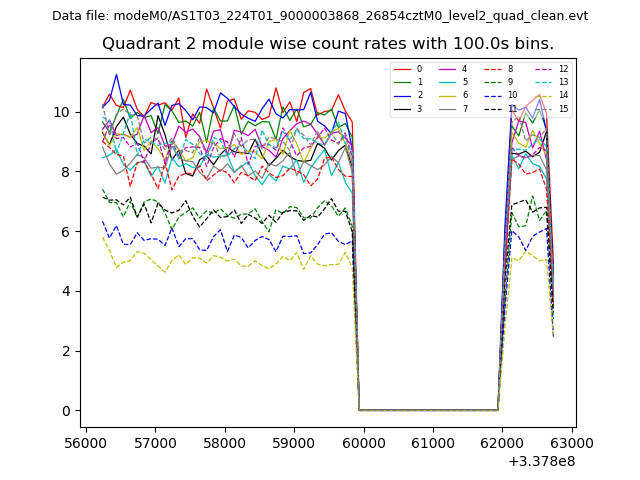
| Module-wise count rates for Quadrant B Data is divided into 100 sec bins |
 |
 |
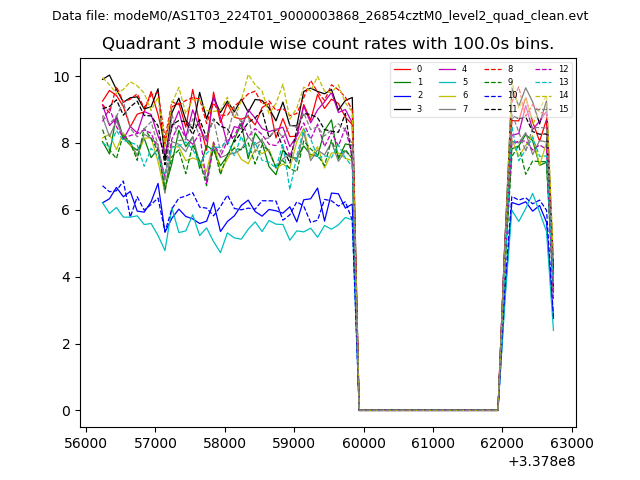
| Module-wise count rates for Quadrant C Data is divided into 100 sec bins |
 |
 |
| Module-wise count rates for Quadrant D Data is divided into 100 sec bins |
 |
 |
| Parameter | Plot |
|---|---|
| CZT HV Monitor | 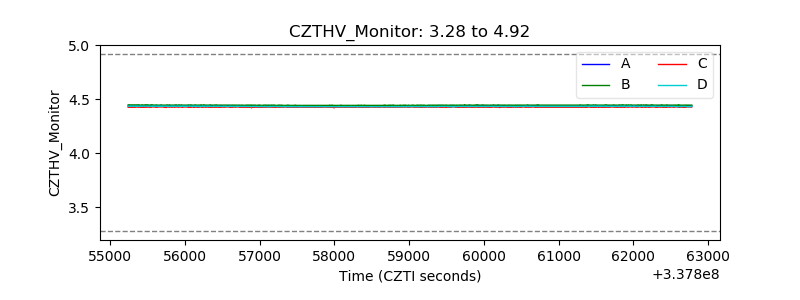 |
| D_VDD | 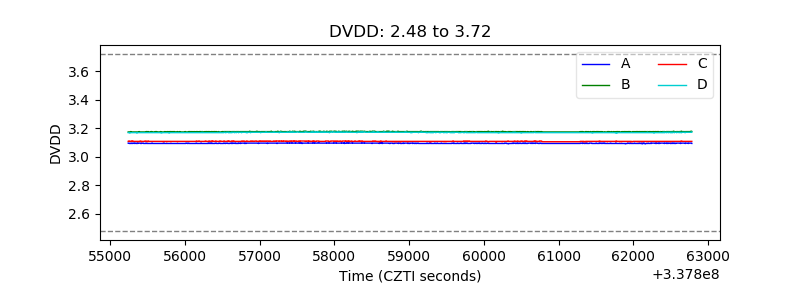 |
| Temperature 1 | 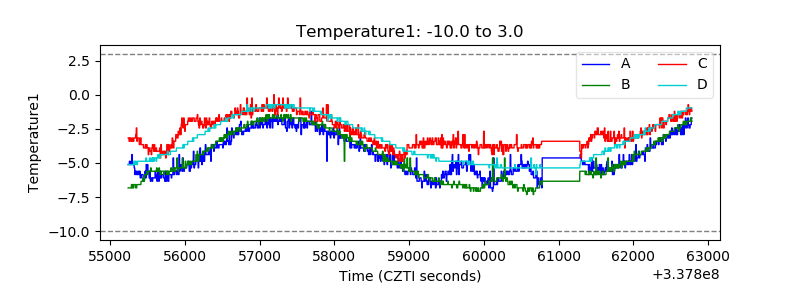 |
| Veto HV Monitor | 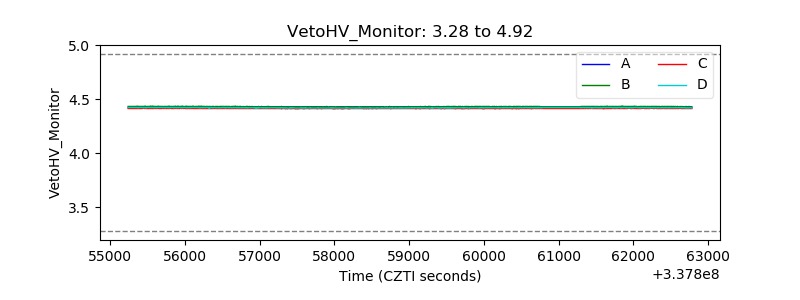 |
| Veto LLD |  |
| Alpha Counter | 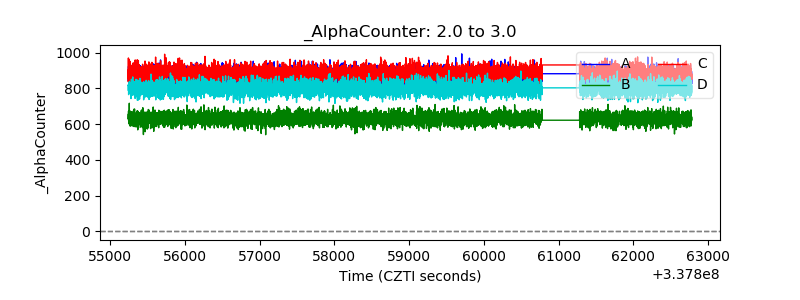 |
| _CPM_Rate | 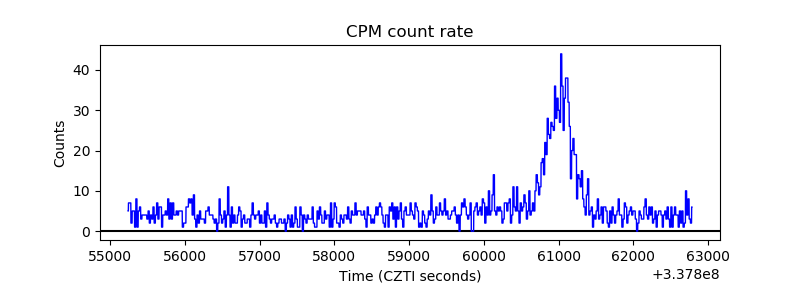 |
| CZT Counter |  |
| +2.5 Volts monitor |  |
| +5 Volts monitor | 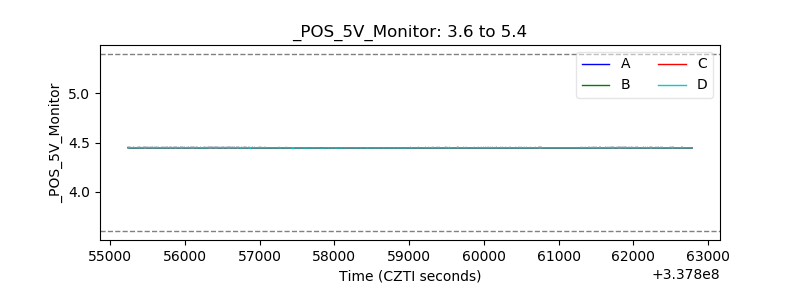 |
| _ROLL_ROT | 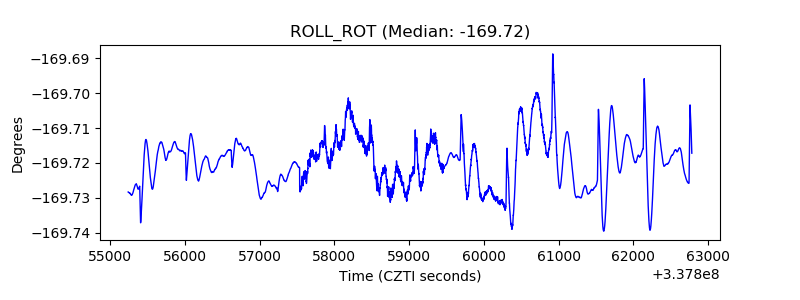 |
| _Roll_DEC | 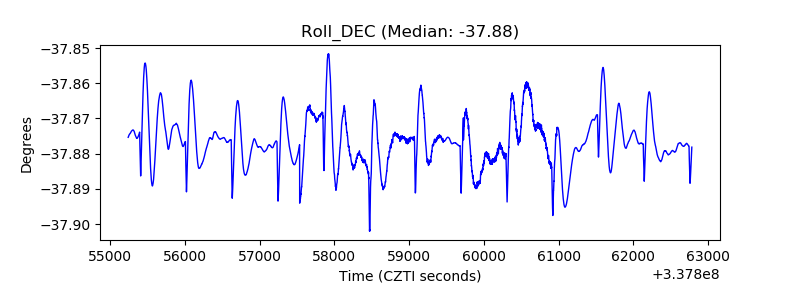 |
| _Roll_RA |  |
| Veto Counter | 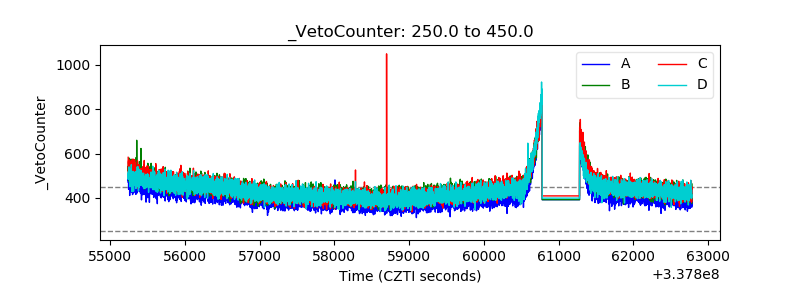 |