| Param | Original file | Final file |
|---|---|---|
| Filename | modeM0/AS1T03_224T01_9000003868_26856cztM0_level2.evt | modeM0/AS1T03_224T01_9000003868_26856cztM0_level2_quad_clean.evt |
| Size (bytes) | 737,760,960 | 96,762,240 |
| Size | 703.6 MB | 92.3 MB |
| Events in quadrant A | 4,678,484 | 646,463 |
| Events in quadrant B | 7,825,909 | 558,018 |
| Events in quadrant C | 3,421,723 | 643,067 |
| Events in quadrant D | 5,936,898 | 587,383 |
| Mode M0 | |||
|---|---|---|---|
| Quadrant | BADHDUFLAG | Total packets | Discarded packets |
| A | 0 | 18617 | 0 |
| B | 0 | 28040 | 0 |
| C | 0 | 14657 | 0 |
| D | 0 | 22526 | 0 |
| Mode M9 | |||
|---|---|---|---|
| Quadrant | BADHDUFLAG | Total packets | Discarded packets |
| A | 0 | 2 | 0 |
| B | 0 | 2 | 0 |
| C | 0 | 2 | 0 |
| D | 0 | 2 | 0 |
| Quadrant | Total seconds | Saturated seconds | Saturation percentage |
|---|---|---|---|
| A | 7099 | 216 | 3.042682% |
| B | 7098 | 2021 | 28.472809% |
| C | 7098 | 118 | 1.662440% |
| D | 7099 | 696 | 9.804198% |
Noise dominated data is calculated using 1-second bins in cleaned event files. If a bin has >2000 counts, and if more than 50% of those come from <1% of pixels, then it is considered to be noise-dominated and hence unusable.
| Quadrant | # 1 sec bins | Bins with >0 counts | Bins with >2000 counts | High rate bins dominated by noise | Noise dominated (total time) | Noise dominated (detector-on time) | Marked lightcurve |
|---|---|---|---|---|---|---|---|
| A | 7304 | 7101 | 76 | 76 | 1.04% | 1.07% | 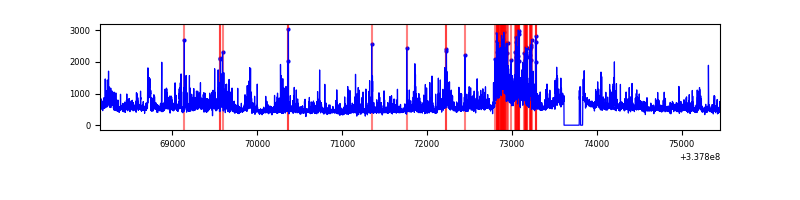 |
| B | 7303 | 7100 | 1558 | 1558 | 21.33% | 21.94% | 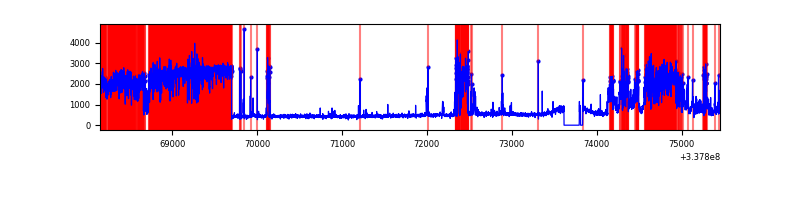 |
| C | 7303 | 7100 | 0 | 0 | 0.00% | 0.00% | 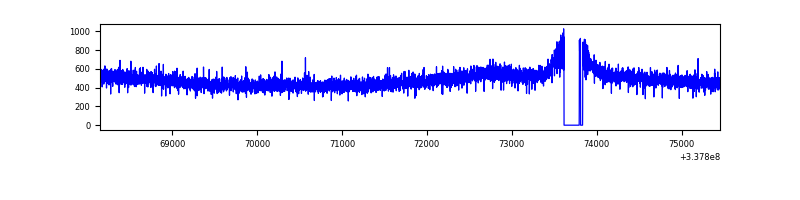 |
| D | 7303 | 7100 | 564 | 564 | 7.72% | 7.94% | 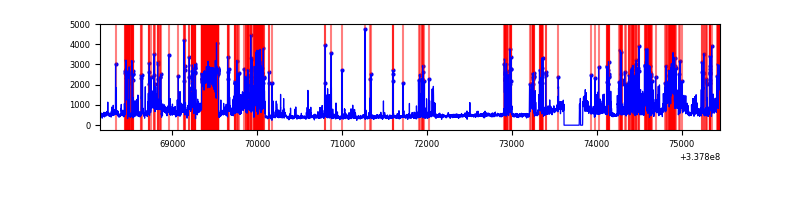 |
Top three noisy pixels from each quadrant. If the there are fewer than three noisy pixels in the level2.evt file, extra rows are filled as -1
| Pixel properties | Quadrant properties | ||||||
|---|---|---|---|---|---|---|---|
| Quadrant | DetID | PixID | Counts | Sigma | Mean | Median | Sigma |
| A | 0 | 13 | 1308881 | 7399.63 | 872 | 853 | 176.8 |
| A | 13 | 254 | 12076 | 63.49 | 872 | 853 | 176.8 |
| A | 3 | 137 | 8319 | 42.23 | 872 | 853 | 176.8 |
| B | 0 | 189 | 4258458 | 27941.97 | 787 | 766 | 152.4 |
| B | 10 | 246 | 385395 | 2524.21 | 787 | 766 | 152.4 |
| B | 0 | 190 | 82477 | 536.25 | 787 | 766 | 152.4 |
| C | 14 | 238 | 132519 | 664.17 | 839 | 843 | 198.3 |
| C | 8 | 128 | 11141 | 51.94 | 839 | 843 | 198.3 |
| C | 8 | 112 | 6051 | 26.27 | 839 | 843 | 198.3 |
| D | 7 | 80 | 2083396 | 10810.62 | 813 | 792 | 192.6 |
| D | 1 | 52 | 539714 | 2797.5 | 813 | 792 | 192.6 |
| D | 2 | 250 | 142991 | 738.14 | 813 | 792 | 192.6 |
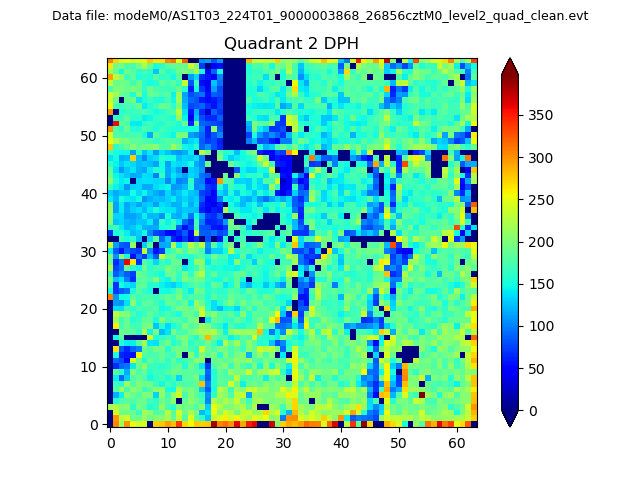
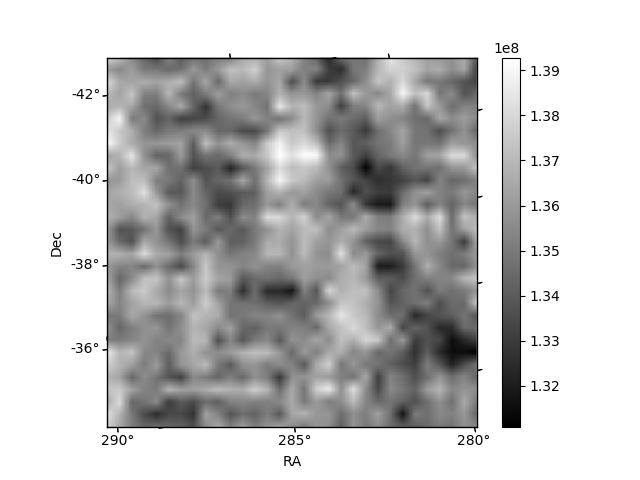
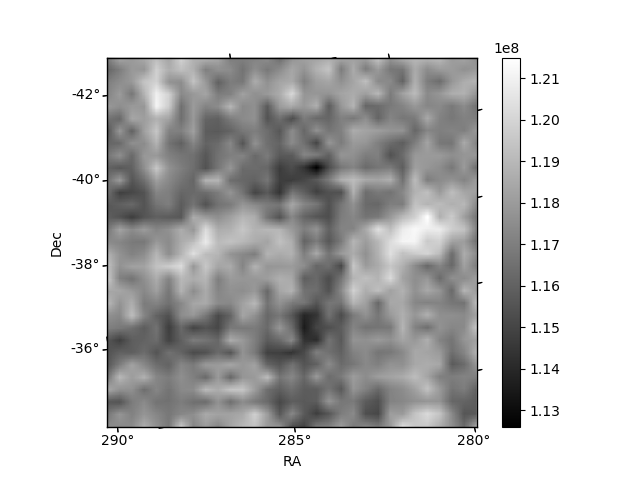
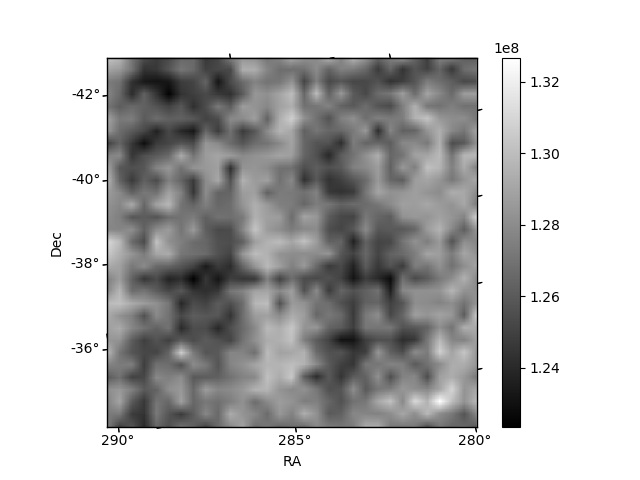
Histogram calculated using DETX and DETY for each event in the final _common_clean file
| Quadrant A | 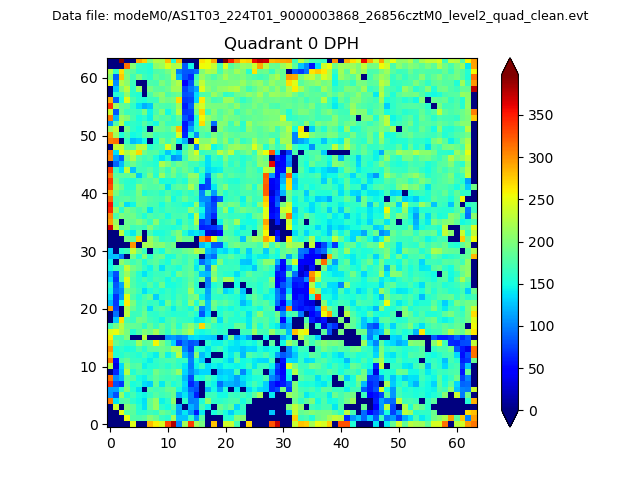 |
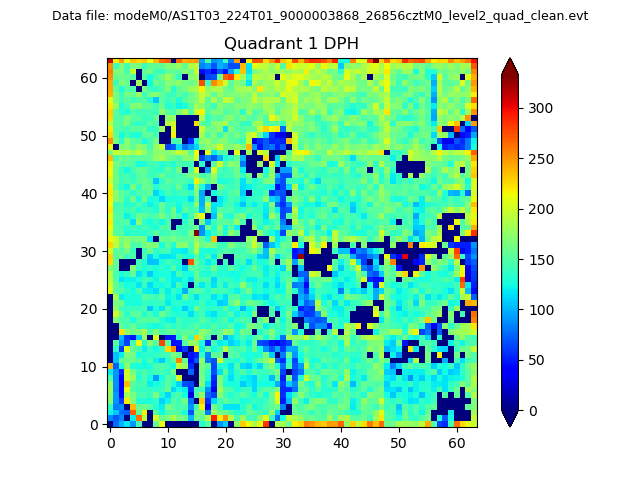 |
Quadrant B |
|---|---|---|---|
| Quadrant D | 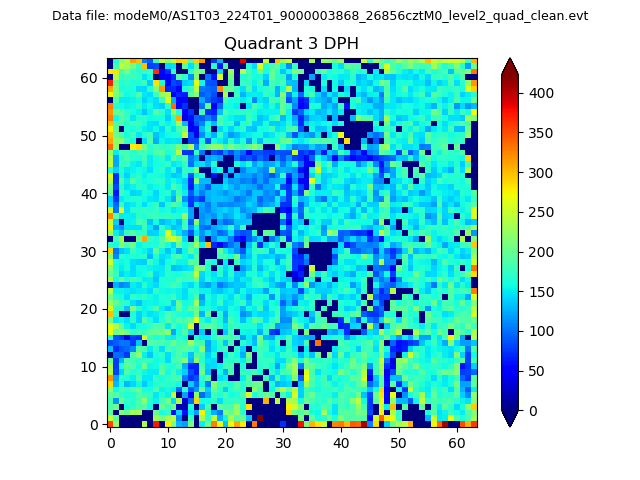 |
 |
Quadrant C |
| Plot type | Count rate plots | Images |
|---|---|---|
| Comparison with Poisson distribution Blue bars denote a histogram of data divided into 1 sec bins. Red curve is a Poisson curve with rate = median count rate of data. |
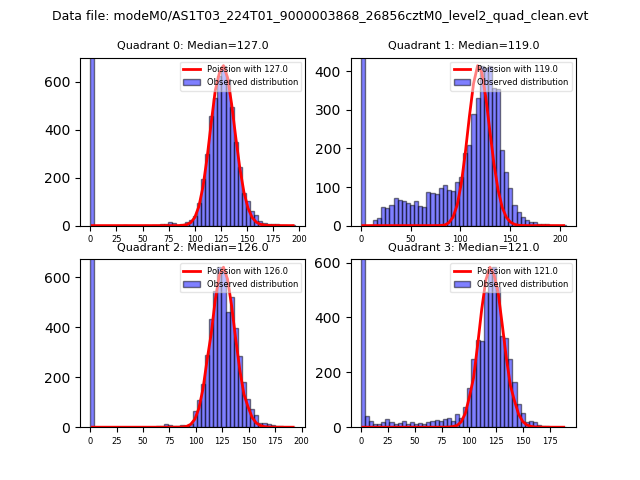 |
 |
| Quadrant-wise count rates Data is divided into 100 sec bins |
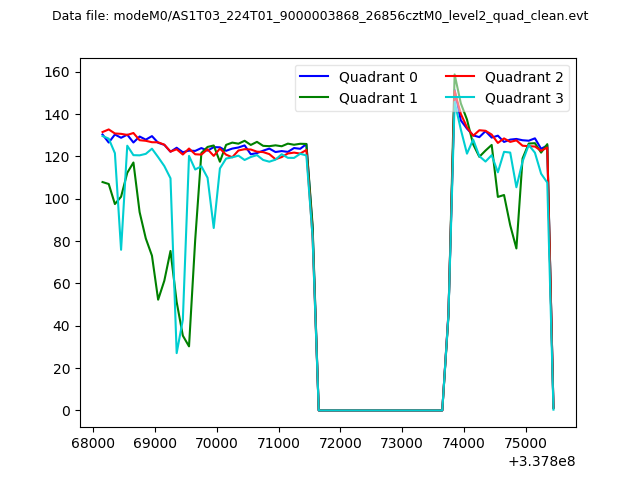 |
|
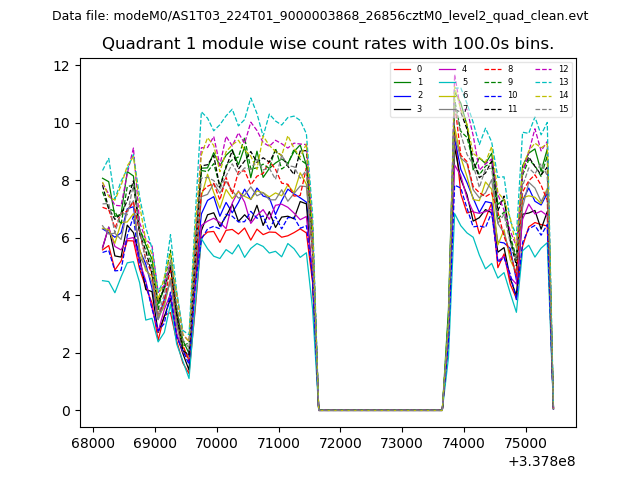
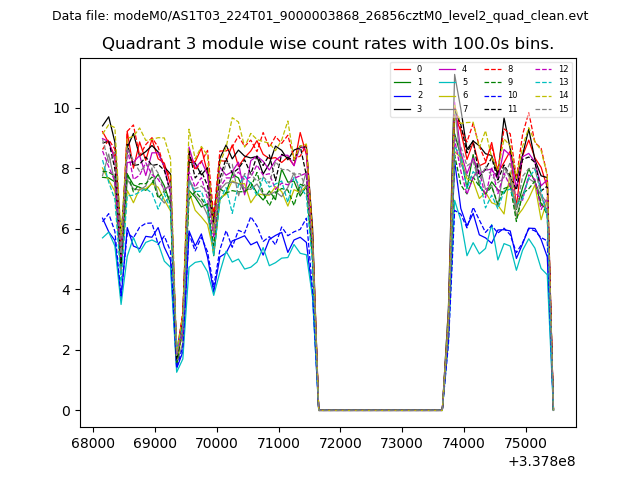
| Module-wise count rates for Quadrant A Data is divided into 100 sec bins |
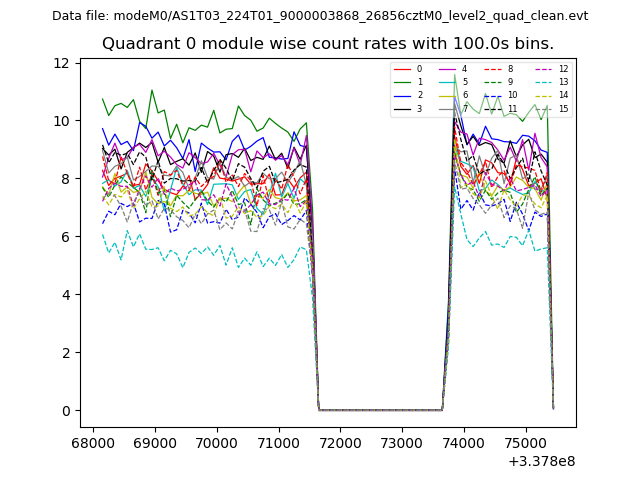 |
 |
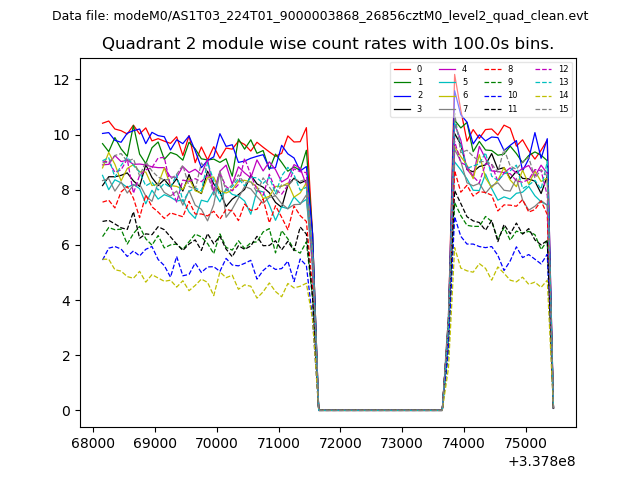
| Module-wise count rates for Quadrant B Data is divided into 100 sec bins |
 |
 |
| Module-wise count rates for Quadrant C Data is divided into 100 sec bins |
 |
 |
| Module-wise count rates for Quadrant D Data is divided into 100 sec bins |
 |
 |
| Parameter | Plot |
|---|---|
| CZT HV Monitor | 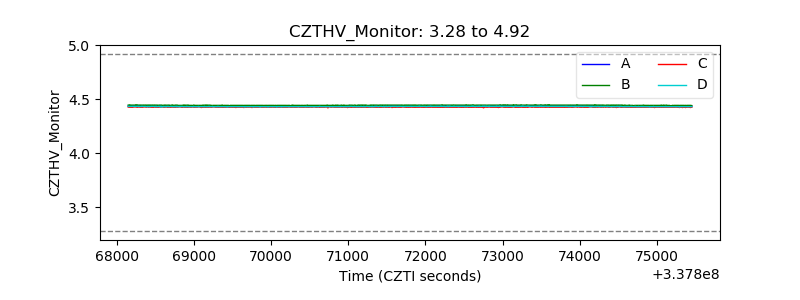 |
| D_VDD | 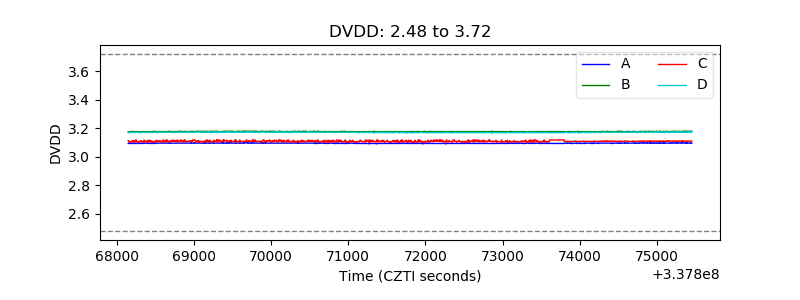 |
| Temperature 1 | 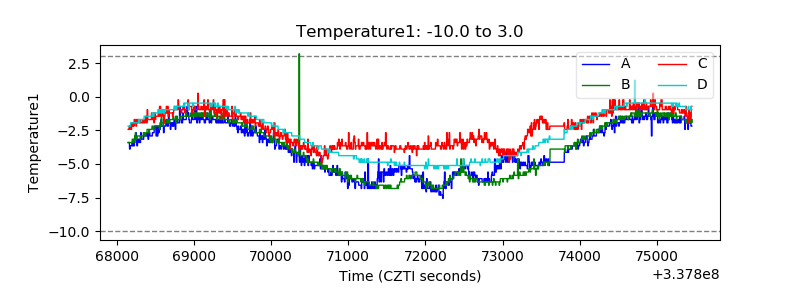 |
| Veto HV Monitor | 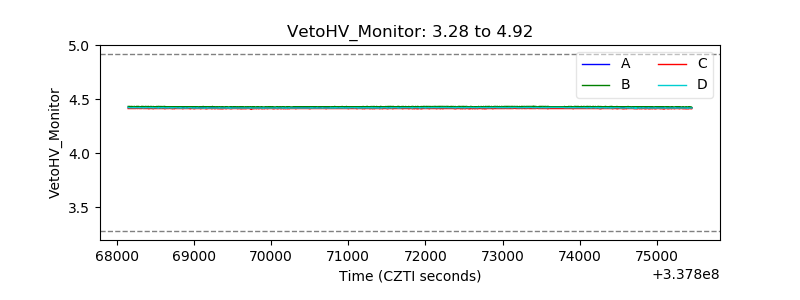 |
| Veto LLD | 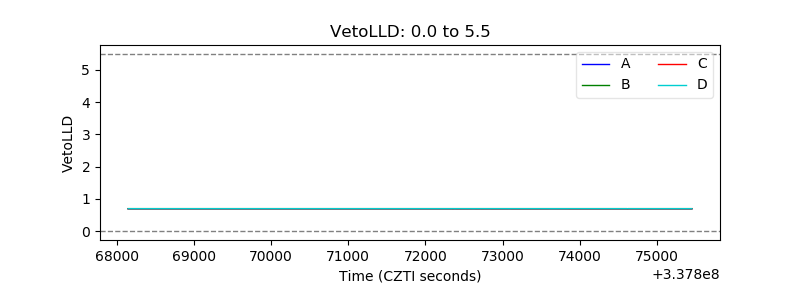 |
| Alpha Counter | 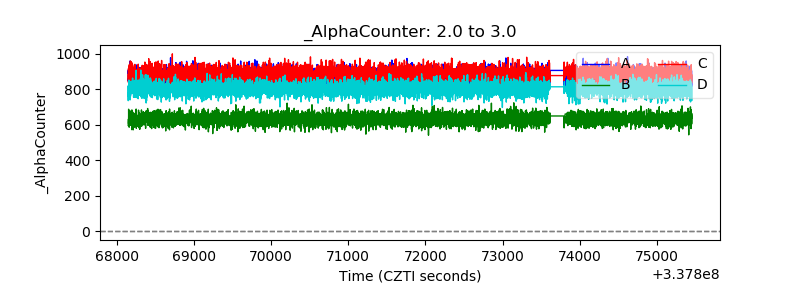 |
| _CPM_Rate | 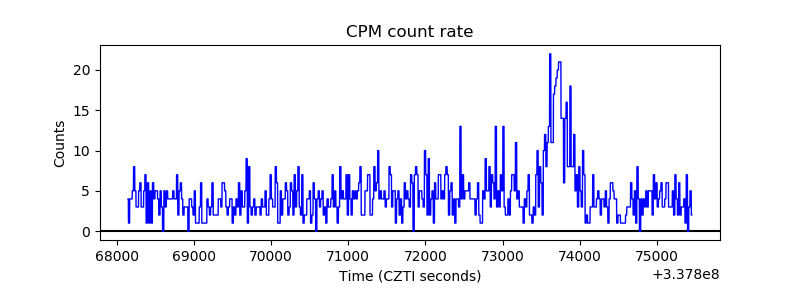 |
| CZT Counter |  |
| +2.5 Volts monitor |  |
| +5 Volts monitor |  |
| _ROLL_ROT | 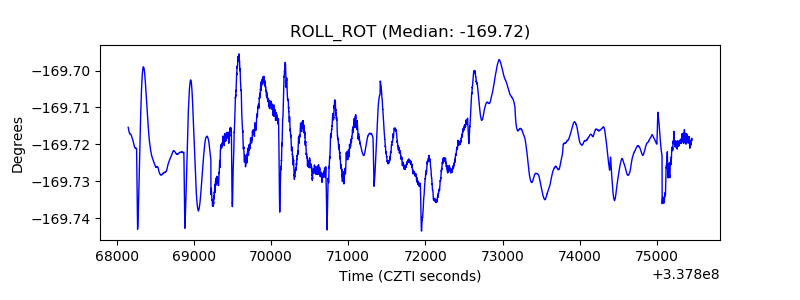 |
| _Roll_DEC | 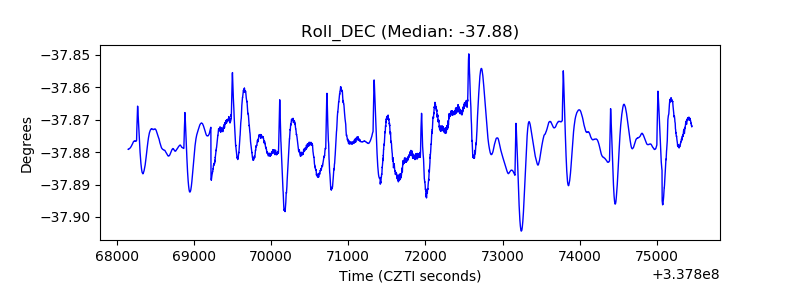 |
| _Roll_RA |  |
| Veto Counter | 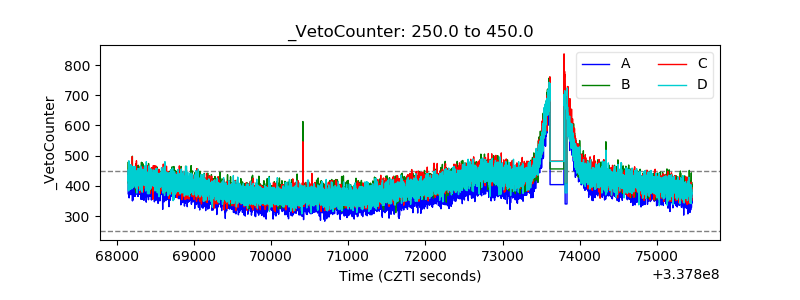 |