| Param | Original file | Final file |
|---|---|---|
| Filename | modeM0/AS1T03_224T01_9000003868_26859cztM0_level2.evt | modeM0/AS1T03_224T01_9000003868_26859cztM0_level2_quad_clean.evt |
| Size (bytes) | 1,756,915,200 | 225,262,080 |
| Size | 1.6 GB | 214.8 MB |
| Events in quadrant A | 10,007,525 | 1,456,951 |
| Events in quadrant B | 19,983,778 | 1,310,385 |
| Events in quadrant C | 8,472,826 | 1,446,336 |
| Events in quadrant D | 13,526,169 | 1,360,330 |
| Mode M0 | |||
|---|---|---|---|
| Quadrant | BADHDUFLAG | Total packets | Discarded packets |
| A | 0 | 41671 | 0 |
| B | 0 | 71675 | 0 |
| C | 0 | 37057 | 0 |
| D | 0 | 52258 | 0 |
| Mode M9 | |||
|---|---|---|---|
| Quadrant | BADHDUFLAG | Total packets | Discarded packets |
| A | 0 | 19 | 0 |
| B | 0 | 19 | 0 |
| C | 0 | 19 | 0 |
| D | 0 | 19 | 0 |
| Quadrant | Total seconds | Saturated seconds | Saturation percentage |
|---|---|---|---|
| A | 18086 | 350 | 1.935198% |
| B | 18087 | 3902 | 21.573506% |
| C | 18086 | 170 | 0.939954% |
| D | 18086 | 981 | 5.424085% |
Noise dominated data is calculated using 1-second bins in cleaned event files. If a bin has >2000 counts, and if more than 50% of those come from <1% of pixels, then it is considered to be noise-dominated and hence unusable.
| Quadrant | # 1 sec bins | Bins with >0 counts | Bins with >2000 counts | High rate bins dominated by noise | Noise dominated (total time) | Noise dominated (detector-on time) | Marked lightcurve |
|---|---|---|---|---|---|---|---|
| A | 19936 | 18089 | 204 | 204 | 1.02% | 1.13% | 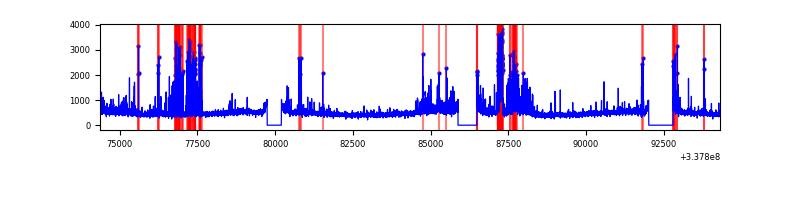 |
| B | 19937 | 18089 | 3028 | 3028 | 15.19% | 16.74% | 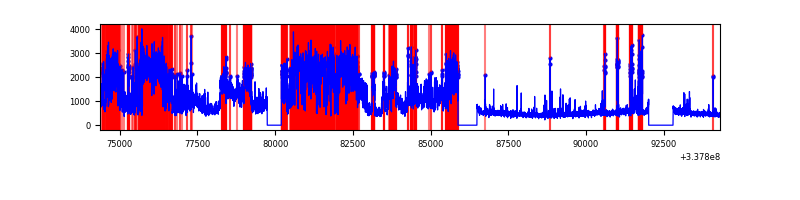 |
| C | 19936 | 18089 | 0 | 0 | 0.00% | 0.00% | 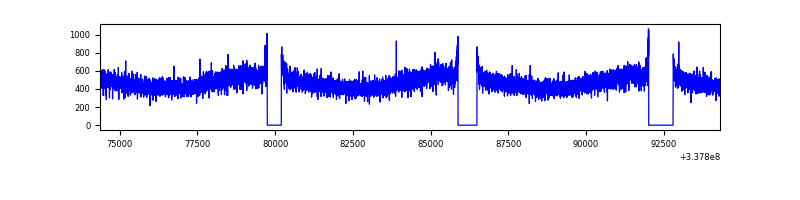 |
| D | 19936 | 18089 | 863 | 863 | 4.33% | 4.77% | 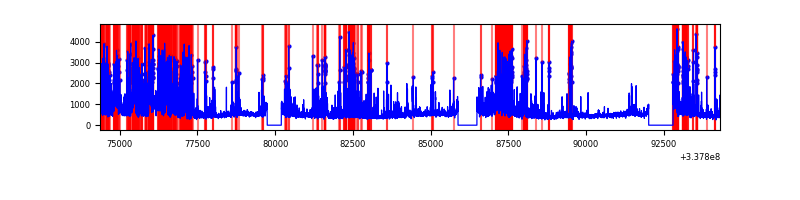 |
Top three noisy pixels from each quadrant. If the there are fewer than three noisy pixels in the level2.evt file, extra rows are filled as -1
| Pixel properties | Quadrant properties | ||||||
|---|---|---|---|---|---|---|---|
| Quadrant | DetID | PixID | Counts | Sigma | Mean | Median | Sigma |
| A | 0 | 13 | 1630542 | 3715.22 | 2169 | 2125 | 438.3 |
| A | 13 | 254 | 31052 | 66.0 | 2169 | 2125 | 438.3 |
| A | 3 | 137 | 20719 | 42.42 | 2169 | 2125 | 438.3 |
| B | 0 | 189 | 10741740 | 28075.05 | 2025 | 1980 | 382.5 |
| B | 3 | 64 | 703807 | 1834.66 | 2025 | 1980 | 382.5 |
| B | 10 | 246 | 500155 | 1302.29 | 2025 | 1980 | 382.5 |
| C | 14 | 238 | 333457 | 677.95 | 2088 | 2099 | 488.8 |
| C | 13 | 61 | 14465 | 25.3 | 2088 | 2099 | 488.8 |
| C | 3 | 233 | 8870 | 13.85 | 2088 | 2099 | 488.8 |
| D | 7 | 80 | 3641930 | 7531.41 | 2058 | 2010 | 483.3 |
| D | 1 | 52 | 1267228 | 2617.88 | 2058 | 2010 | 483.3 |
| D | 2 | 250 | 548375 | 1130.49 | 2058 | 2010 | 483.3 |
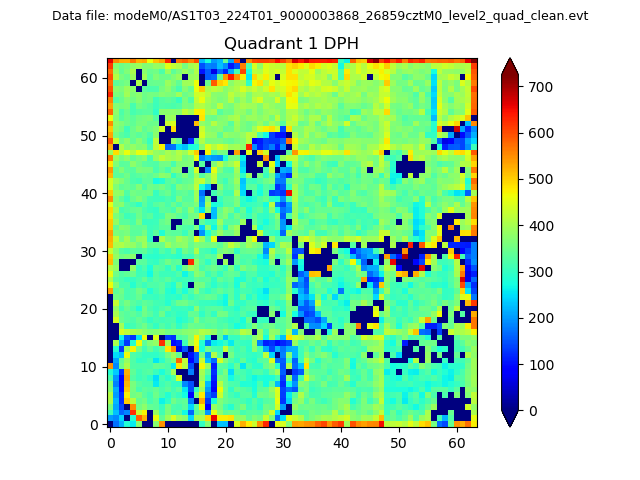
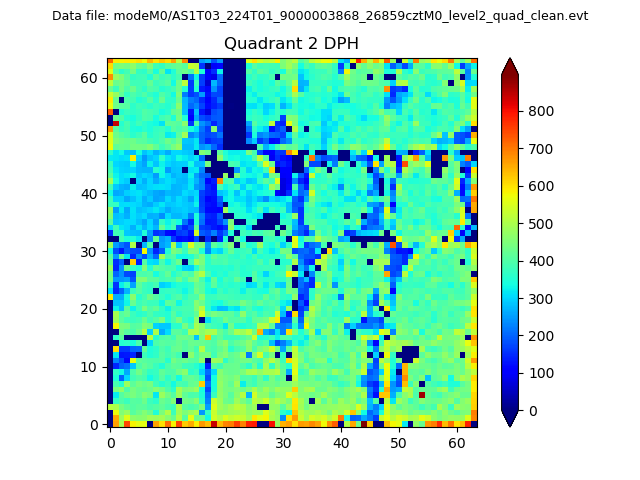
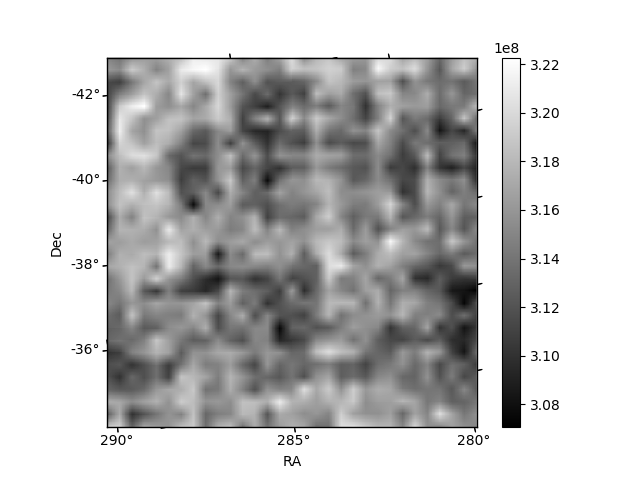
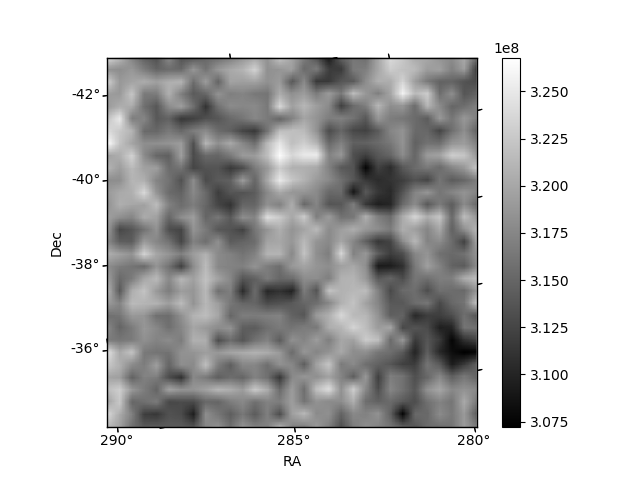
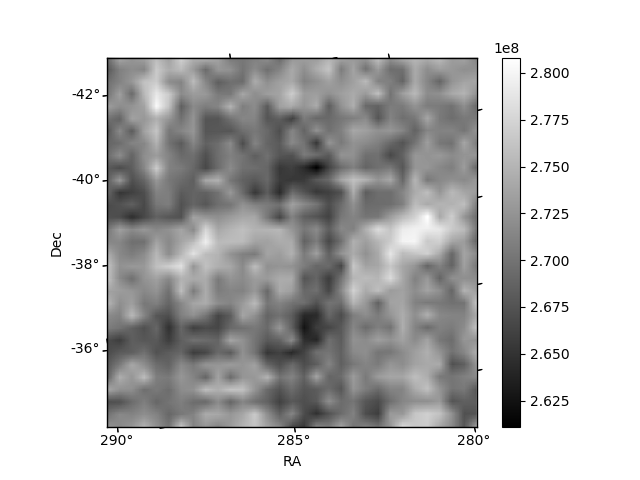
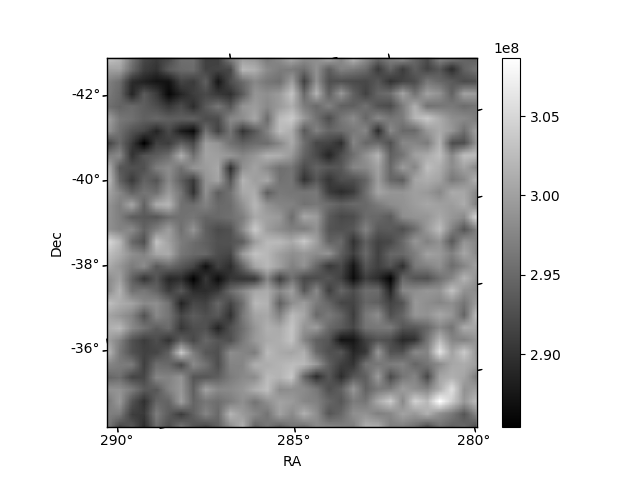
Histogram calculated using DETX and DETY for each event in the final _common_clean file
| Quadrant A |  |
 |
Quadrant B |
|---|---|---|---|
| Quadrant D |  |
 |
Quadrant C |
| Plot type | Count rate plots | Images |
|---|---|---|
| Comparison with Poisson distribution Blue bars denote a histogram of data divided into 1 sec bins. Red curve is a Poisson curve with rate = median count rate of data. |
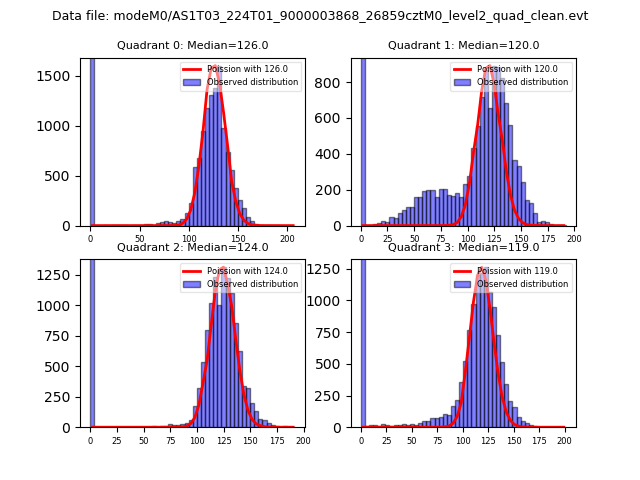 |
 |
| Quadrant-wise count rates Data is divided into 100 sec bins |
 |
|
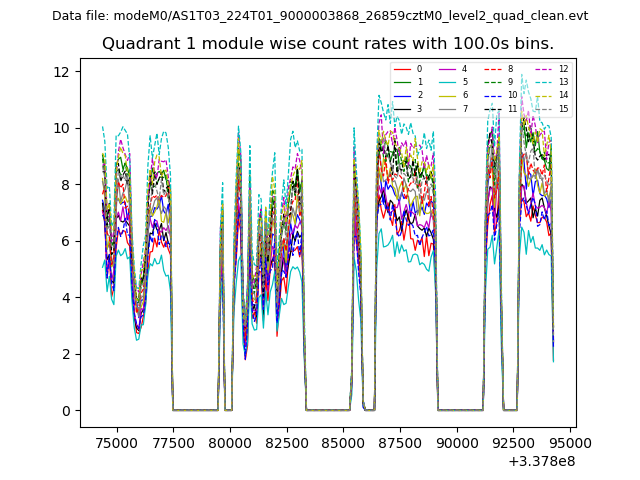
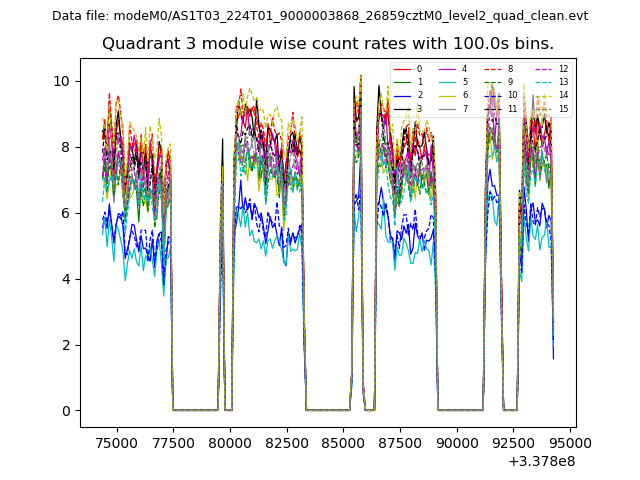
| Module-wise count rates for Quadrant A Data is divided into 100 sec bins |
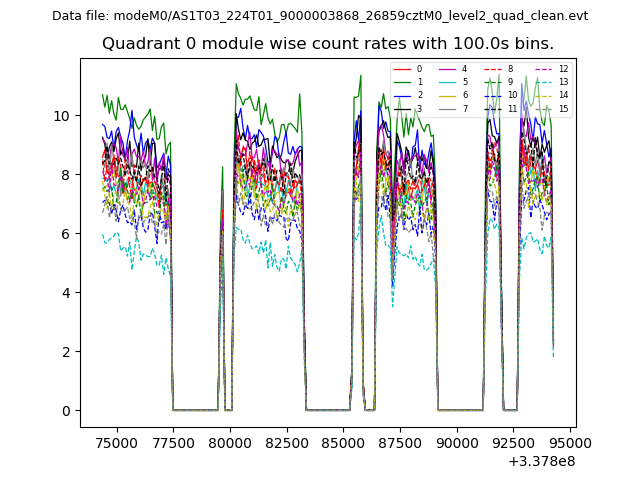 |
 |
| Module-wise count rates for Quadrant B Data is divided into 100 sec bins |
 |
 |
| Module-wise count rates for Quadrant C Data is divided into 100 sec bins |
 |
 |
| Module-wise count rates for Quadrant D Data is divided into 100 sec bins |
 |
 |
| Parameter | Plot |
|---|---|
| CZT HV Monitor | 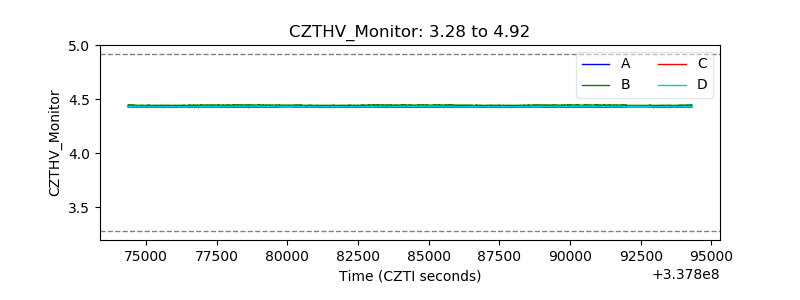 |
| D_VDD | 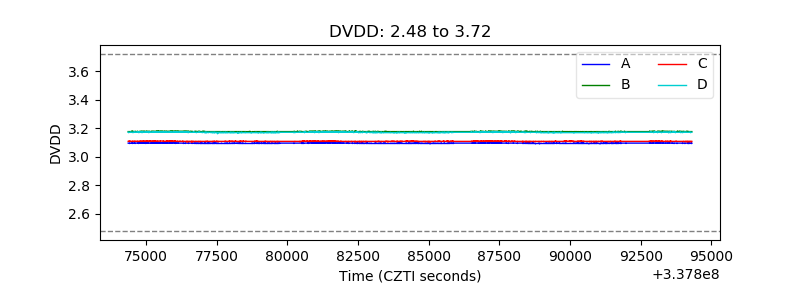 |
| Temperature 1 |  |
| Veto HV Monitor | 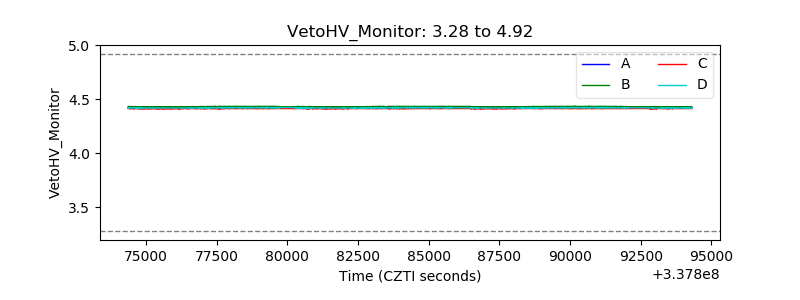 |
| Veto LLD | 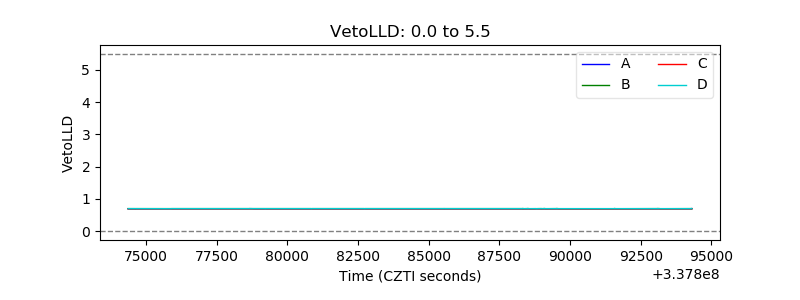 |
| Alpha Counter | 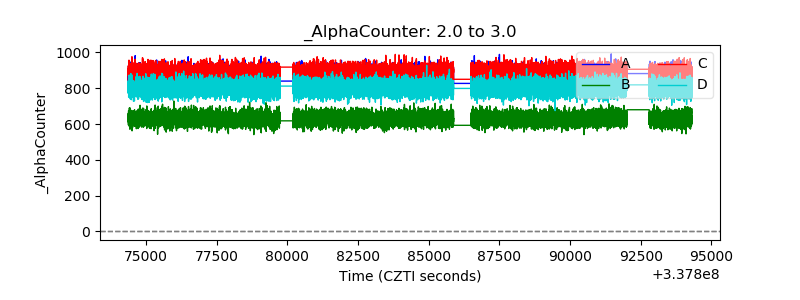 |
| _CPM_Rate | 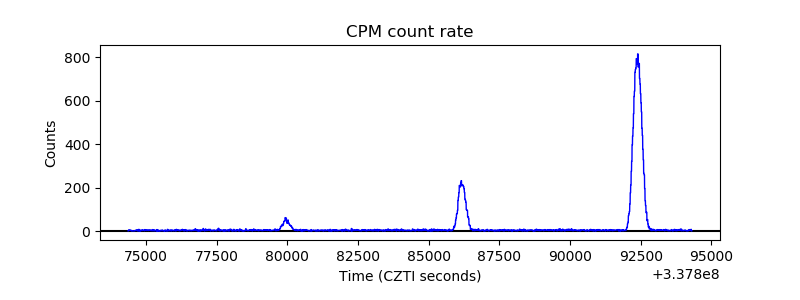 |
| CZT Counter | 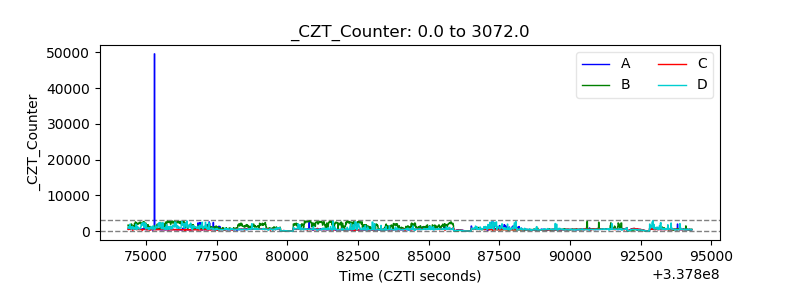 |
| +2.5 Volts monitor |  |
| +5 Volts monitor |  |
| _ROLL_ROT | 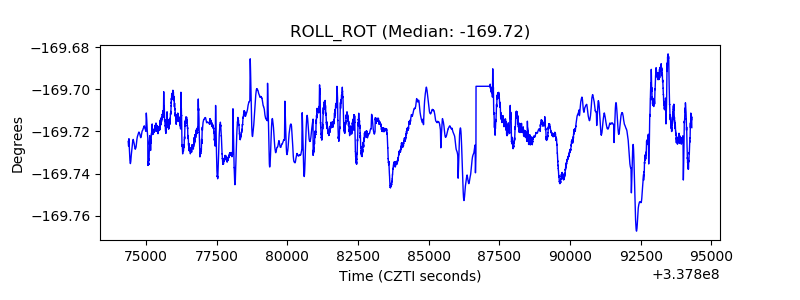 |
| _Roll_DEC | 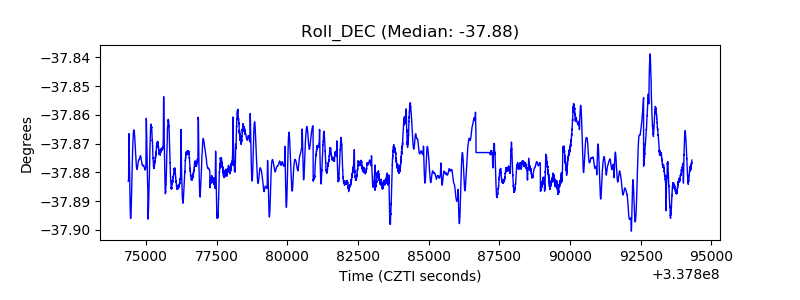 |
| _Roll_RA | 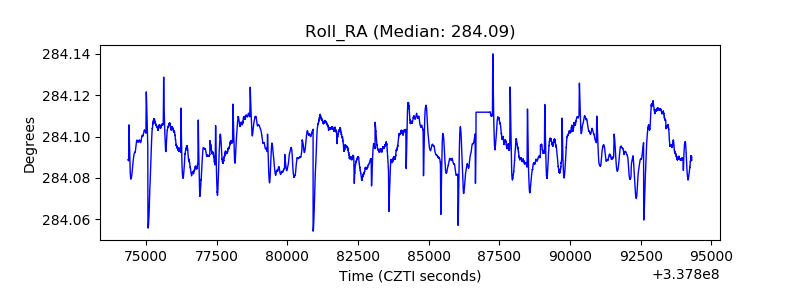 |
| Veto Counter | 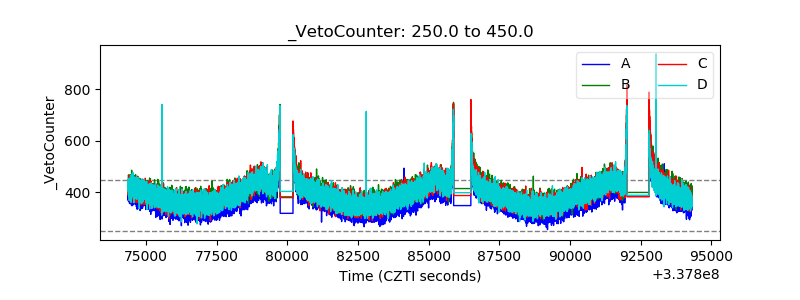 |