| Param | Original file | Final file |
|---|---|---|
| Filename | modeM0/AS1T03_224T01_9000003868_26860cztM0_level2.evt | modeM0/AS1T03_224T01_9000003868_26860cztM0_level2_quad_clean.evt |
| Size (bytes) | 510,955,200 | 93,263,040 |
| Size | 487.3 MB | 88.9 MB |
| Events in quadrant A | 4,459,491 | 591,272 |
| Events in quadrant B | 3,381,561 | 616,080 |
| Events in quadrant C | 3,154,294 | 591,244 |
| Events in quadrant D | 4,026,892 | 561,250 |
| Mode M0 | |||
|---|---|---|---|
| Quadrant | BADHDUFLAG | Total packets | Discarded packets |
| A | 0 | 17717 | 0 |
| B | 0 | 14271 | 0 |
| C | 0 | 13620 | 0 |
| D | 0 | 16536 | 0 |
| Mode M9 | |||
|---|---|---|---|
| Quadrant | BADHDUFLAG | Total packets | Discarded packets |
| A | 0 | 11 | 0 |
| B | 0 | 12 | 0 |
| C | 0 | 12 | 0 |
| D | 0 | 12 | 0 |
| Quadrant | Total seconds | Saturated seconds | Saturation percentage |
|---|---|---|---|
| A | 6667 | 141 | 2.114894% |
| B | 6667 | 63 | 0.944953% |
| C | 6667 | 56 | 0.839958% |
| D | 6667 | 237 | 3.554822% |
Noise dominated data is calculated using 1-second bins in cleaned event files. If a bin has >2000 counts, and if more than 50% of those come from <1% of pixels, then it is considered to be noise-dominated and hence unusable.
| Quadrant | # 1 sec bins | Bins with >0 counts | Bins with >2000 counts | High rate bins dominated by noise | Noise dominated (total time) | Noise dominated (detector-on time) | Marked lightcurve |
|---|---|---|---|---|---|---|---|
| A | 7627 | 6668 | 76 | 76 | 1.00% | 1.14% | 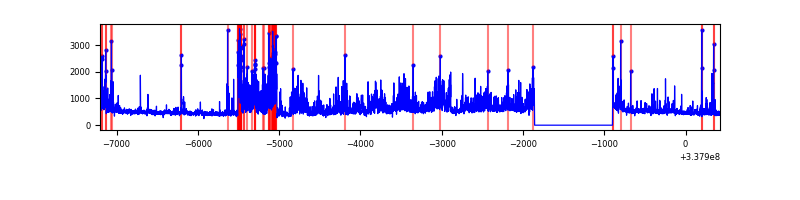 |
| B | 7627 | 6668 | 25 | 25 | 0.33% | 0.37% | 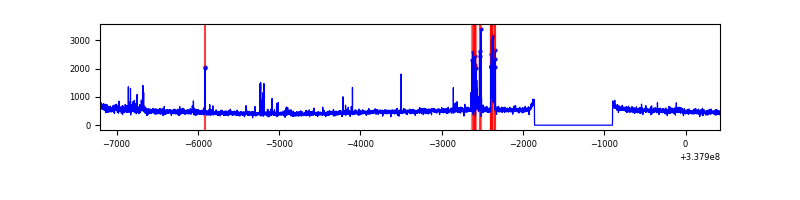 |
| C | 7627 | 6668 | 0 | 0 | 0.00% | 0.00% | 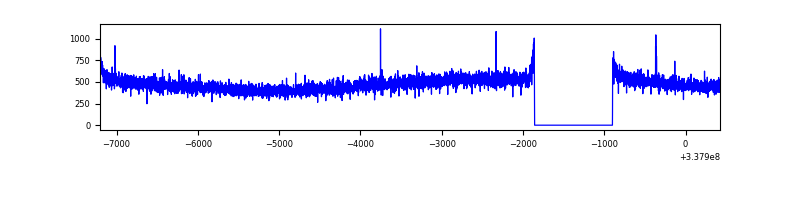 |
| D | 7627 | 6668 | 189 | 189 | 2.48% | 2.83% | 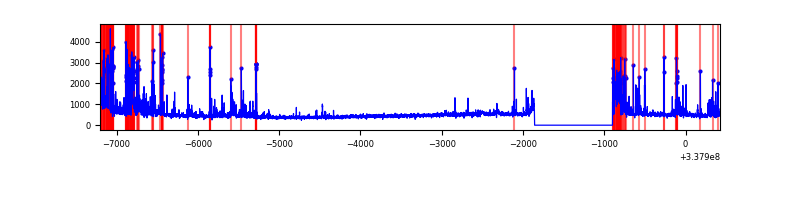 |
Top three noisy pixels from each quadrant. If the there are fewer than three noisy pixels in the level2.evt file, extra rows are filled as -1
| Pixel properties | Quadrant properties | ||||||
|---|---|---|---|---|---|---|---|
| Quadrant | DetID | PixID | Counts | Sigma | Mean | Median | Sigma |
| A | 0 | 13 | 1326630 | 8131.3 | 805 | 789 | 163.1 |
| A | 6 | 16 | 25004 | 148.51 | 805 | 789 | 163.1 |
| A | 13 | 254 | 11622 | 66.44 | 805 | 789 | 163.1 |
| B | 10 | 246 | 77380 | 491.93 | 811 | 790 | 155.7 |
| B | 3 | 64 | 67270 | 427.0 | 811 | 790 | 155.7 |
| B | 0 | 189 | 31783 | 199.07 | 811 | 790 | 155.7 |
| C | 14 | 238 | 123510 | 670.1 | 776 | 780 | 183.2 |
| C | 13 | 61 | 5362 | 25.02 | 776 | 780 | 183.2 |
| C | 15 | 208 | 4280 | 19.11 | 776 | 780 | 183.2 |
| D | 7 | 80 | 417596 | 2320.27 | 765 | 749 | 179.7 |
| D | 1 | 52 | 334596 | 1858.27 | 765 | 749 | 179.7 |
| D | 2 | 250 | 283005 | 1571.11 | 765 | 749 | 179.7 |
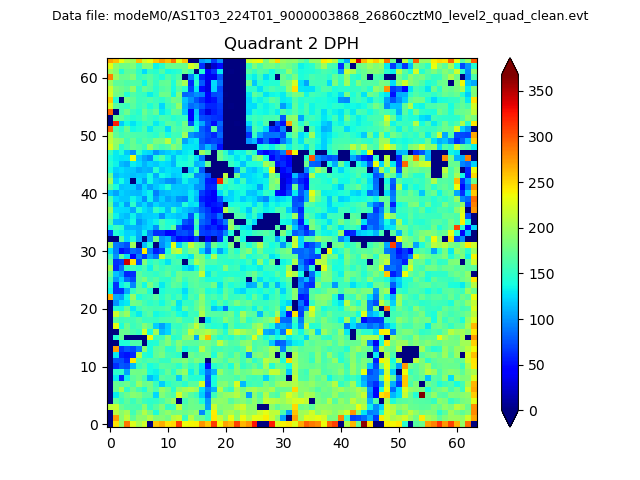
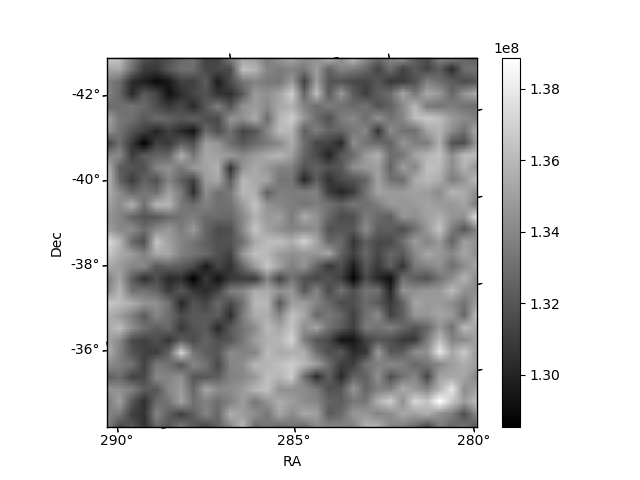
Histogram calculated using DETX and DETY for each event in the final _common_clean file
| Quadrant A | 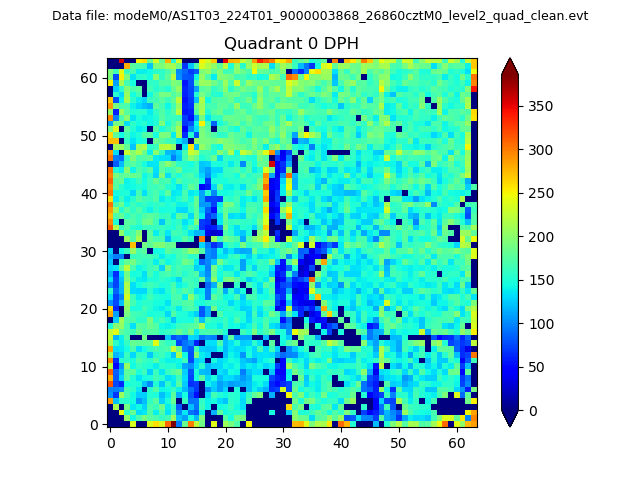 |
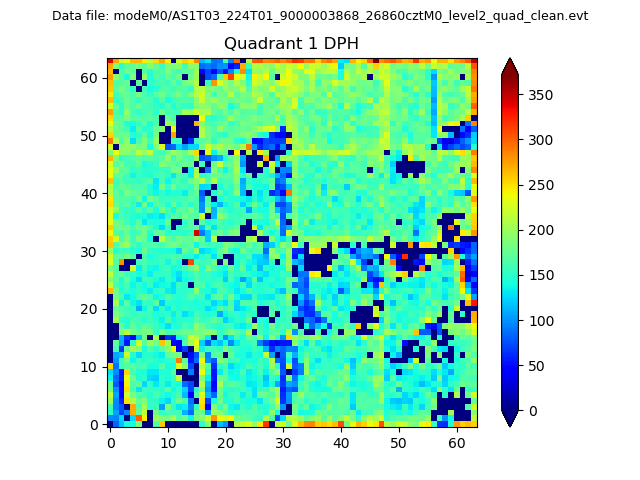 |
Quadrant B |
|---|---|---|---|
| Quadrant D | 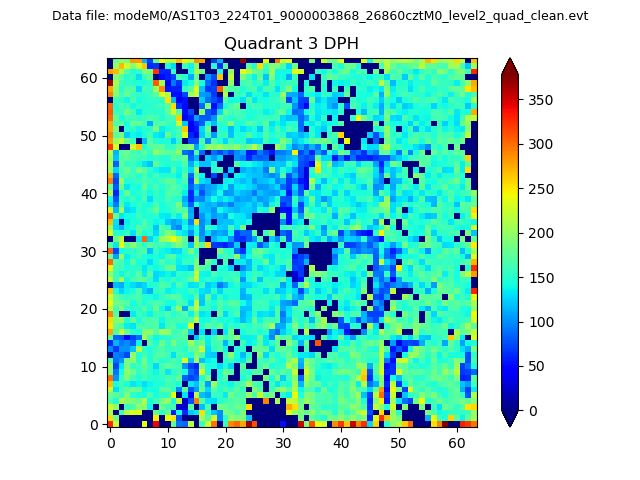 |
 |
Quadrant C |
| Plot type | Count rate plots | Images |
|---|---|---|
| Comparison with Poisson distribution Blue bars denote a histogram of data divided into 1 sec bins. Red curve is a Poisson curve with rate = median count rate of data. |
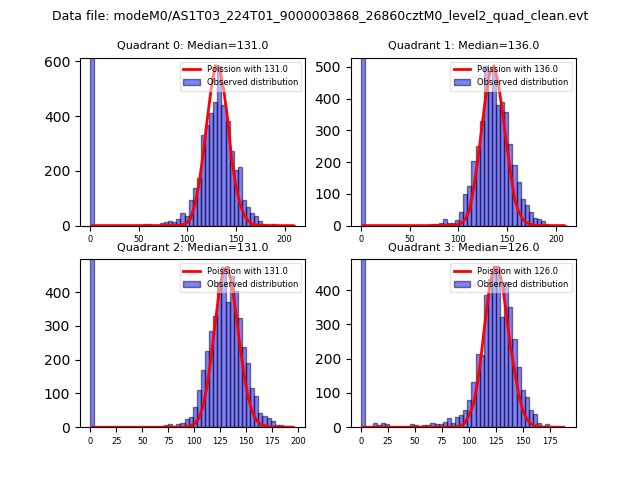 |
 |
| Quadrant-wise count rates Data is divided into 100 sec bins |
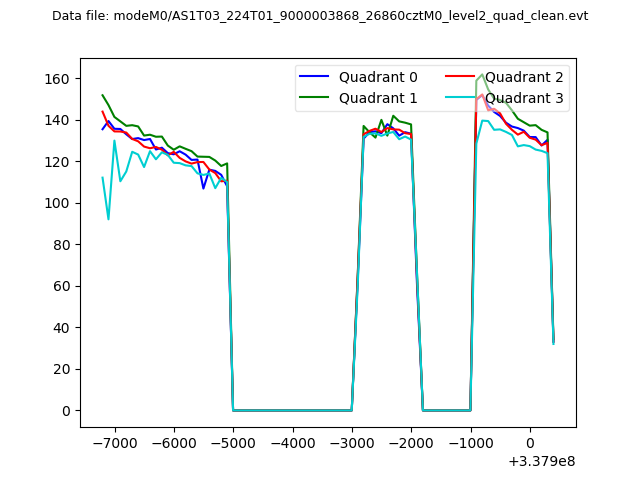 |
|
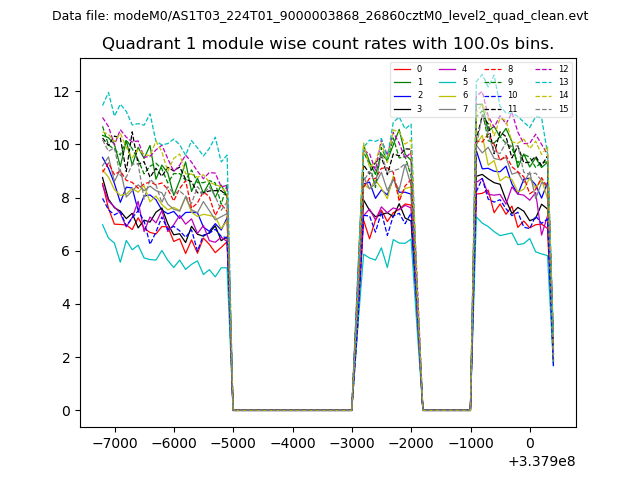
| Module-wise count rates for Quadrant A Data is divided into 100 sec bins |
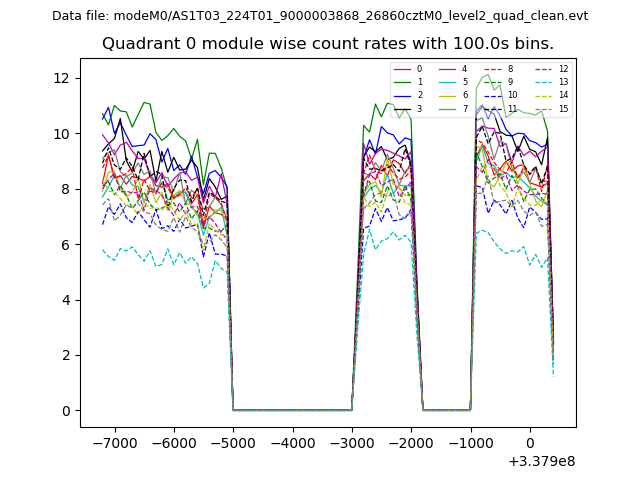 |
 |
| Module-wise count rates for Quadrant B Data is divided into 100 sec bins |
 |
 |
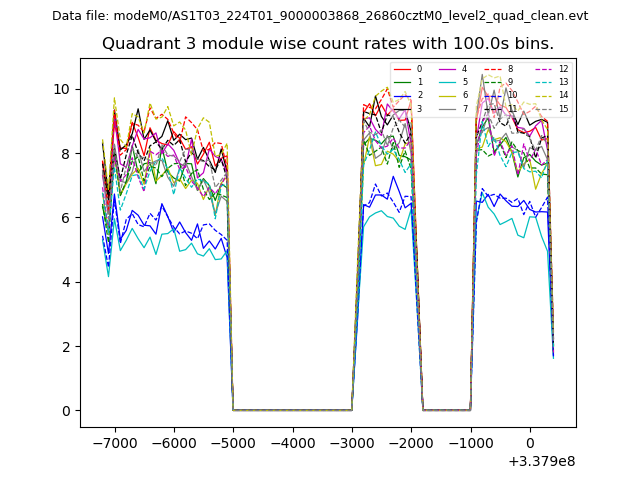
| Module-wise count rates for Quadrant C Data is divided into 100 sec bins |
 |
 |
| Module-wise count rates for Quadrant D Data is divided into 100 sec bins |
 |
 |
| Parameter | Plot |
|---|---|
| CZT HV Monitor | 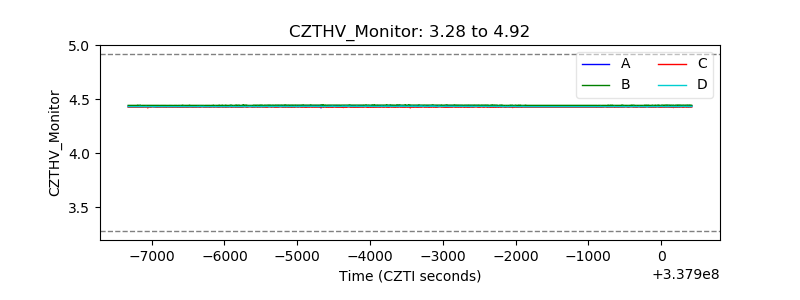 |
| D_VDD | 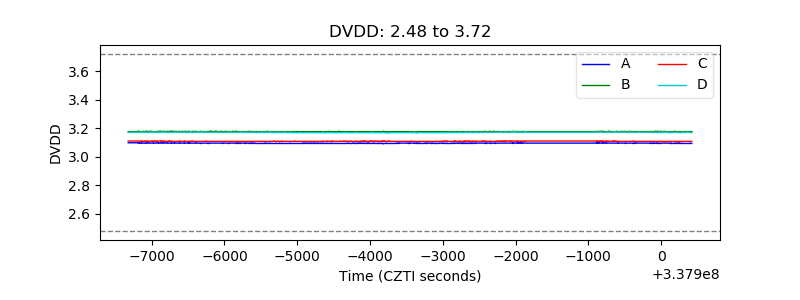 |
| Temperature 1 | 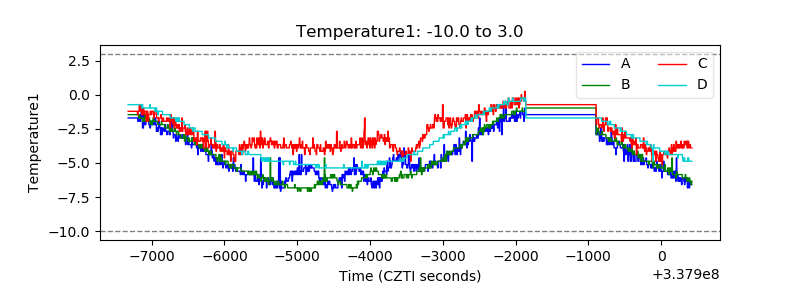 |
| Veto HV Monitor | 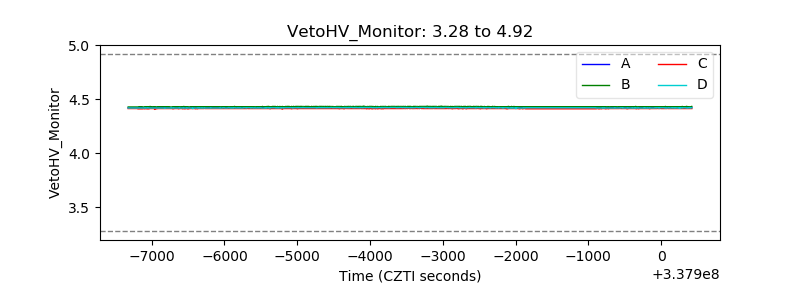 |
| Veto LLD |  |
| Alpha Counter | 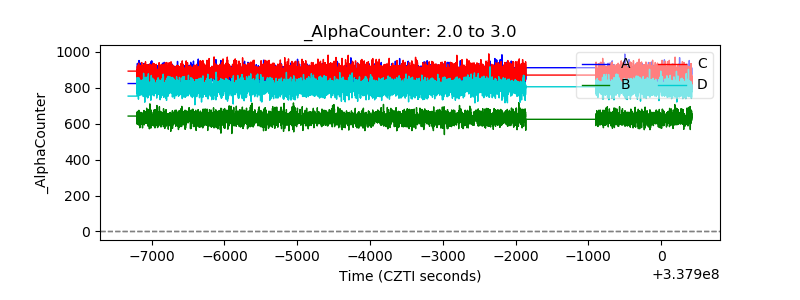 |
| _CPM_Rate | 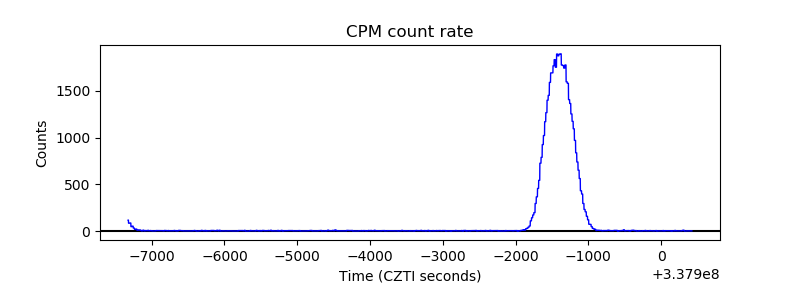 |
| CZT Counter |  |
| +2.5 Volts monitor |  |
| +5 Volts monitor | 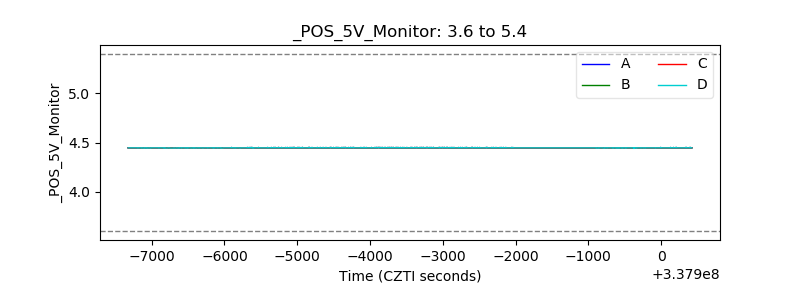 |
| _ROLL_ROT | 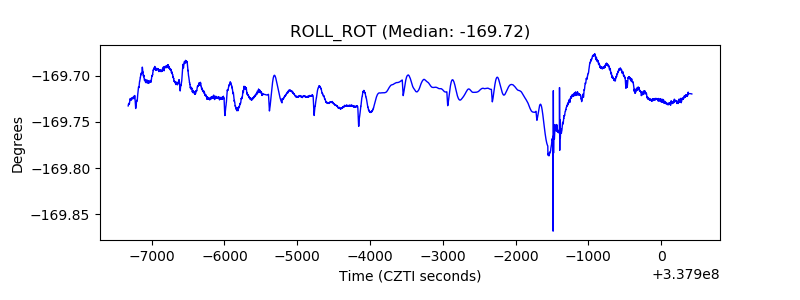 |
| _Roll_DEC | 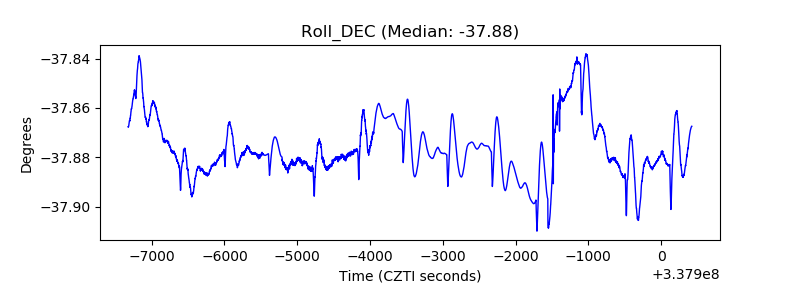 |
| _Roll_RA |  |
| Veto Counter | 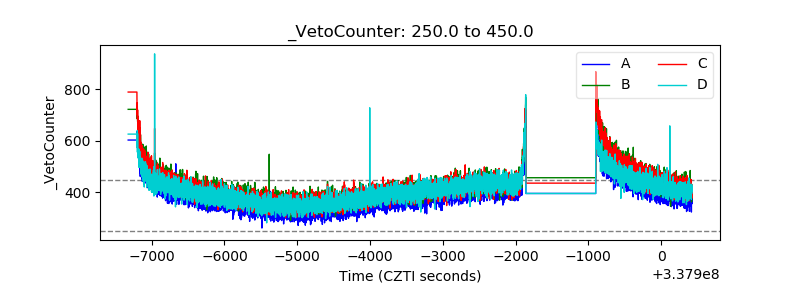 |