| Param | Original file | Final file |
|---|---|---|
| Filename | modeM0/AS1T03_224T01_9000003868_26862cztM0_level2.evt | modeM0/AS1T03_224T01_9000003868_26862cztM0_level2_quad_clean.evt |
| Size (bytes) | 548,305,920 | 92,465,280 |
| Size | 522.9 MB | 88.2 MB |
| Events in quadrant A | 3,417,732 | 601,103 |
| Events in quadrant B | 5,258,063 | 582,701 |
| Events in quadrant C | 3,144,000 | 596,853 |
| Events in quadrant D | 4,347,672 | 568,656 |
| Mode M0 | |||
|---|---|---|---|
| Quadrant | BADHDUFLAG | Total packets | Discarded packets |
| A | 0 | 14219 | 0 |
| B | 0 | 19795 | 0 |
| C | 0 | 13297 | 0 |
| D | 0 | 17312 | 0 |
| Mode M9 | |||
|---|---|---|---|
| Quadrant | BADHDUFLAG | Total packets | Discarded packets |
| A | 0 | 18 | 0 |
| B | 0 | 19 | 0 |
| C | 0 | 19 | 0 |
| D | 0 | 19 | 0 |
| Quadrant | Total seconds | Saturated seconds | Saturation percentage |
|---|---|---|---|
| A | 6463 | 44 | 0.680798% |
| B | 6462 | 896 | 13.865676% |
| C | 6462 | 43 | 0.665429% |
| D | 6462 | 177 | 2.739090% |
Noise dominated data is calculated using 1-second bins in cleaned event files. If a bin has >2000 counts, and if more than 50% of those come from <1% of pixels, then it is considered to be noise-dominated and hence unusable.
| Quadrant | # 1 sec bins | Bins with >0 counts | Bins with >2000 counts | High rate bins dominated by noise | Noise dominated (total time) | Noise dominated (detector-on time) | Marked lightcurve |
|---|---|---|---|---|---|---|---|
| A | 7613 | 6464 | 20 | 20 | 0.26% | 0.31% | 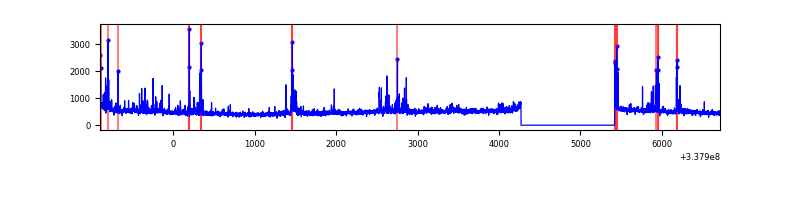 |
| B | 7612 | 6463 | 770 | 770 | 10.12% | 11.91% | 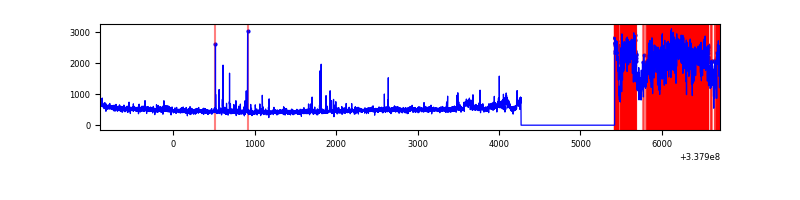 |
| C | 7612 | 6463 | 0 | 0 | 0.00% | 0.00% | 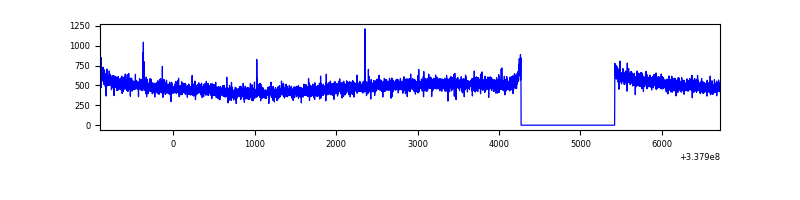 |
| D | 7612 | 6463 | 132 | 132 | 1.73% | 2.04% | 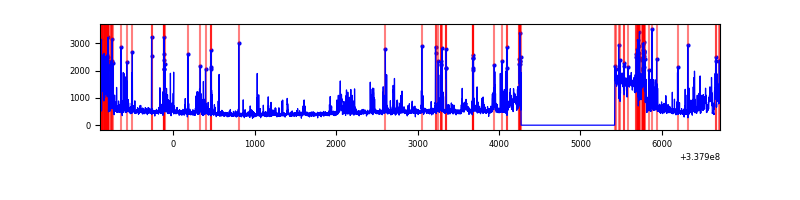 |
Top three noisy pixels from each quadrant. If the there are fewer than three noisy pixels in the level2.evt file, extra rows are filled as -1
| Pixel properties | Quadrant properties | ||||||
|---|---|---|---|---|---|---|---|
| Quadrant | DetID | PixID | Counts | Sigma | Mean | Median | Sigma |
| A | 0 | 13 | 324932 | 2021.78 | 797 | 783 | 160.3 |
| A | 6 | 16 | 13499 | 79.31 | 797 | 783 | 160.3 |
| A | 13 | 254 | 10554 | 60.94 | 797 | 783 | 160.3 |
| B | 5 | 31 | 693104 | 4682.12 | 773 | 753 | 147.9 |
| B | 5 | 15 | 688719 | 4652.47 | 773 | 753 | 147.9 |
| B | 5 | 14 | 686836 | 4639.73 | 773 | 753 | 147.9 |
| C | 14 | 238 | 123597 | 676.21 | 772 | 777 | 181.6 |
| C | 13 | 61 | 5377 | 25.33 | 772 | 777 | 181.6 |
| C | 8 | 128 | 4501 | 20.5 | 772 | 777 | 181.6 |
| D | 7 | 80 | 665343 | 3740.85 | 760 | 744 | 177.7 |
| D | 1 | 52 | 376936 | 2117.49 | 760 | 744 | 177.7 |
| D | 2 | 250 | 272648 | 1530.48 | 760 | 744 | 177.7 |
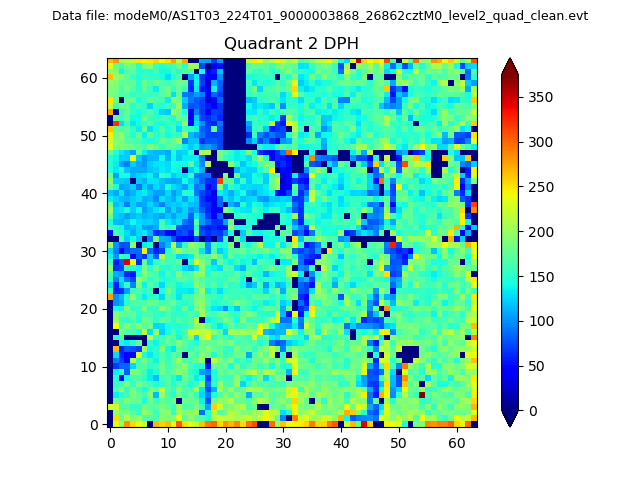
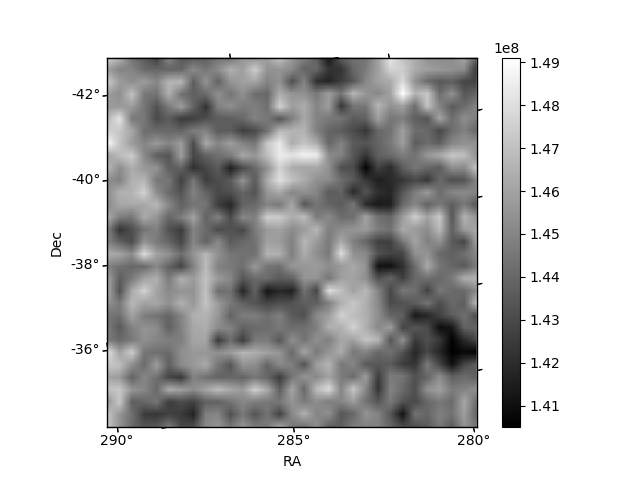
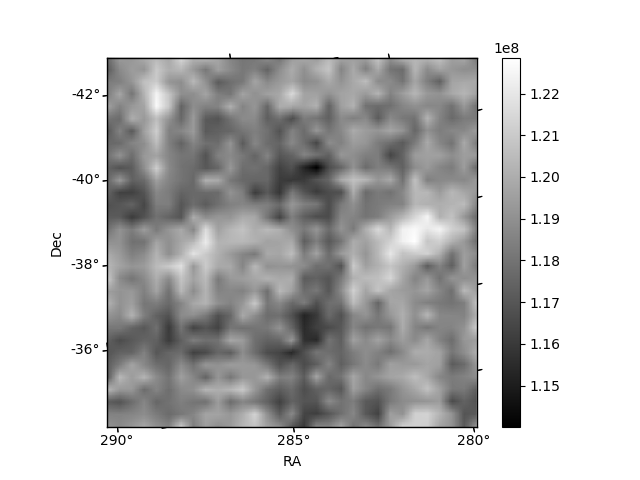
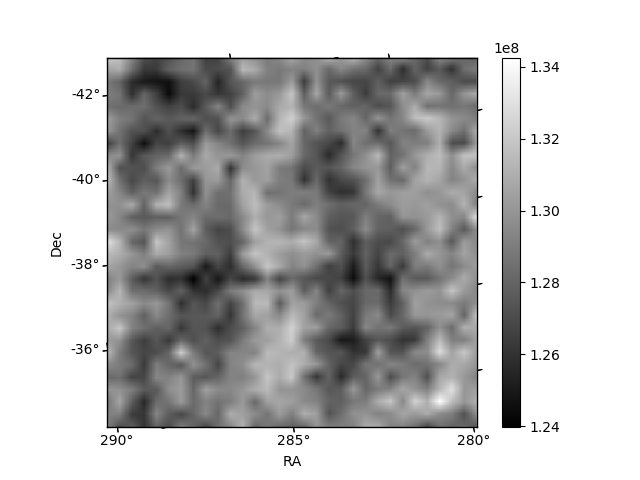
Histogram calculated using DETX and DETY for each event in the final _common_clean file
| Quadrant A | 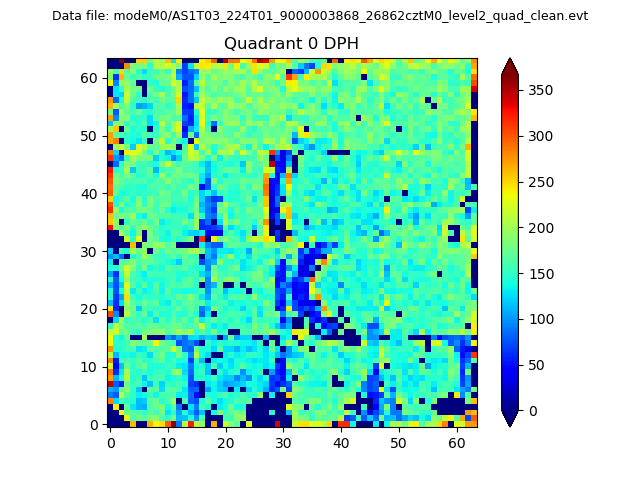 |
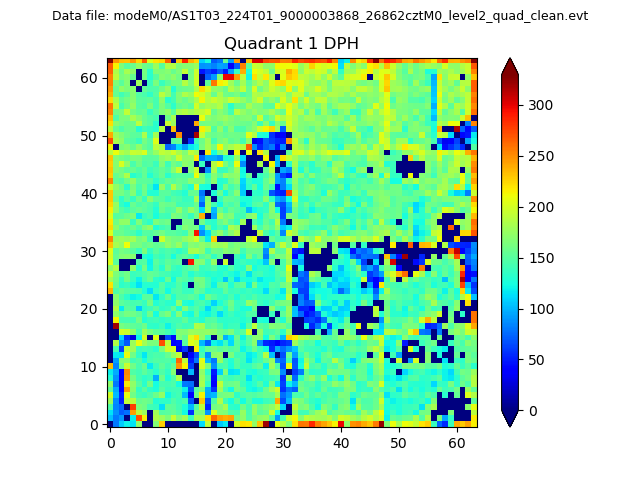 |
Quadrant B |
|---|---|---|---|
| Quadrant D | 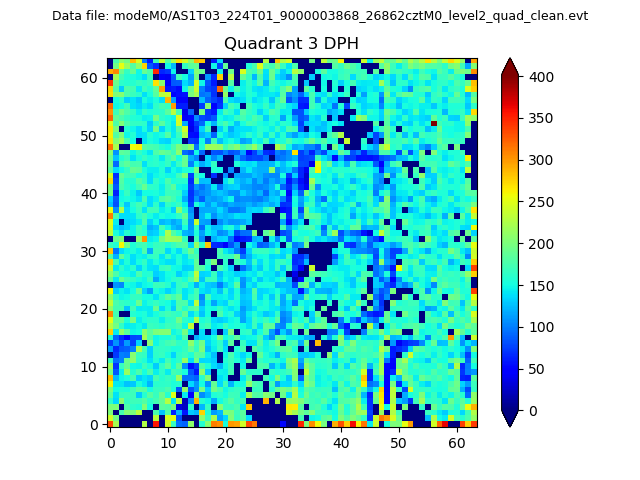 |
 |
Quadrant C |
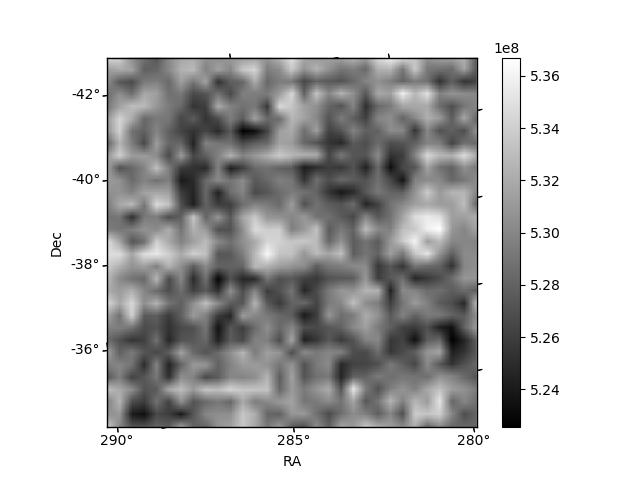
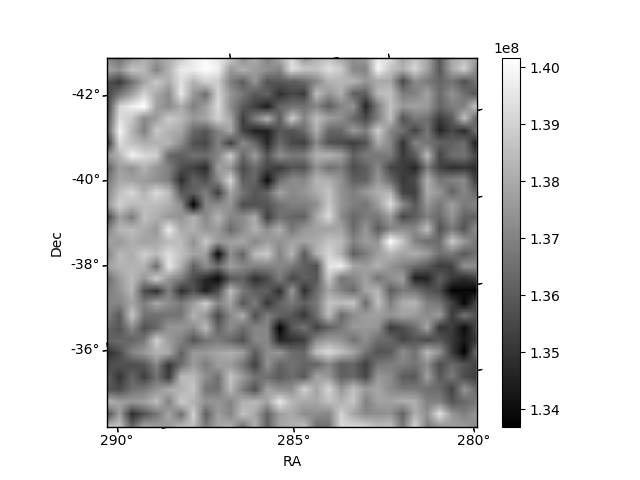
| Plot type | Count rate plots | Images |
|---|---|---|
| Comparison with Poisson distribution Blue bars denote a histogram of data divided into 1 sec bins. Red curve is a Poisson curve with rate = median count rate of data. |
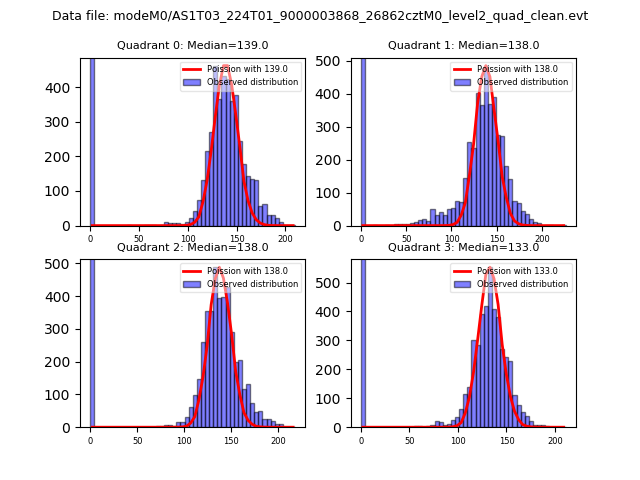 |
 |
| Quadrant-wise count rates Data is divided into 100 sec bins |
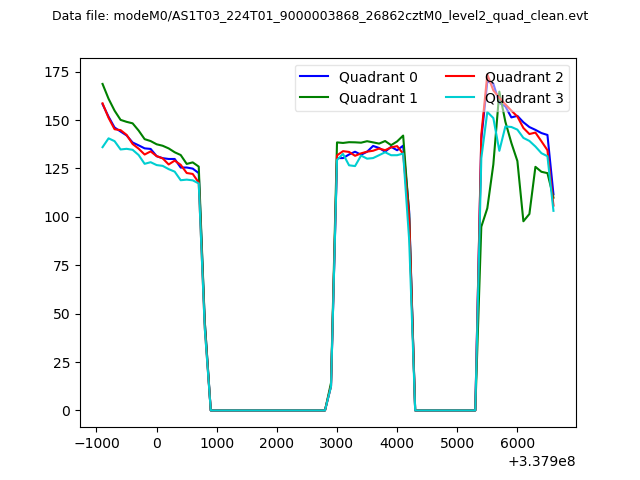 |
|
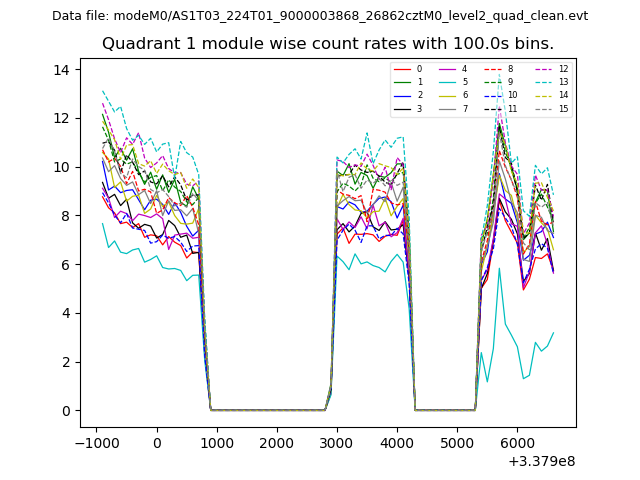
| Module-wise count rates for Quadrant A Data is divided into 100 sec bins |
 |
 |
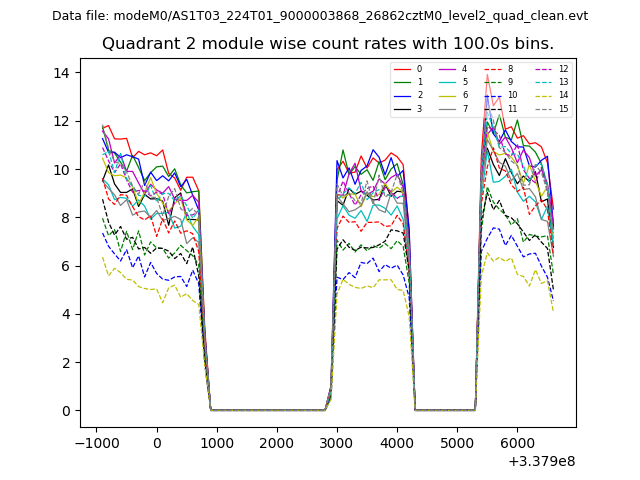
| Module-wise count rates for Quadrant B Data is divided into 100 sec bins |
 |
 |
| Module-wise count rates for Quadrant C Data is divided into 100 sec bins |
 |
 |
| Module-wise count rates for Quadrant D Data is divided into 100 sec bins |
 |
 |
| Parameter | Plot |
|---|---|
| CZT HV Monitor | 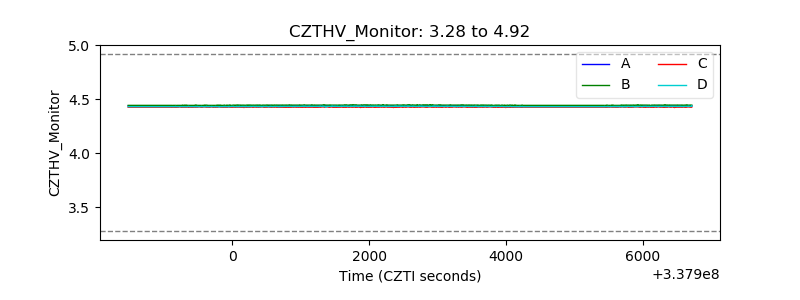 |
| D_VDD | 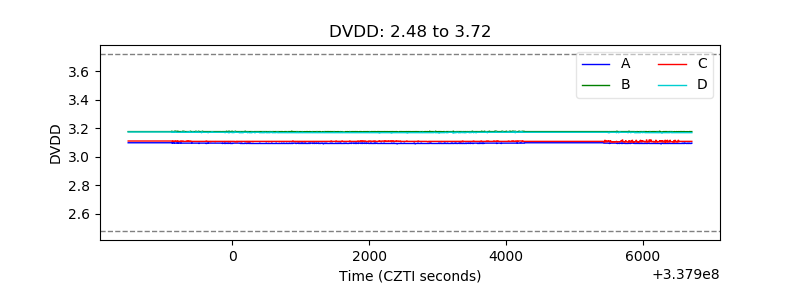 |
| Temperature 1 |  |
| Veto HV Monitor | 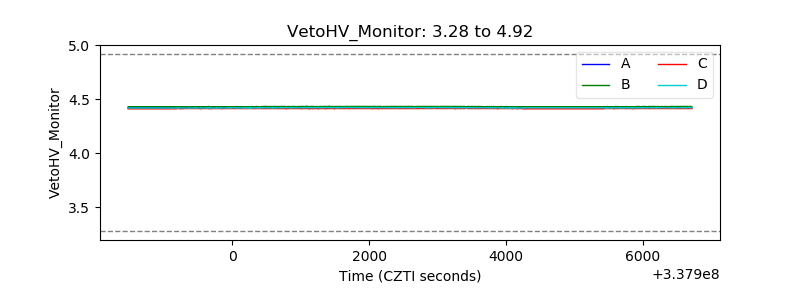 |
| Veto LLD | 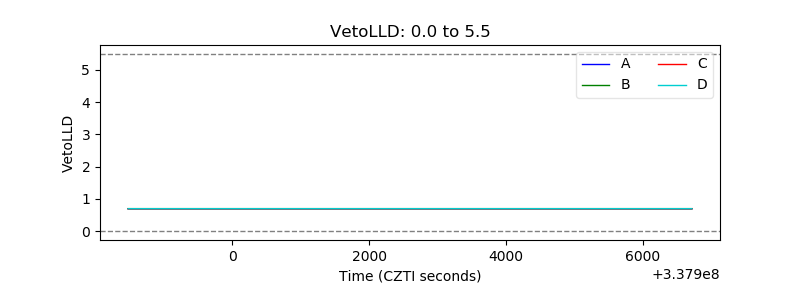 |
| Alpha Counter | 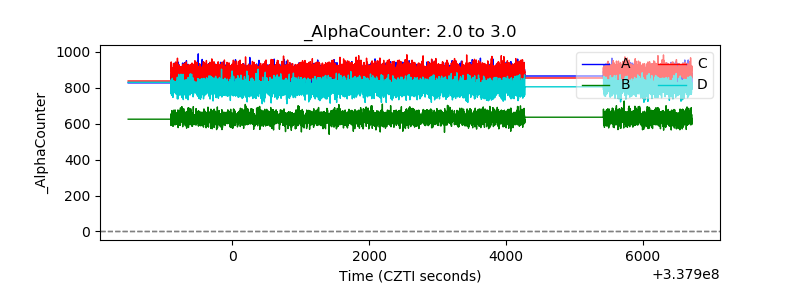 |
| _CPM_Rate | 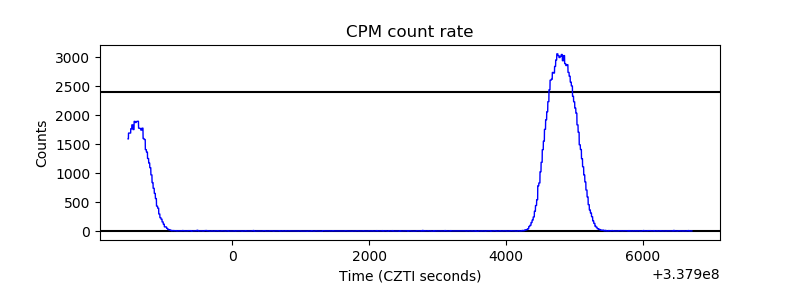 |
| CZT Counter | 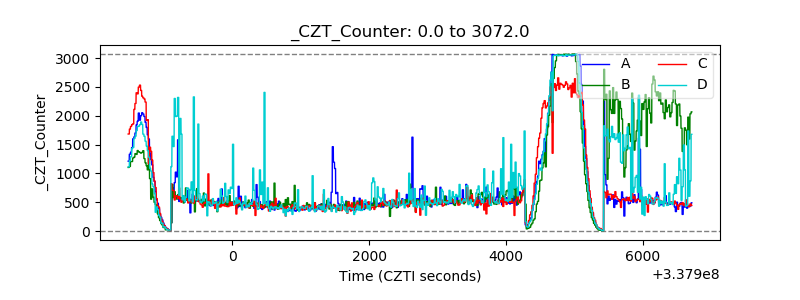 |
| +2.5 Volts monitor |  |
| +5 Volts monitor |  |
| _ROLL_ROT | 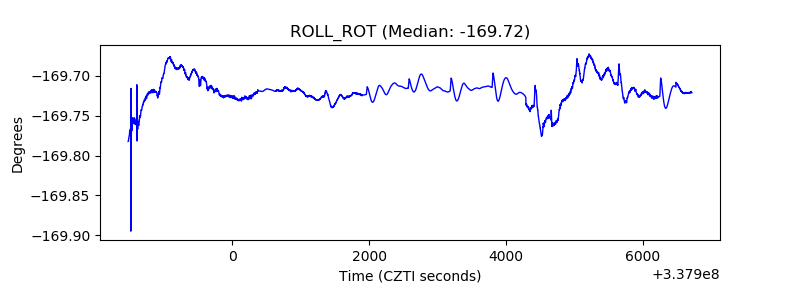 |
| _Roll_DEC | 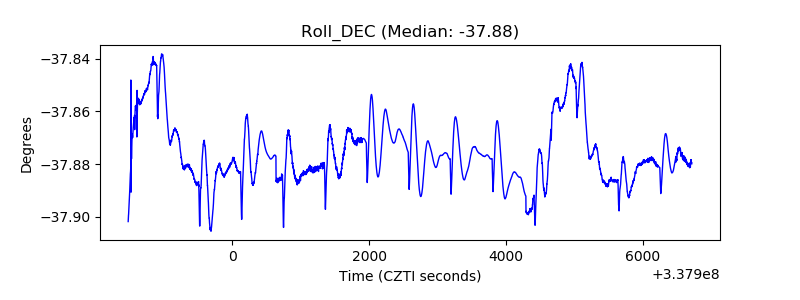 |
| _Roll_RA | 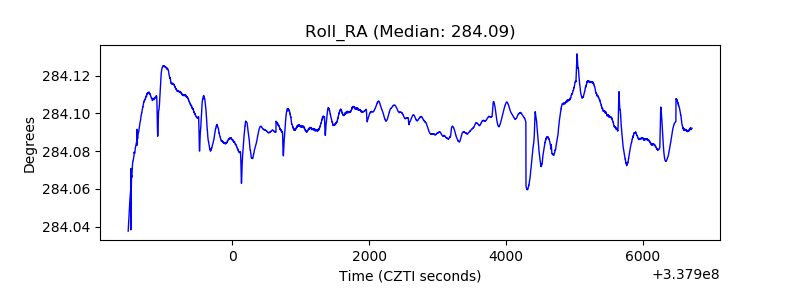 |
| Veto Counter | 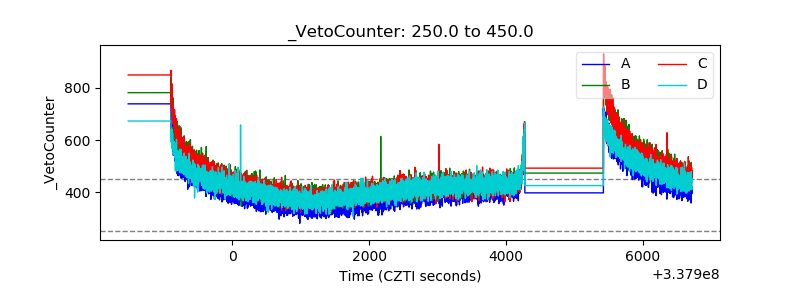 |