| Param | Original file | Final file |
|---|---|---|
| Filename | modeM0/AS1T03_224T01_9000003868_26863cztM0_level2.evt | modeM0/AS1T03_224T01_9000003868_26863cztM0_level2_quad_clean.evt |
| Size (bytes) | 227,877,120 | 28,019,520 |
| Size | 217.3 MB | 26.7 MB |
| Events in quadrant A | 945,505 | 193,614 |
| Events in quadrant B | 3,420,866 | 159,355 |
| Events in quadrant C | 854,464 | 191,910 |
| Events in quadrant D | 1,564,582 | 179,514 |
| Mode M0 | |||
|---|---|---|---|
| Quadrant | BADHDUFLAG | Total packets | Discarded packets |
| A | 0 | 3825 | 0 |
| B | 0 | 11333 | 0 |
| C | 0 | 3537 | 0 |
| D | 0 | 5815 | 0 |
| Mode M9 | |||
|---|---|---|---|
| Quadrant | BADHDUFLAG | Total packets | Discarded packets |
| A | 0 | 2 | 0 |
| B | 0 | 3 | 0 |
| C | 0 | 3 | 0 |
| D | 0 | 3 | 0 |
| Quadrant | Total seconds | Saturated seconds | Saturation percentage |
|---|---|---|---|
| A | 1678 | 12 | 0.715137% |
| B | 1678 | 1066 | 63.528010% |
| C | 1678 | 7 | 0.417163% |
| D | 1678 | 64 | 3.814064% |
Noise dominated data is calculated using 1-second bins in cleaned event files. If a bin has >2000 counts, and if more than 50% of those come from <1% of pixels, then it is considered to be noise-dominated and hence unusable.
| Quadrant | # 1 sec bins | Bins with >0 counts | Bins with >2000 counts | High rate bins dominated by noise | Noise dominated (total time) | Noise dominated (detector-on time) | Marked lightcurve |
|---|---|---|---|---|---|---|---|
| A | 1678 | 1678 | 10 | 10 | 0.60% | 0.60% | 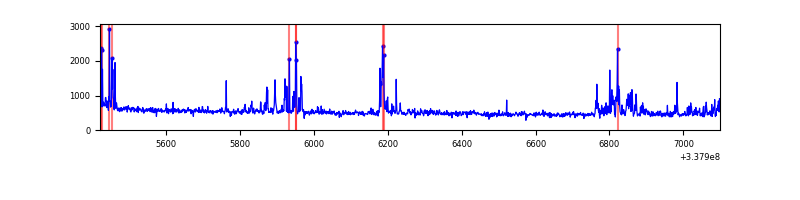 |
| B | 1678 | 1678 | 977 | 977 | 58.22% | 58.22% | 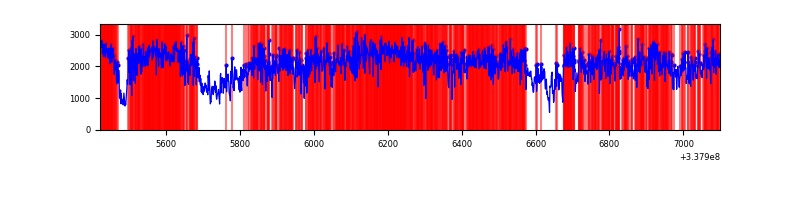 |
| C | 1678 | 1678 | 0 | 0 | 0.00% | 0.00% | 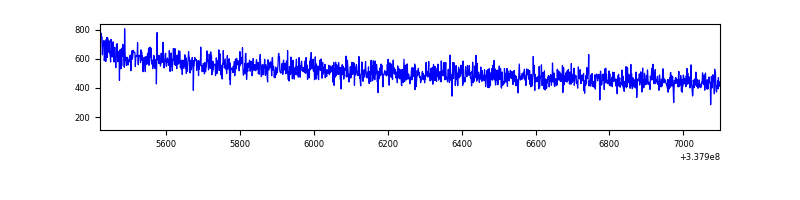 |
| D | 1678 | 1678 | 54 | 54 | 3.22% | 3.22% | 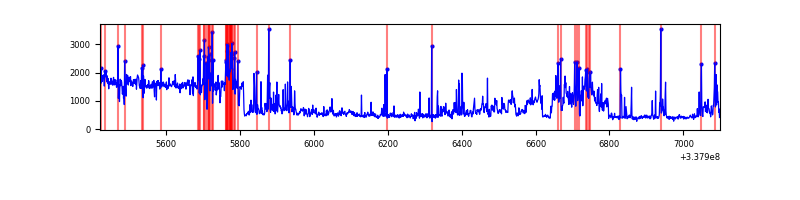 |
Top three noisy pixels from each quadrant. If the there are fewer than three noisy pixels in the level2.evt file, extra rows are filled as -1
| Pixel properties | Quadrant properties | ||||||
|---|---|---|---|---|---|---|---|
| Quadrant | DetID | PixID | Counts | Sigma | Mean | Median | Sigma |
| A | 0 | 13 | 123294 | 2774.46 | 212 | 209 | 44.4 |
| A | 13 | 254 | 3005 | 63.02 | 212 | 209 | 44.4 |
| A | 3 | 137 | 1867 | 37.37 | 212 | 209 | 44.4 |
| B | 5 | 31 | 900323 | 25295.99 | 182 | 178 | 35.6 |
| B | 5 | 15 | 894585 | 25134.74 | 182 | 178 | 35.6 |
| B | 5 | 14 | 890246 | 25012.8 | 182 | 178 | 35.6 |
| C | 14 | 238 | 33846 | 659.02 | 208 | 209 | 51.0 |
| C | 8 | 128 | 3865 | 71.63 | 208 | 209 | 51.0 |
| C | 8 | 112 | 1502 | 25.33 | 208 | 209 | 51.0 |
| D | 1 | 52 | 356803 | 7439.29 | 199 | 196 | 47.9 |
| D | 7 | 80 | 327071 | 6819.04 | 199 | 196 | 47.9 |
| D | 12 | 227 | 45355 | 942.08 | 199 | 196 | 47.9 |
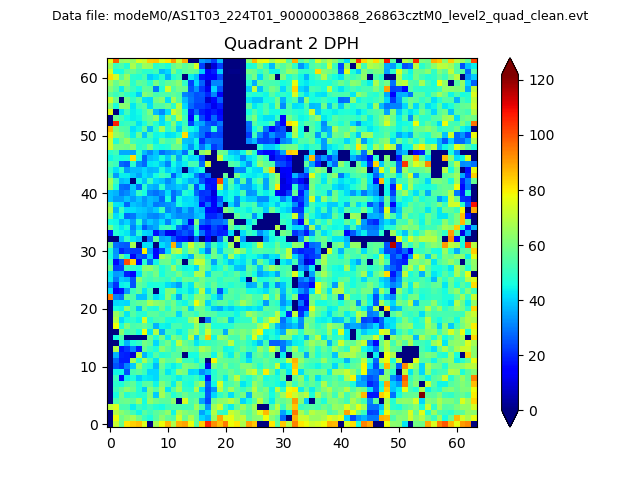
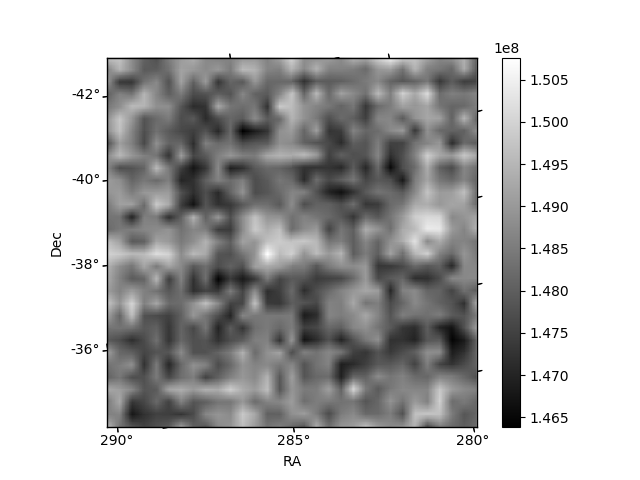
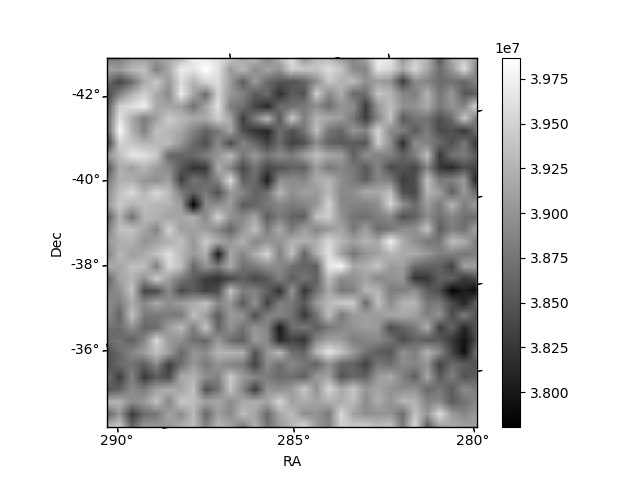
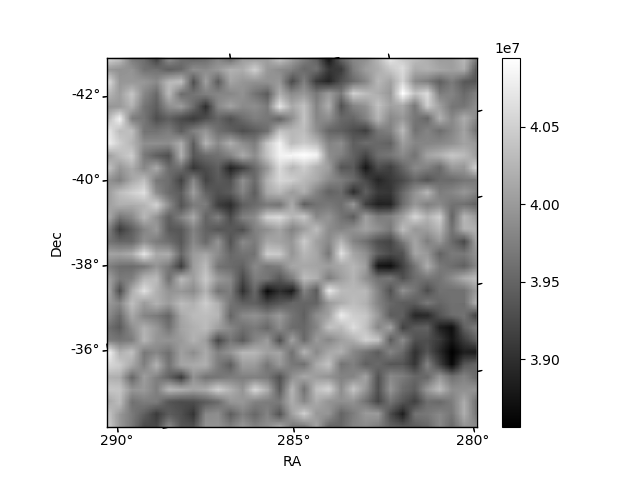
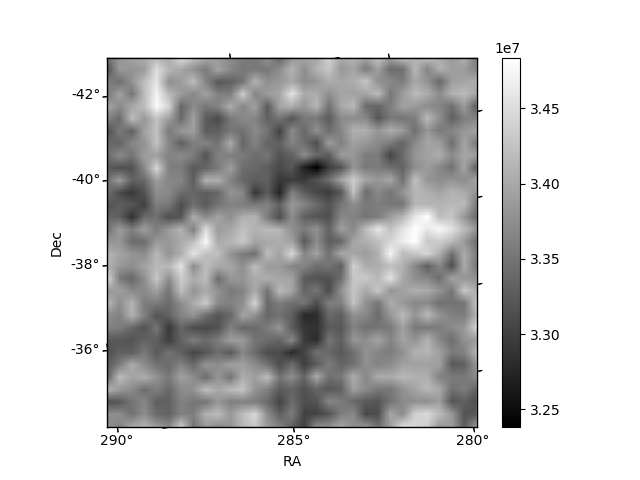
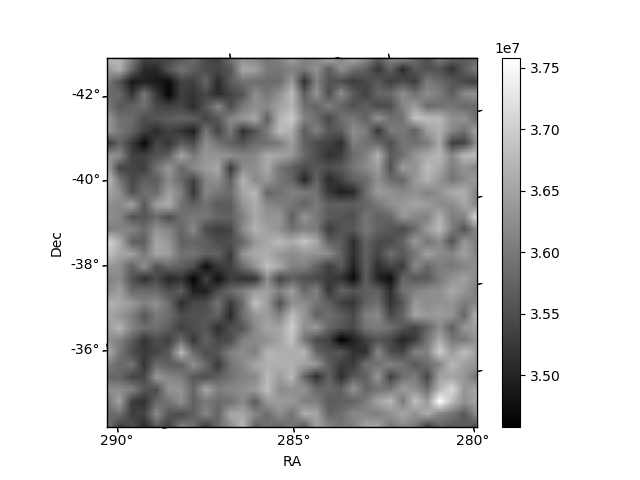
Histogram calculated using DETX and DETY for each event in the final _common_clean file
| Quadrant A | 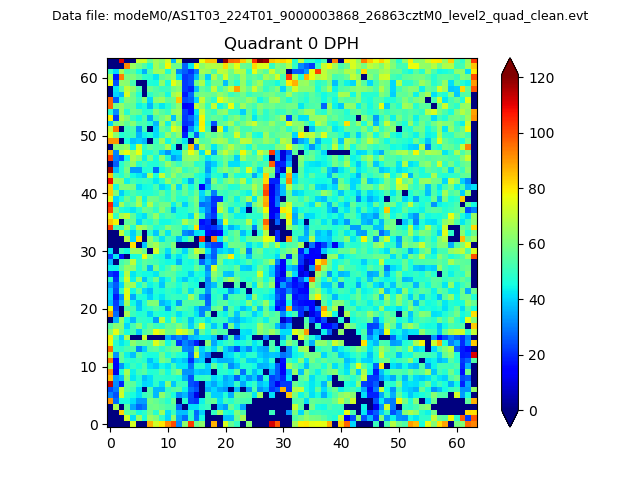 |
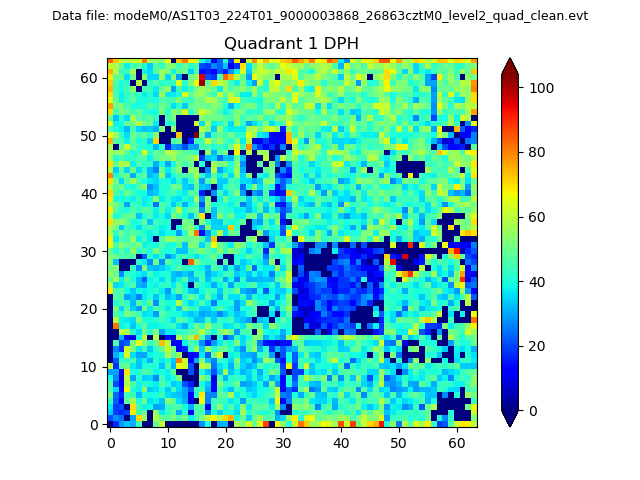 |
Quadrant B |
|---|---|---|---|
| Quadrant D | 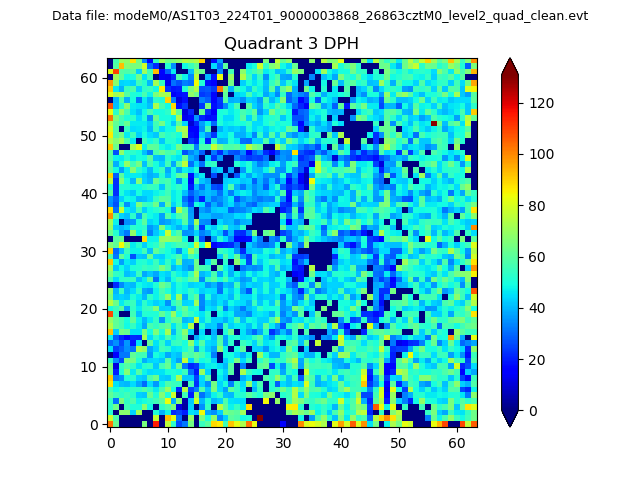 |
 |
Quadrant C |
| Plot type | Count rate plots | Images |
|---|---|---|
| Comparison with Poisson distribution Blue bars denote a histogram of data divided into 1 sec bins. Red curve is a Poisson curve with rate = median count rate of data. |
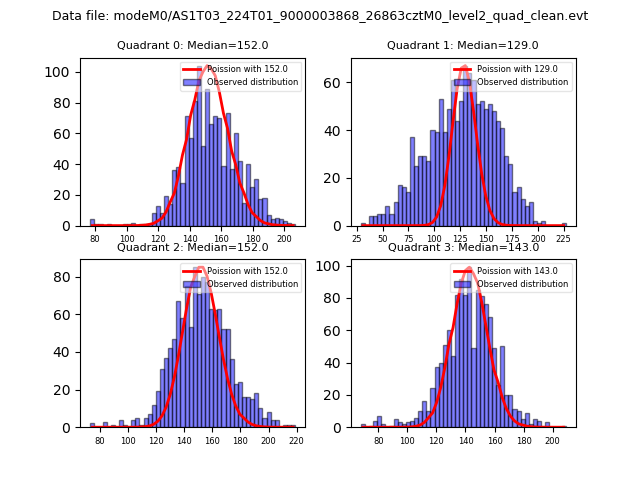 |
 |
| Quadrant-wise count rates Data is divided into 100 sec bins |
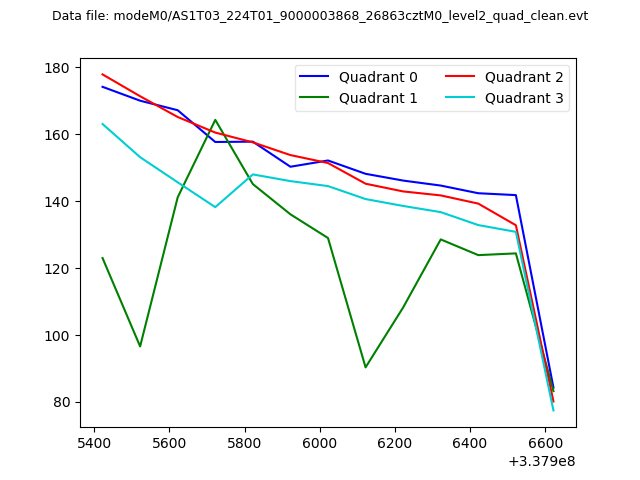 |
|
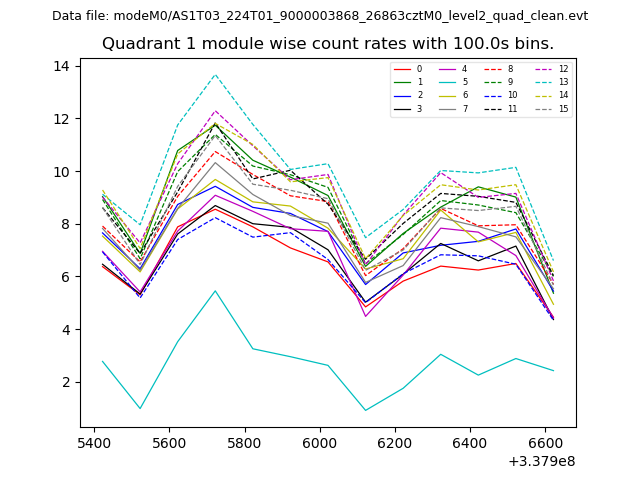
| Module-wise count rates for Quadrant A Data is divided into 100 sec bins |
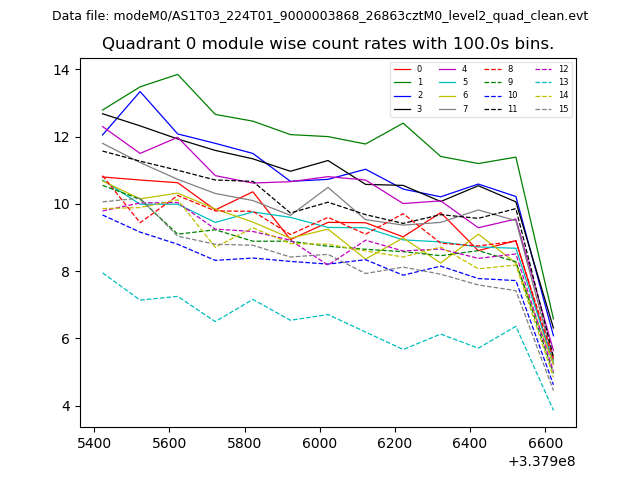 |
 |
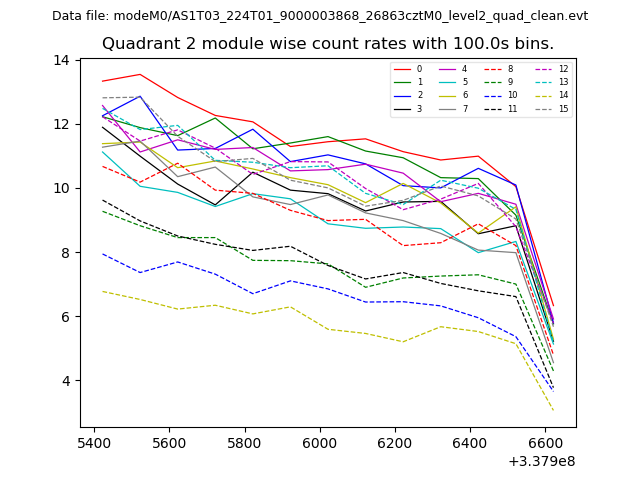
| Module-wise count rates for Quadrant B Data is divided into 100 sec bins |
 |
 |
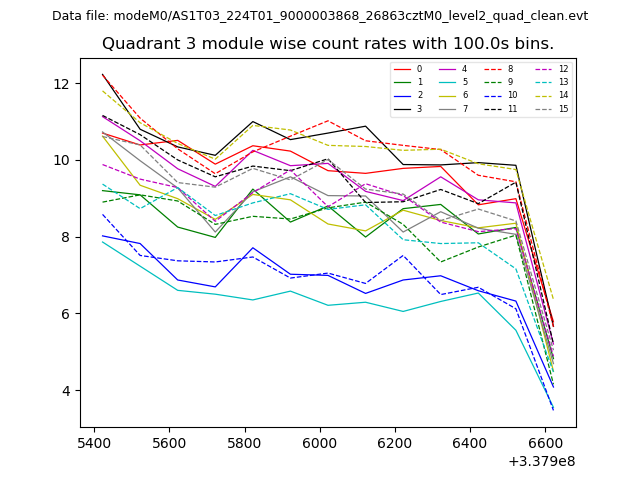
| Module-wise count rates for Quadrant C Data is divided into 100 sec bins |
 |
 |
| Module-wise count rates for Quadrant D Data is divided into 100 sec bins |
 |
 |
| Parameter | Plot |
|---|---|
| CZT HV Monitor | 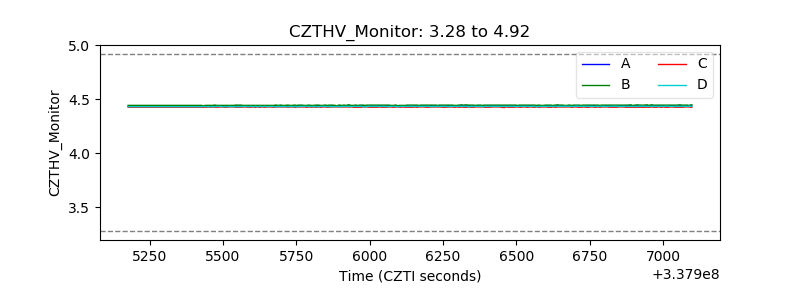 |
| D_VDD | 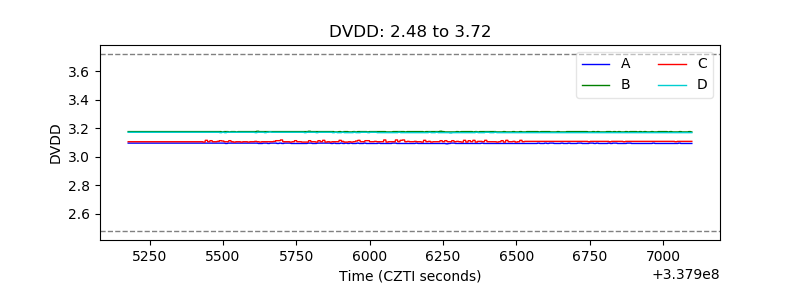 |
| Temperature 1 | 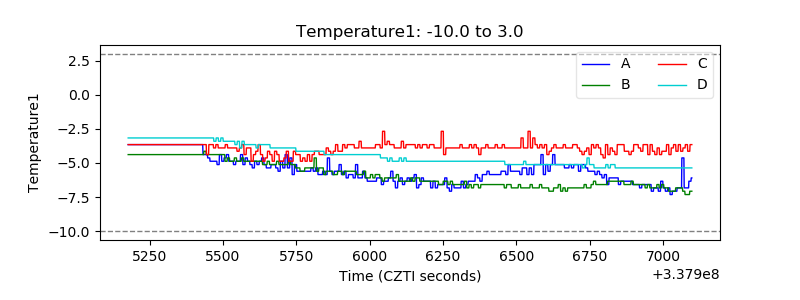 |
| Veto HV Monitor | 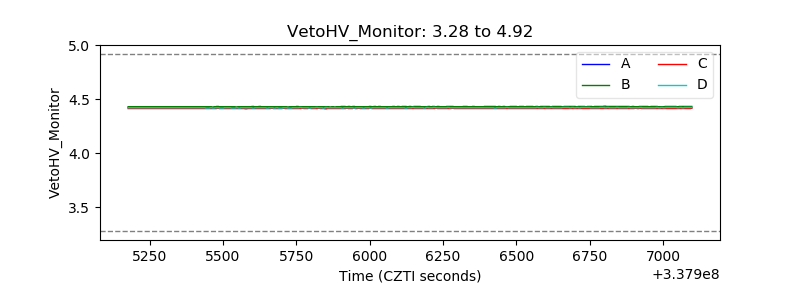 |
| Veto LLD | 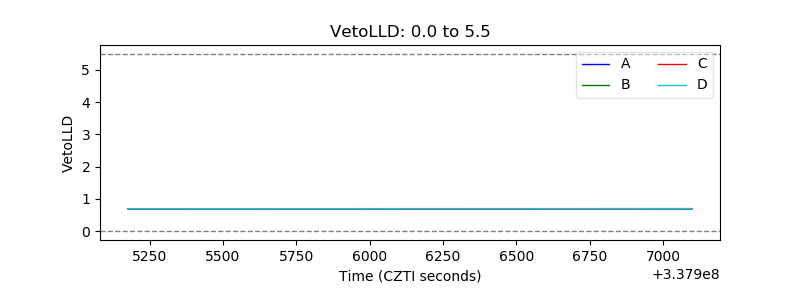 |
| Alpha Counter | 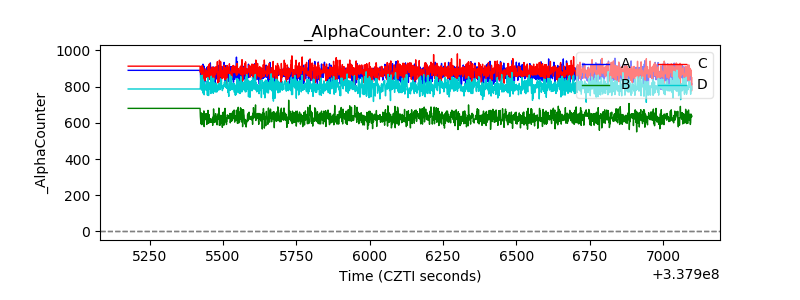 |
| _CPM_Rate |  |
| CZT Counter | 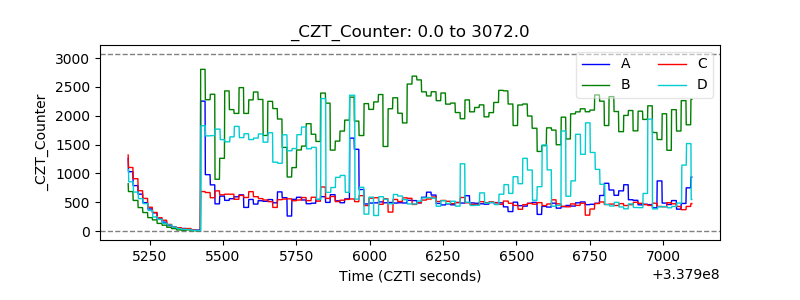 |
| +2.5 Volts monitor | 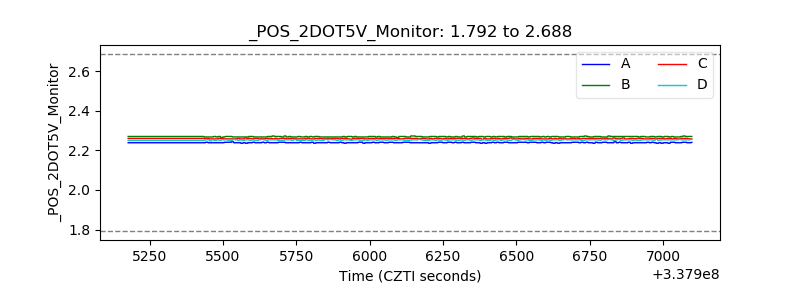 |
| +5 Volts monitor | 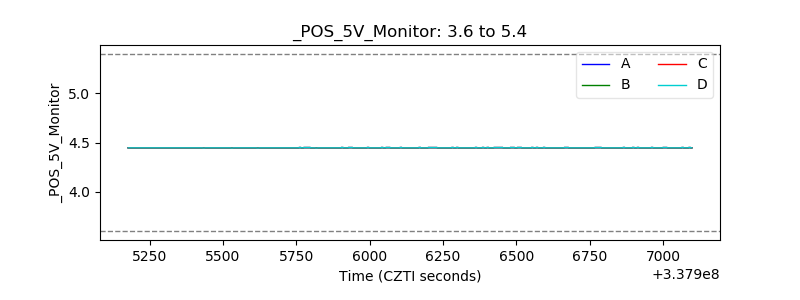 |
| _ROLL_ROT | 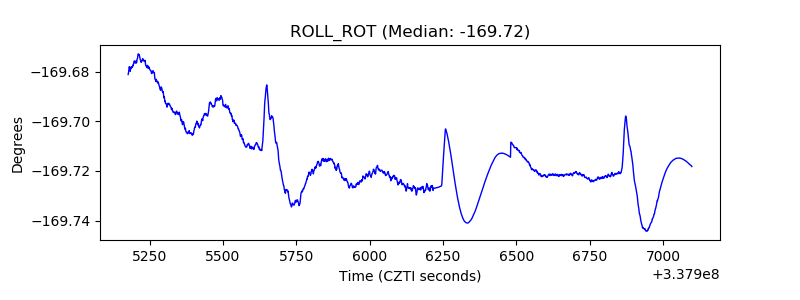 |
| _Roll_DEC | 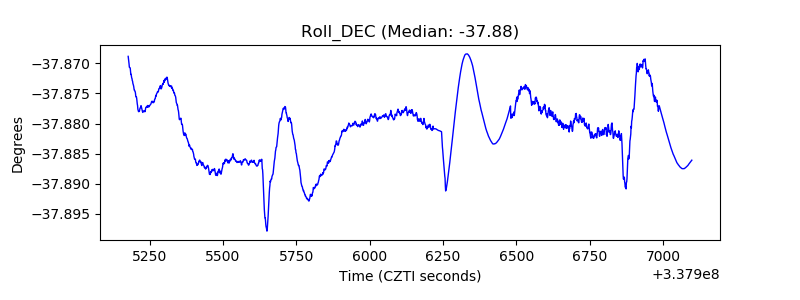 |
| _Roll_RA | 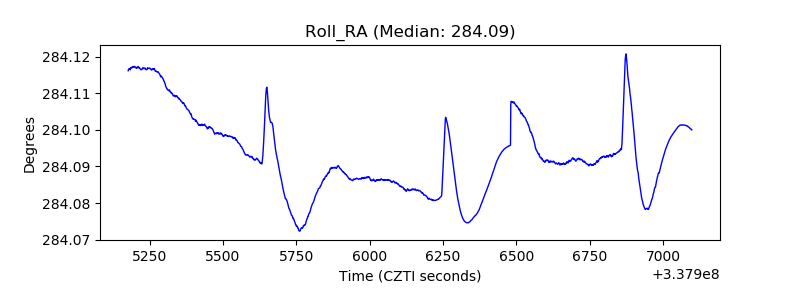 |
| Veto Counter | 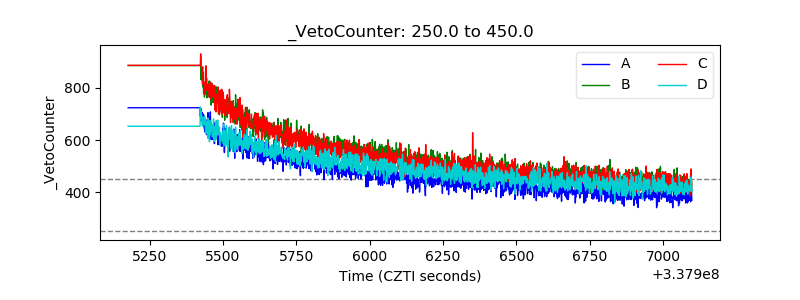 |