| Param | Original file | Final file |
|---|---|---|
| Filename | modeM0/AS1A09_145T01_9000003870cztM0_level2.fits | modeM0/AS1A09_145T01_9000003870cztM0_level2_quad_clean.evt |
| Size (bytes) | 125,112,960 | 48,551,040 |
| Size | 119.3 MB | 46.3 MB |
| Events in quadrant A | 807,208 | 191,104 |
| Events in quadrant B | 736,722 | 125,023 |
| Events in quadrant C | 786,736 | 185,744 |
| Events in quadrant D | 658,472 | 167,493 |
| Mode SS | |||
|---|---|---|---|
| Quadrant | BADHDUFLAG | Total packets | Discarded packets |
| A | 0 | 236 | 0 |
| B | 0 | 236 | 0 |
| C | 0 | 236 | 0 |
| D | 0 | 236 | 0 |
| Mode M9 | |||
|---|---|---|---|
| Quadrant | BADHDUFLAG | Total packets | Discarded packets |
| A | 0 | 38 | 0 |
| B | 0 | 38 | 0 |
| C | 0 | 38 | 0 |
| D | 0 | 38 | 0 |
| Mode M0 | |||
|---|---|---|---|
| Quadrant | BADHDUFLAG | Total packets | Discarded packets |
| A | 0 | 26967 | 0 |
| B | 0 | 35417 | 0 |
| C | 0 | 24975 | 0 |
| D | 0 | 32520 | 0 |
| Quadrant | Total seconds | Saturated seconds | Saturation percentage |
|---|---|---|---|
| A | 11557 | 179 | 1.548845% |
| B | 11557 | 1873 | 16.206628% |
| C | 11557 | 155 | 1.341179% |
| D | 11557 | 873 | 7.553863% |
Noise dominated data is calculated using 1-second bins in cleaned event files. If a bin has >2000 counts, and if more than 50% of those come from <1% of pixels, then it is considered to be noise-dominated and hence unusable.
| Quadrant | # 1 sec bins | Bins with >0 counts | Bins with >2000 counts | High rate bins dominated by noise | Noise dominated (total time) | Noise dominated (detector-on time) | Marked lightcurve |
|---|---|---|---|---|---|---|---|
| A | 14167 | 11557 | 0 | 0 | 0.00% | 0.00% |  |
| B | 14166 | 11555 | 0 | 0 | 0.00% | 0.00% | 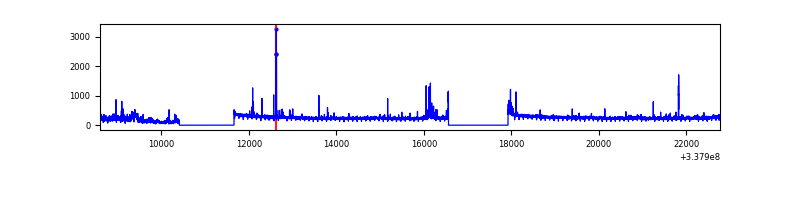 |
| C | 14167 | 11557 | 0 | 0 | 0.00% | 0.00% | 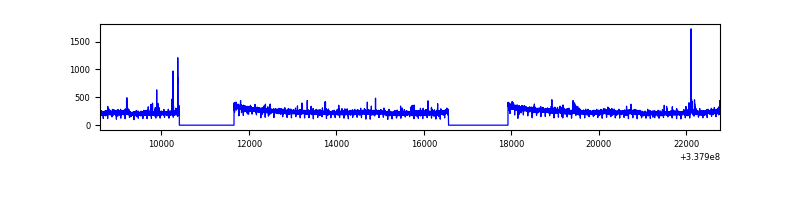 |
| D | 14167 | 11525 | 0 | 0 | 0.00% | 0.00% |  |
Top three noisy pixels from each quadrant. If the there are fewer than three noisy pixels in the level2.evt file, extra rows are filled as -1
| Pixel properties | Quadrant properties | ||||||
|---|---|---|---|---|---|---|---|
| Quadrant | DetID | PixID | Counts | Sigma | Mean | Median | Sigma |
| A | 0 | 29 | 665 | 8.68 | 210 | 199 | 53.7 |
| A | 7 | 110 | 617 | 7.78 | 210 | 199 | 53.7 |
| A | 9 | 19 | 596 | 7.39 | 210 | 199 | 53.7 |
| B | 2 | 9 | 573 | 9.73 | 195 | 188 | 39.6 |
| B | 2 | 8 | 511 | 8.16 | 195 | 188 | 39.6 |
| B | 3 | 17 | 486 | 7.53 | 195 | 188 | 39.6 |
| C | 1 | 81 | 632 | 8.07 | 207 | 195 | 54.1 |
| C | 1 | 80 | 593 | 7.35 | 207 | 195 | 54.1 |
| C | 3 | 126 | 547 | 6.5 | 207 | 195 | 54.1 |
| D | 15 | 46 | 508 | 6.52 | 188 | 173 | 51.4 |
| D | 3 | 14 | 471 | 5.8 | 188 | 173 | 51.4 |
| D | 10 | 189 | 461 | 5.6 | 188 | 173 | 51.4 |
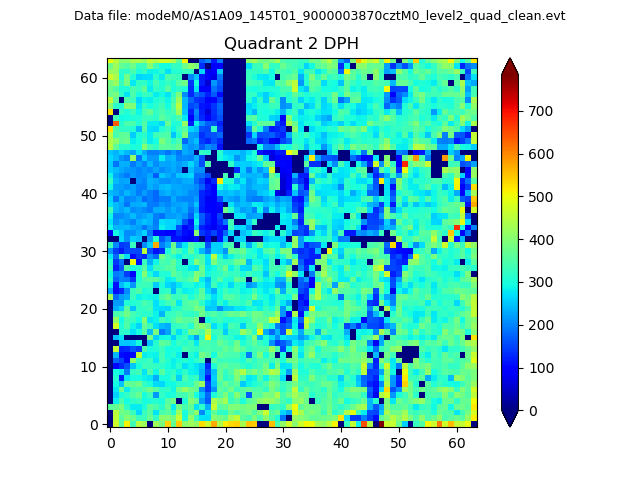
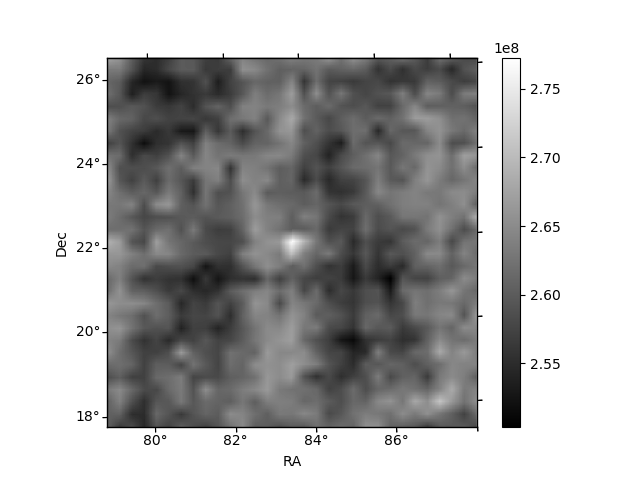
Histogram calculated using DETX and DETY for each event in the final _common_clean file
| Quadrant A | 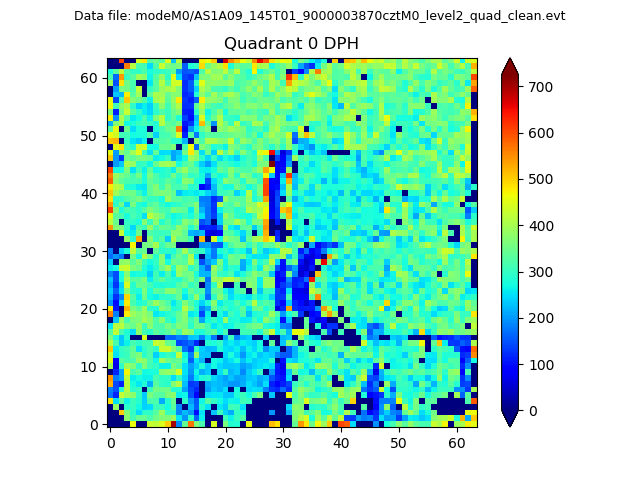 |
 |
Quadrant B |
|---|---|---|---|
| Quadrant D | 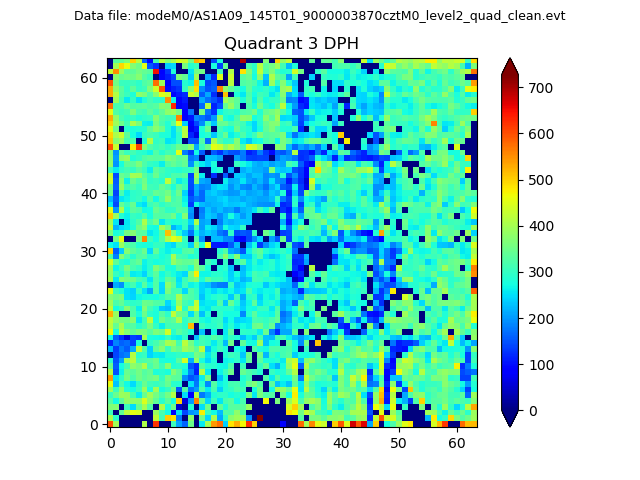 |
 |
Quadrant C |
| Plot type | Count rate plots | Images |
|---|---|---|
| Comparison with Poisson distribution Blue bars denote a histogram of data divided into 1 sec bins. Red curve is a Poisson curve with rate = median count rate of data. |
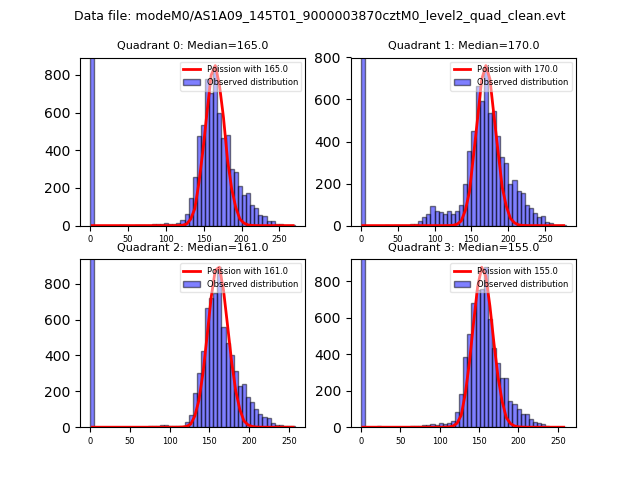 |
 |
| Quadrant-wise count rates Data is divided into 100 sec bins |
 |
|
| Module-wise count rates for Quadrant A Data is divided into 100 sec bins |
 |
 |
| Module-wise count rates for Quadrant B Data is divided into 100 sec bins |
 |
 |
| Module-wise count rates for Quadrant C Data is divided into 100 sec bins |
 |
 |
| Module-wise count rates for Quadrant D Data is divided into 100 sec bins |
 |
 |
| Parameter | Plot |
|---|---|
| CZT HV Monitor |  |
| D_VDD | 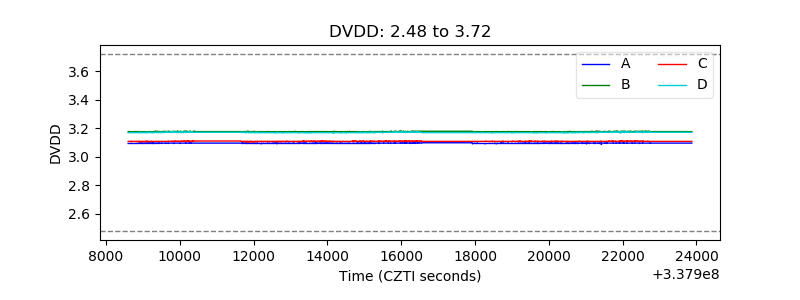 |
| Temperature 1 |  |
| Veto HV Monitor |  |
| Veto LLD |  |
| Alpha Counter |  |
| _CPM_Rate | 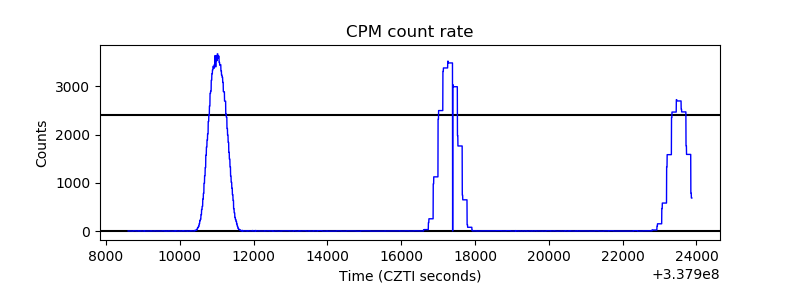 |
| CZT Counter |  |
| +2.5 Volts monitor |  |
| +5 Volts monitor | 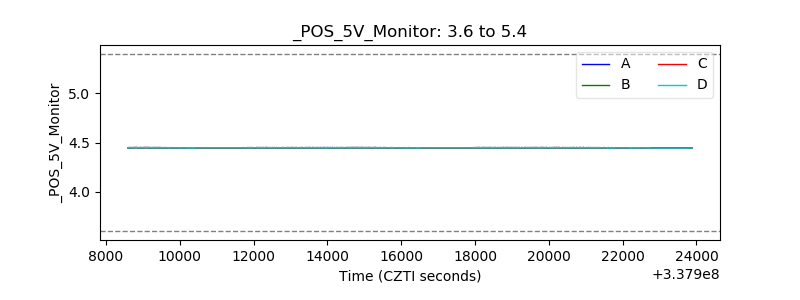 |
| _ROLL_ROT | 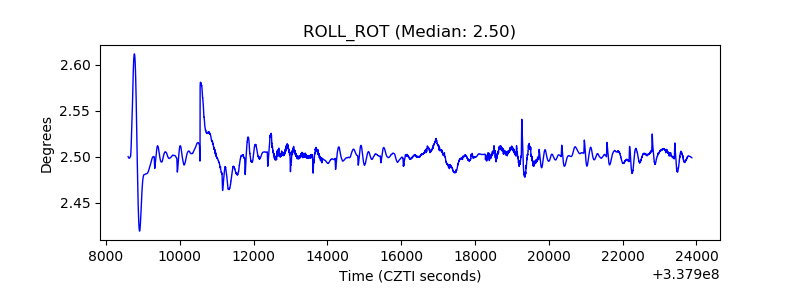 |
| _Roll_DEC | 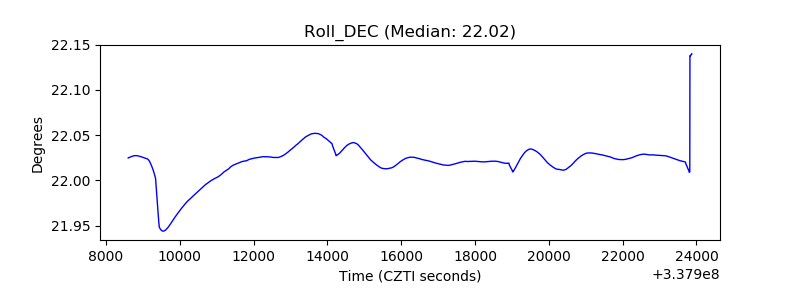 |
| _Roll_RA |  |
| Veto Counter | 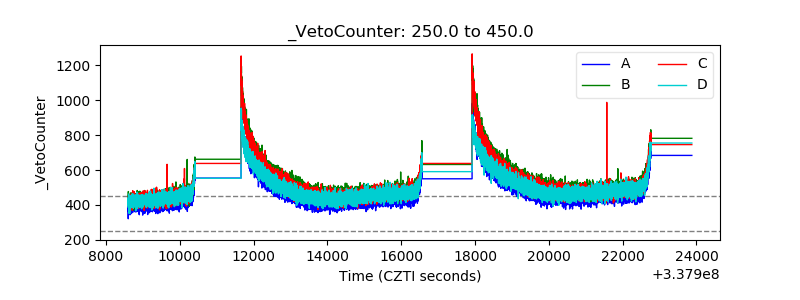 |