| Param | Original file | Final file |
|---|---|---|
| Filename | modeM0/AS1A09_145T01_9000003870_26863cztM0_level2.evt | modeM0/AS1A09_145T01_9000003870_26863cztM0_level2_quad_clean.evt |
| Size (bytes) | 360,305,280 | 48,090,240 |
| Size | 343.6 MB | 45.9 MB |
| Events in quadrant A | 1,899,219 | 318,463 |
| Events in quadrant B | 4,998,683 | 307,460 |
| Events in quadrant C | 1,685,148 | 313,538 |
| Events in quadrant D | 2,120,702 | 299,168 |
| Mode M9 | |||
|---|---|---|---|
| Quadrant | BADHDUFLAG | Total packets | Discarded packets |
| A | 0 | 12 | 0 |
| B | 0 | 12 | 0 |
| C | 0 | 12 | 0 |
| D | 0 | 12 | 0 |
| Mode M0 | |||
|---|---|---|---|
| Quadrant | BADHDUFLAG | Total packets | Discarded packets |
| A | 0 | 7566 | 0 |
| B | 0 | 16948 | 0 |
| C | 0 | 6830 | 0 |
| D | 0 | 8277 | 0 |
| Quadrant | Total seconds | Saturated seconds | Saturation percentage |
|---|---|---|---|
| A | 3045 | 43 | 1.412151% |
| B | 3045 | 1779 | 58.423645% |
| C | 3045 | 48 | 1.576355% |
| D | 3045 | 117 | 3.842365% |
Noise dominated data is calculated using 1-second bins in cleaned event files. If a bin has >2000 counts, and if more than 50% of those come from <1% of pixels, then it is considered to be noise-dominated and hence unusable.
| Quadrant | # 1 sec bins | Bins with >0 counts | Bins with >2000 counts | High rate bins dominated by noise | Noise dominated (total time) | Noise dominated (detector-on time) | Marked lightcurve |
|---|---|---|---|---|---|---|---|
| A | 4295 | 3046 | 10 | 10 | 0.23% | 0.33% | 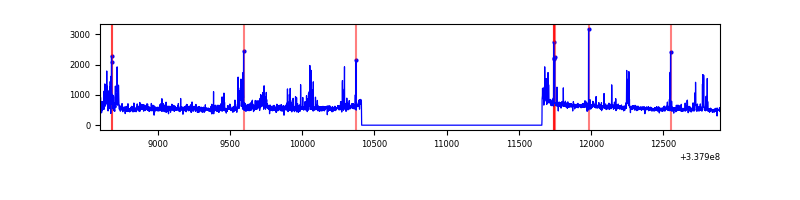 |
| B | 4295 | 3045 | 1607 | 1607 | 37.42% | 52.78% | 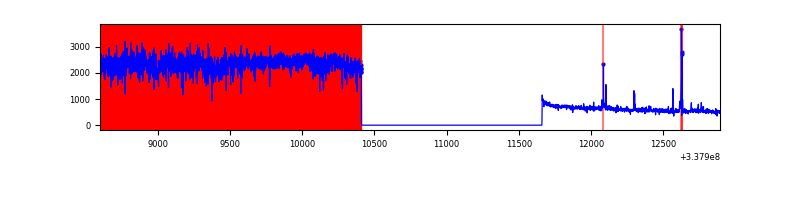 |
| C | 4295 | 3046 | 0 | 0 | 0.00% | 0.00% | 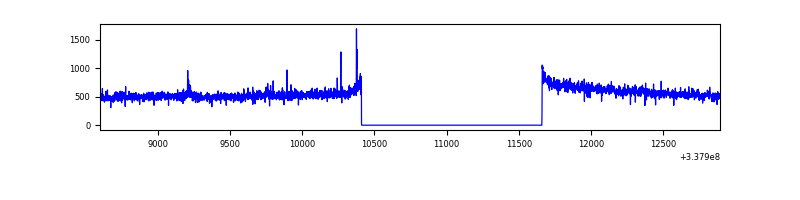 |
| D | 4295 | 3046 | 70 | 70 | 1.63% | 2.30% | 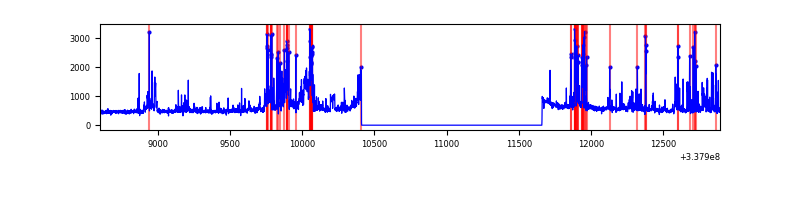 |
Top three noisy pixels from each quadrant. If the there are fewer than three noisy pixels in the level2.evt file, extra rows are filled as -1
| Pixel properties | Quadrant properties | ||||||
|---|---|---|---|---|---|---|---|
| Quadrant | DetID | PixID | Counts | Sigma | Mean | Median | Sigma |
| A | 0 | 13 | 256848 | 2957.01 | 426 | 419 | 86.7 |
| A | 13 | 254 | 4961 | 52.38 | 426 | 419 | 86.7 |
| A | 3 | 137 | 3825 | 39.28 | 426 | 419 | 86.7 |
| B | 5 | 31 | 1265534 | 19293.88 | 340 | 333 | 65.6 |
| B | 5 | 15 | 1219390 | 18590.2 | 340 | 333 | 65.6 |
| B | 5 | 14 | 1137740 | 17345.06 | 340 | 333 | 65.6 |
| C | 14 | 238 | 67499 | 689.08 | 411 | 414 | 97.4 |
| C | 2 | 16 | 6468 | 62.19 | 411 | 414 | 97.4 |
| C | 14 | 176 | 5510 | 52.34 | 411 | 414 | 97.4 |
| D | 7 | 80 | 231252 | 2396.61 | 406 | 398 | 96.3 |
| D | 2 | 250 | 146509 | 1516.85 | 406 | 398 | 96.3 |
| D | 11 | 176 | 127570 | 1320.24 | 406 | 398 | 96.3 |
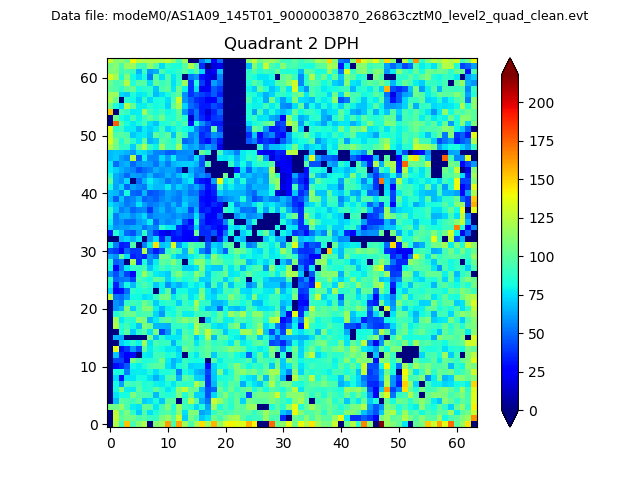
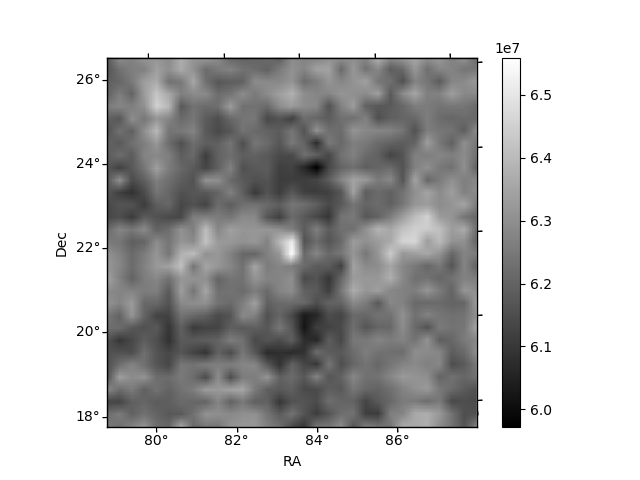
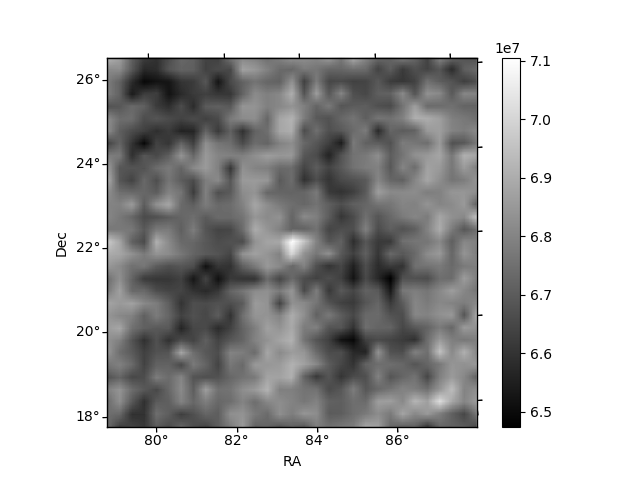
Histogram calculated using DETX and DETY for each event in the final _common_clean file
| Quadrant A | 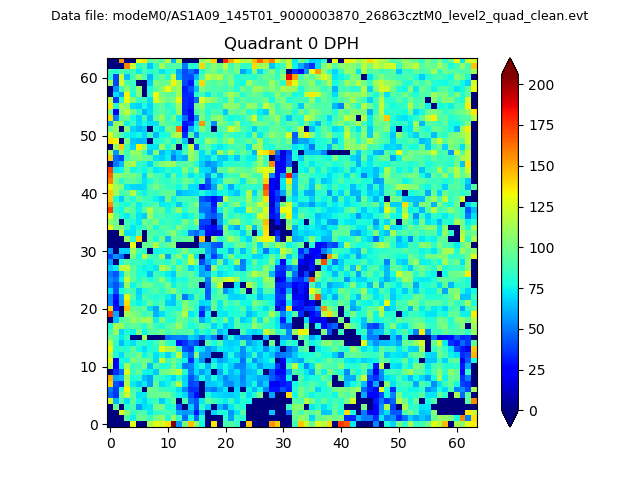 |
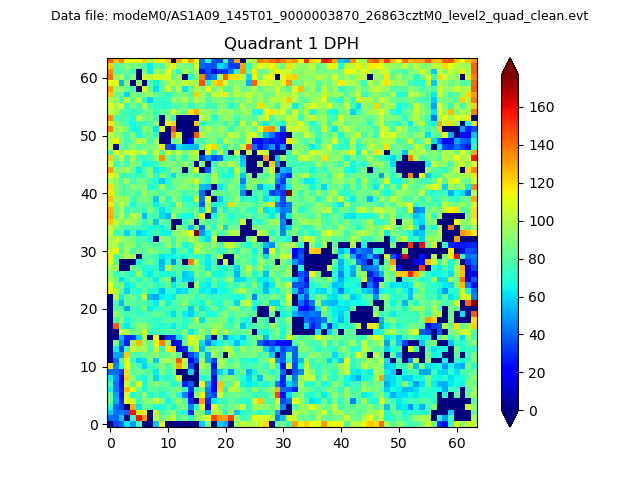 |
Quadrant B |
|---|---|---|---|
| Quadrant D | 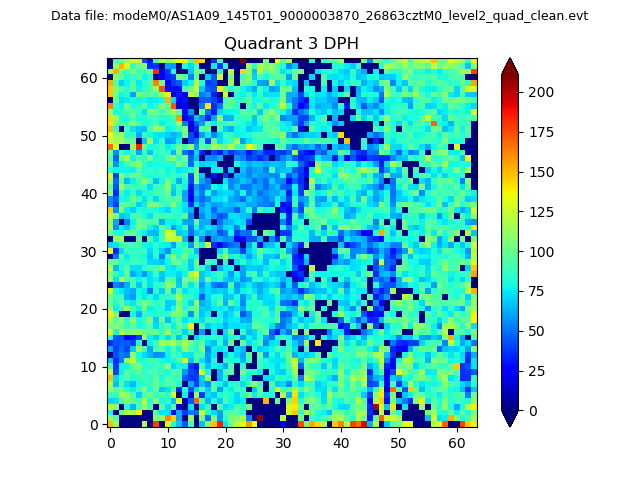 |
 |
Quadrant C |
| Plot type | Count rate plots | Images |
|---|---|---|
| Comparison with Poisson distribution Blue bars denote a histogram of data divided into 1 sec bins. Red curve is a Poisson curve with rate = median count rate of data. |
 |
 |
| Quadrant-wise count rates Data is divided into 100 sec bins |
 |
|
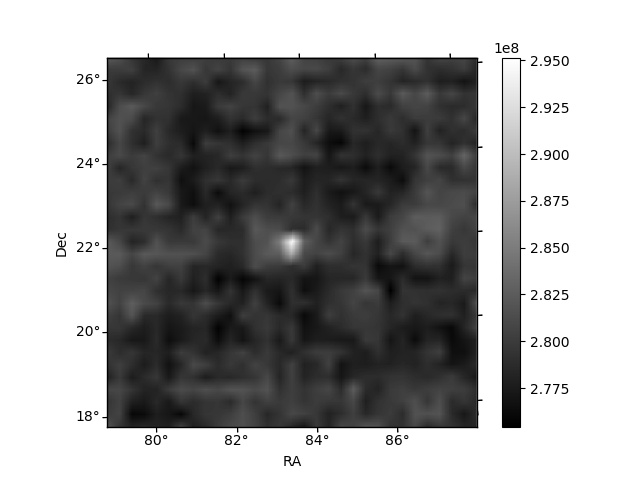
| Module-wise count rates for Quadrant A Data is divided into 100 sec bins |
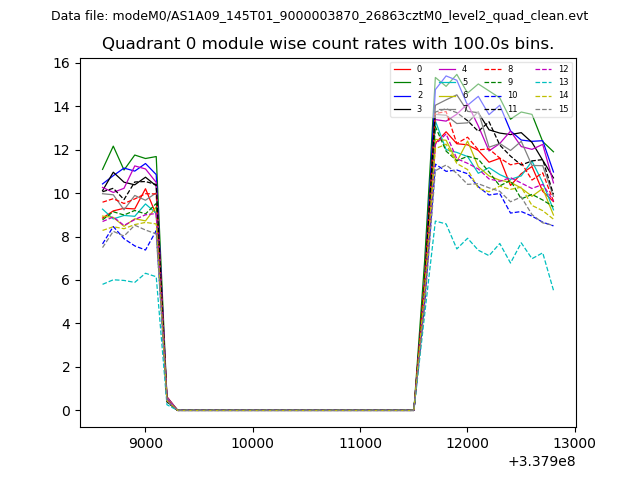 |
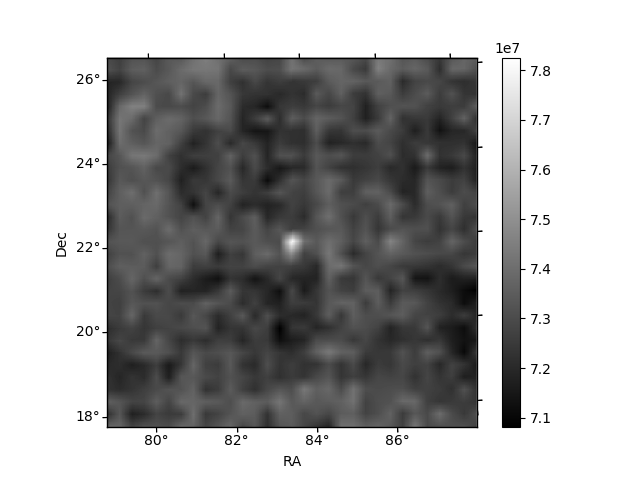 |
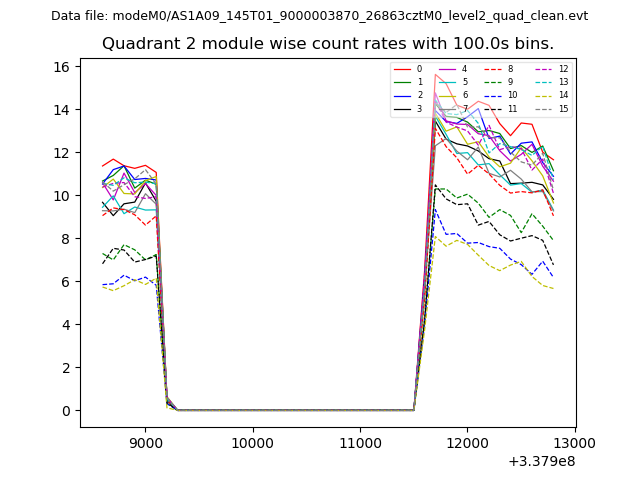
| Module-wise count rates for Quadrant B Data is divided into 100 sec bins |
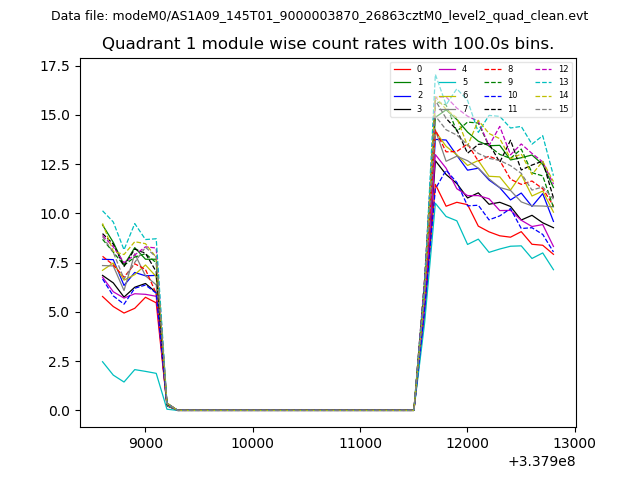 |
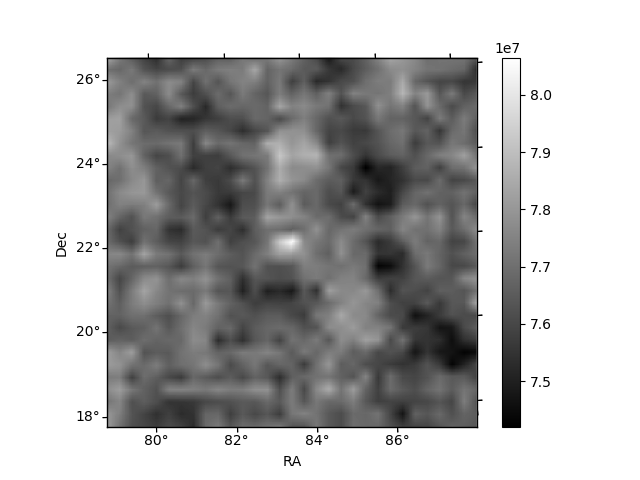 |
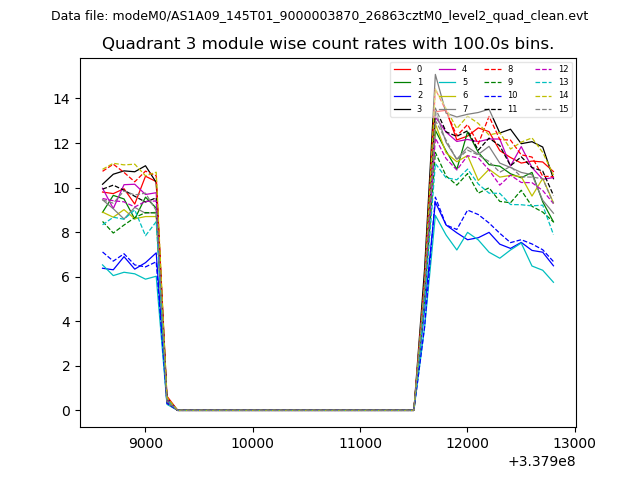
| Module-wise count rates for Quadrant C Data is divided into 100 sec bins |
 |
 |
| Module-wise count rates for Quadrant D Data is divided into 100 sec bins |
 |
 |
| Parameter | Plot |
|---|---|
| CZT HV Monitor | 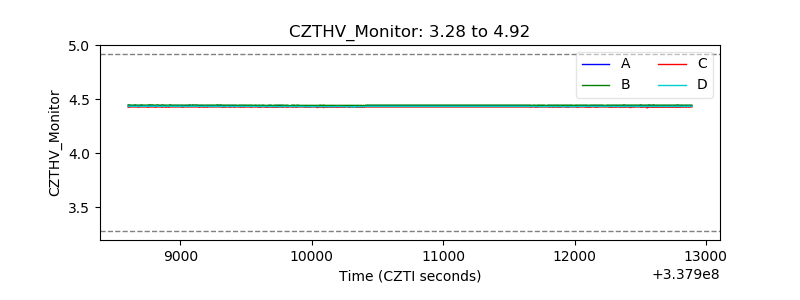 |
| D_VDD | 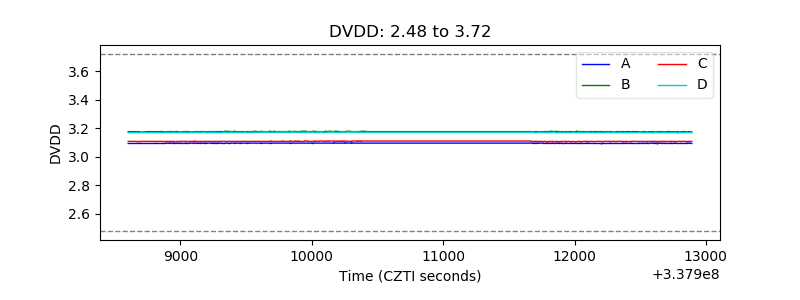 |
| Temperature 1 | 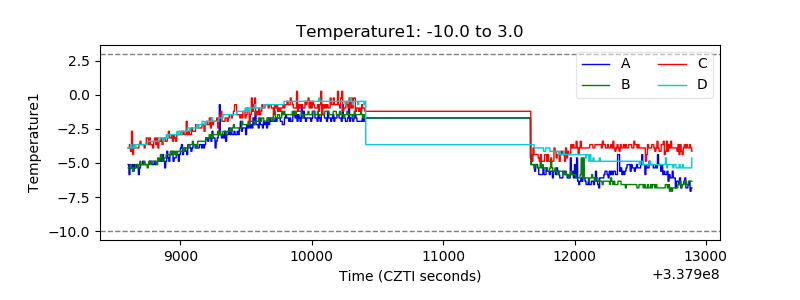 |
| Veto HV Monitor | 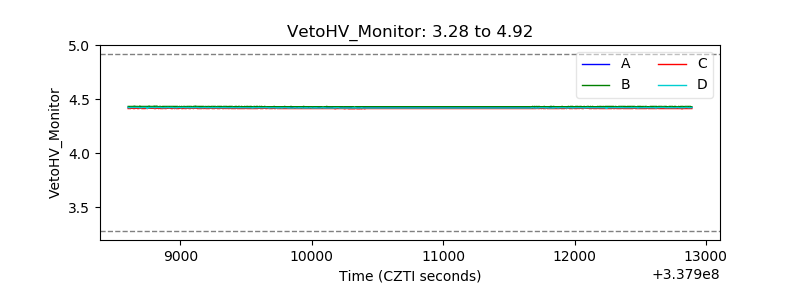 |
| Veto LLD | 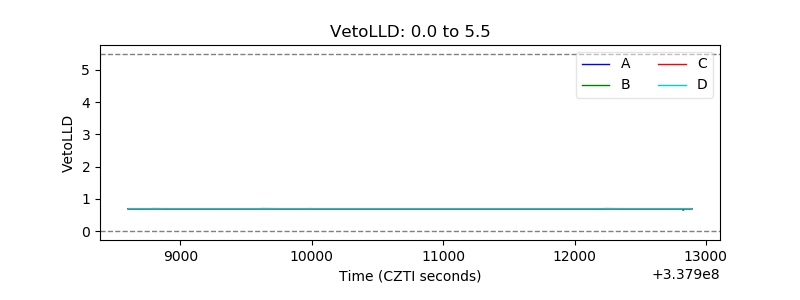 |
| Alpha Counter |  |
| _CPM_Rate | 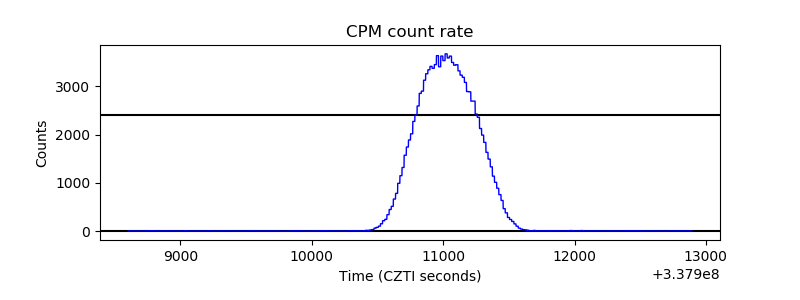 |
| CZT Counter | 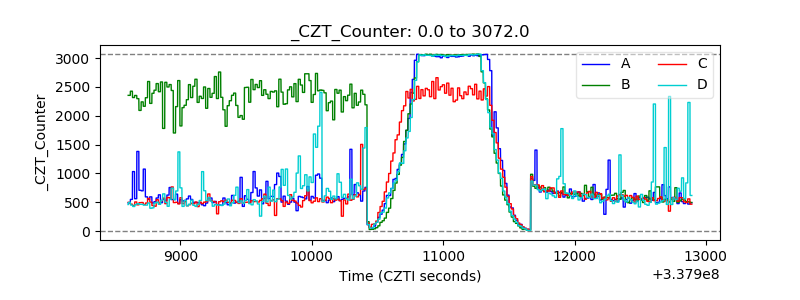 |
| +2.5 Volts monitor |  |
| +5 Volts monitor |  |
| _ROLL_ROT | 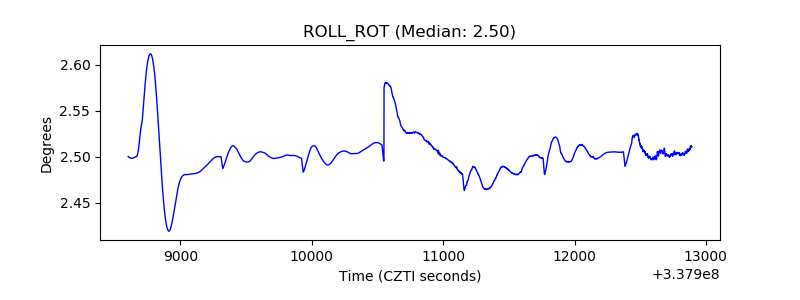 |
| _Roll_DEC | 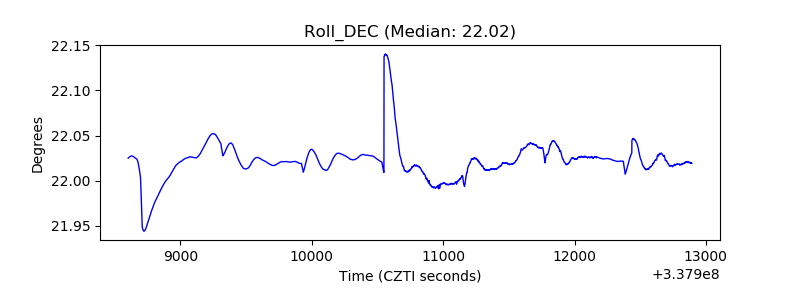 |
| _Roll_RA | 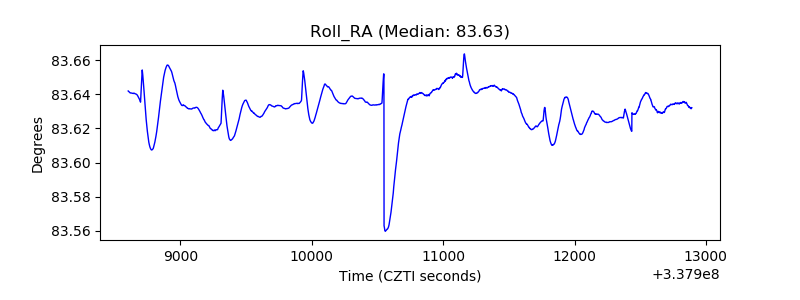 |
| Veto Counter | 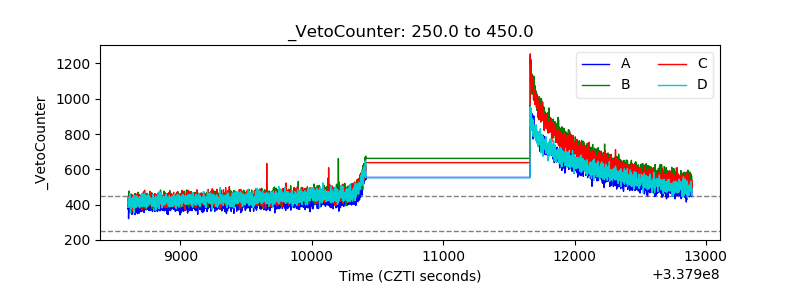 |