| Param | Original file | Final file |
|---|---|---|
| Filename | modeM0/AS1A09_145T01_9000003870_26864cztM0_level2.evt | modeM0/AS1A09_145T01_9000003870_26864cztM0_level2_quad_clean.evt |
| Size (bytes) | 508,466,880 | 119,626,560 |
| Size | 484.9 MB | 114.1 MB |
| Events in quadrant A | 3,648,363 | 809,973 |
| Events in quadrant B | 3,462,668 | 844,656 |
| Events in quadrant C | 3,329,863 | 787,649 |
| Events in quadrant D | 4,539,190 | 749,834 |
| Mode M9 | |||
|---|---|---|---|
| Quadrant | BADHDUFLAG | Total packets | Discarded packets |
| A | 0 | 16 | 0 |
| B | 0 | 17 | 0 |
| C | 0 | 17 | 0 |
| D | 0 | 17 | 0 |
| Mode M0 | |||
|---|---|---|---|
| Quadrant | BADHDUFLAG | Total packets | Discarded packets |
| A | 0 | 14650 | 0 |
| B | 0 | 14087 | 0 |
| C | 0 | 13668 | 0 |
| D | 0 | 17614 | 0 |
| Quadrant | Total seconds | Saturated seconds | Saturation percentage |
|---|---|---|---|
| A | 6174 | 101 | 1.635892% |
| B | 6174 | 51 | 0.826045% |
| C | 6174 | 71 | 1.149984% |
| D | 6174 | 492 | 7.968902% |
Noise dominated data is calculated using 1-second bins in cleaned event files. If a bin has >2000 counts, and if more than 50% of those come from <1% of pixels, then it is considered to be noise-dominated and hence unusable.
| Quadrant | # 1 sec bins | Bins with >0 counts | Bins with >2000 counts | High rate bins dominated by noise | Noise dominated (total time) | Noise dominated (detector-on time) | Marked lightcurve |
|---|---|---|---|---|---|---|---|
| A | 7534 | 6175 | 42 | 42 | 0.56% | 0.68% | 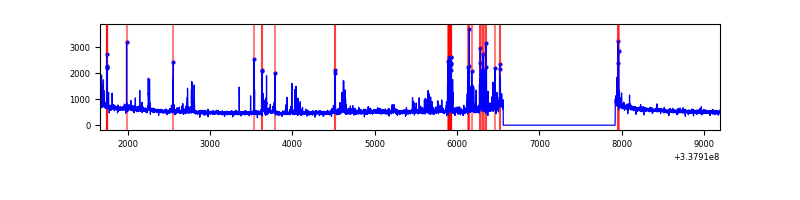 |
| B | 7534 | 6175 | 7 | 7 | 0.09% | 0.11% | 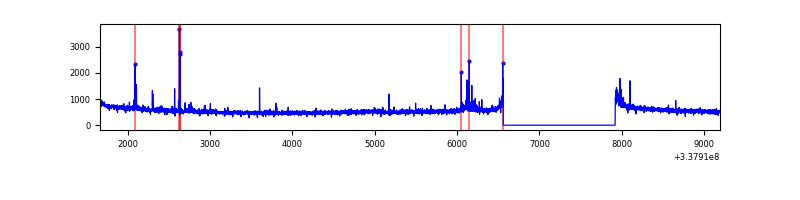 |
| C | 7534 | 6175 | 0 | 0 | 0.00% | 0.00% | 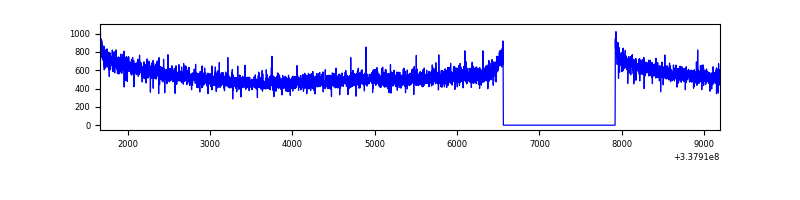 |
| D | 7534 | 6174 | 412 | 412 | 5.47% | 6.67% | 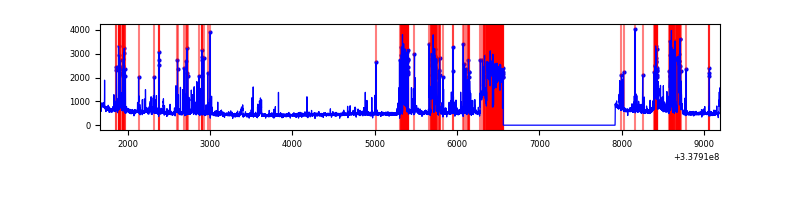 |
Top three noisy pixels from each quadrant. If the there are fewer than three noisy pixels in the level2.evt file, extra rows are filled as -1
| Pixel properties | Quadrant properties | ||||||
|---|---|---|---|---|---|---|---|
| Quadrant | DetID | PixID | Counts | Sigma | Mean | Median | Sigma |
| A | 0 | 13 | 397891 | 2361.34 | 843 | 831 | 168.2 |
| A | 13 | 254 | 10443 | 57.16 | 843 | 831 | 168.2 |
| A | 3 | 137 | 7259 | 38.23 | 843 | 831 | 168.2 |
| B | 10 | 246 | 52241 | 320.67 | 856 | 838 | 160.3 |
| B | 15 | 33 | 31287 | 189.95 | 856 | 838 | 160.3 |
| B | 0 | 190 | 25011 | 150.8 | 856 | 838 | 160.3 |
| C | 14 | 238 | 136020 | 709.92 | 818 | 828 | 190.4 |
| C | 2 | 16 | 7475 | 34.9 | 818 | 828 | 190.4 |
| C | 13 | 61 | 5554 | 24.82 | 818 | 828 | 190.4 |
| D | 7 | 80 | 1104965 | 6065.16 | 774 | 762 | 182.1 |
| D | 2 | 250 | 250292 | 1370.62 | 774 | 762 | 182.1 |
| D | 11 | 176 | 154453 | 844.19 | 774 | 762 | 182.1 |
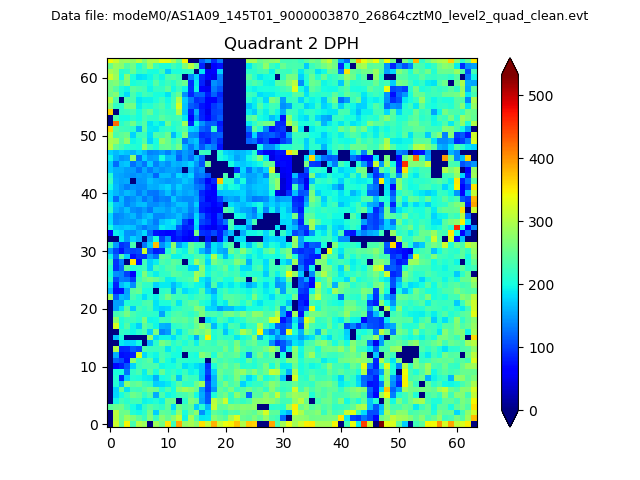
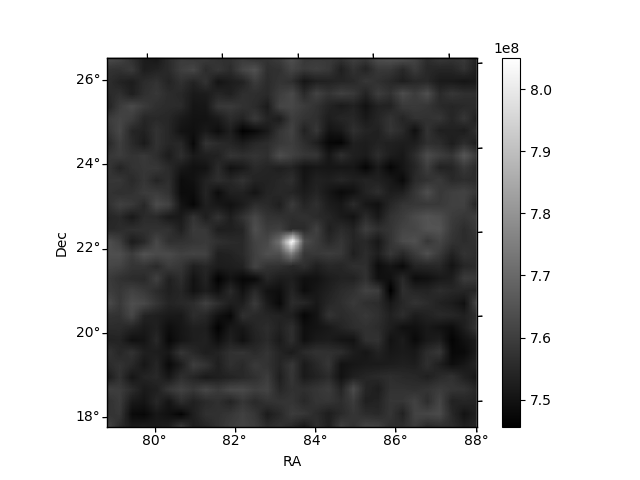
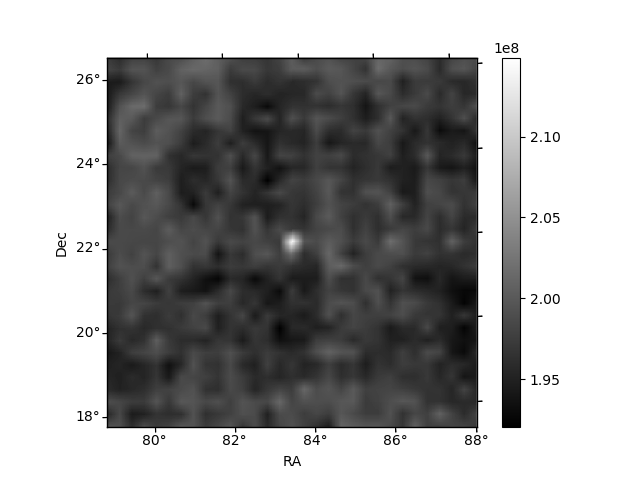
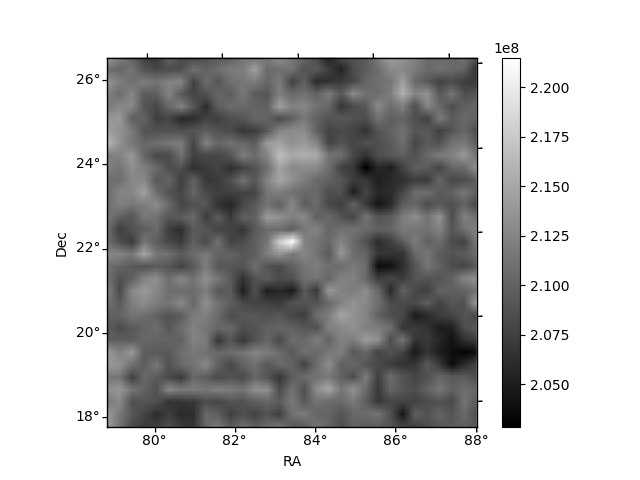
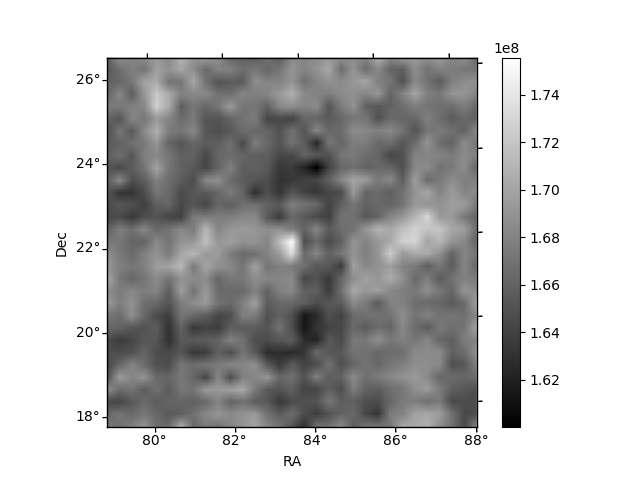
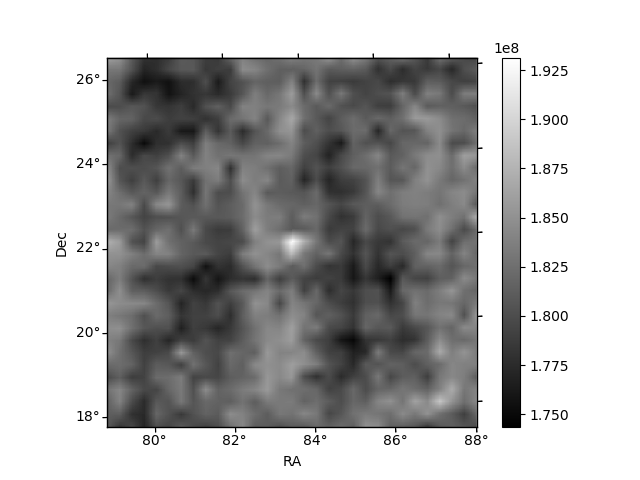
Histogram calculated using DETX and DETY for each event in the final _common_clean file
| Quadrant A | 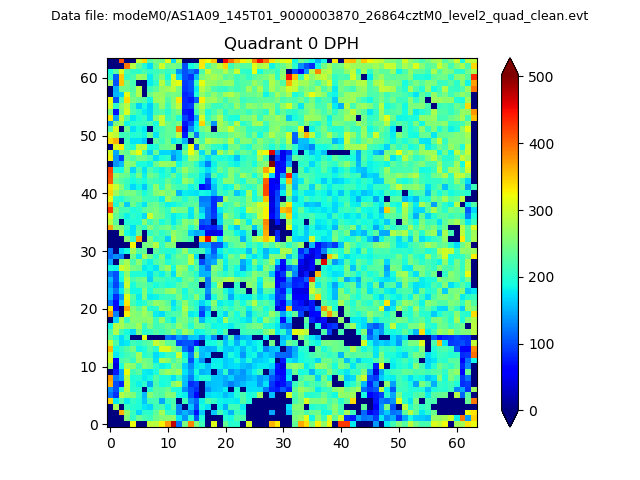 |
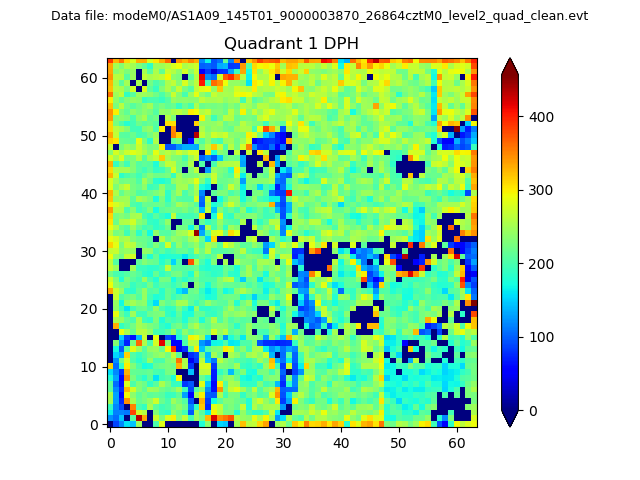 |
Quadrant B |
|---|---|---|---|
| Quadrant D | 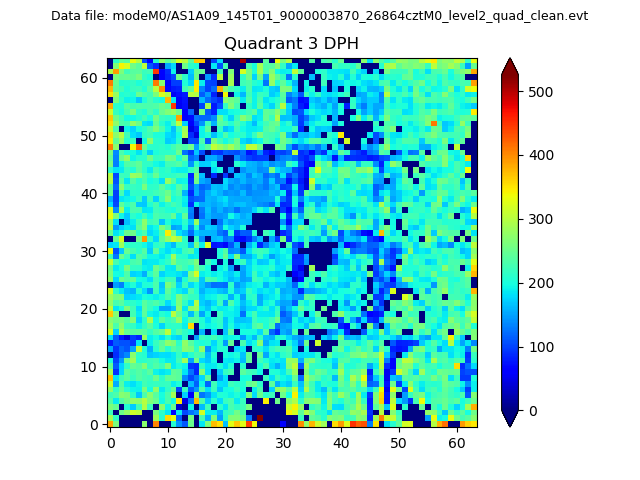 |
 |
Quadrant C |
| Plot type | Count rate plots | Images |
|---|---|---|
| Comparison with Poisson distribution Blue bars denote a histogram of data divided into 1 sec bins. Red curve is a Poisson curve with rate = median count rate of data. |
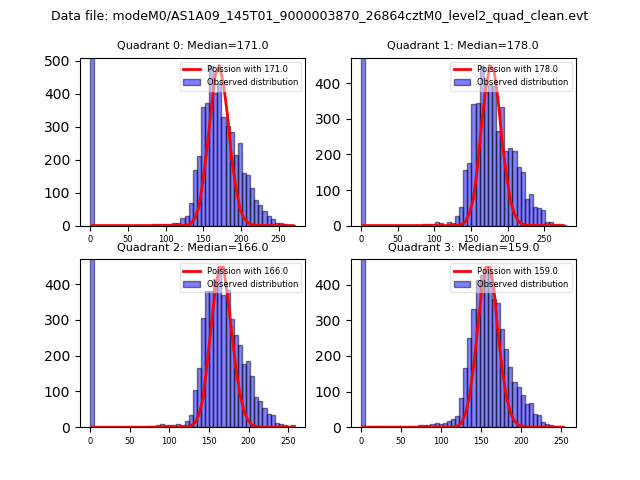 |
 |
| Quadrant-wise count rates Data is divided into 100 sec bins |
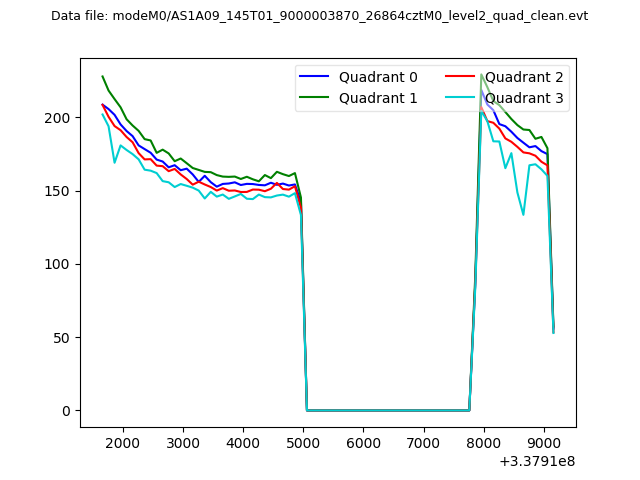 |
|
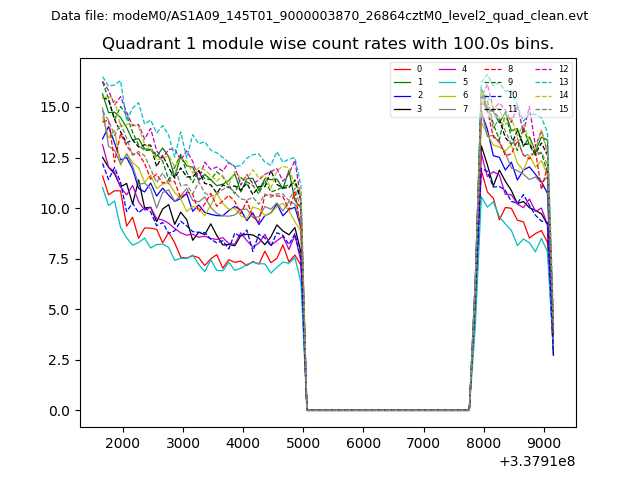
| Module-wise count rates for Quadrant A Data is divided into 100 sec bins |
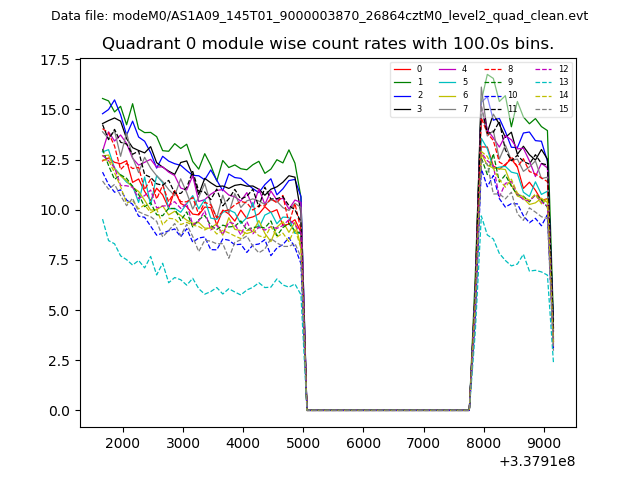 |
 |
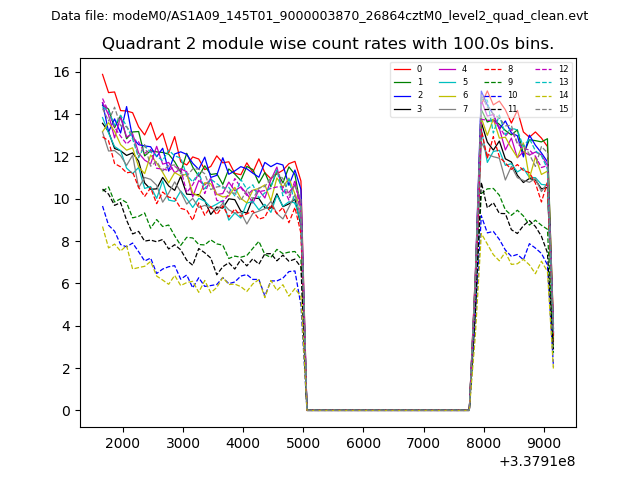
| Module-wise count rates for Quadrant B Data is divided into 100 sec bins |
 |
 |
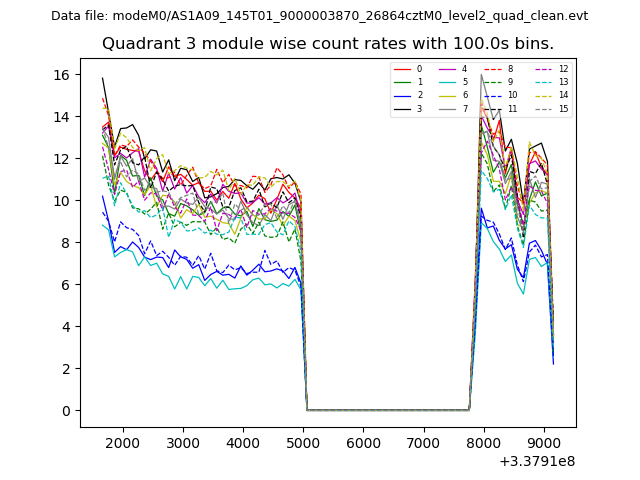
| Module-wise count rates for Quadrant C Data is divided into 100 sec bins |
 |
 |
| Module-wise count rates for Quadrant D Data is divided into 100 sec bins |
 |
 |
| Parameter | Plot |
|---|---|
| CZT HV Monitor | 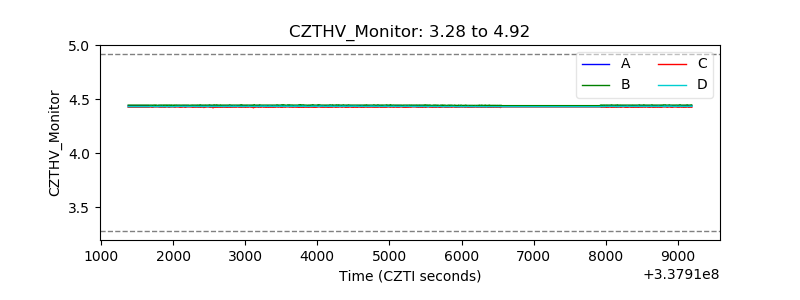 |
| D_VDD | 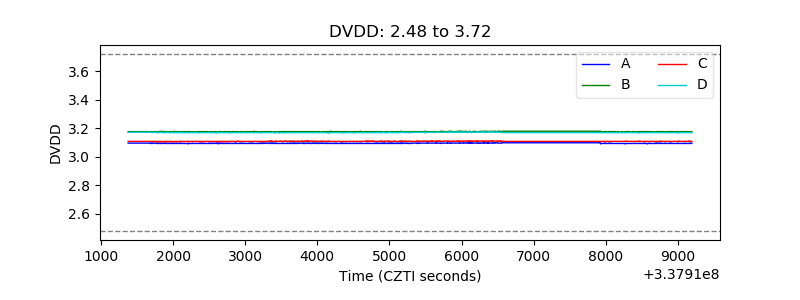 |
| Temperature 1 | 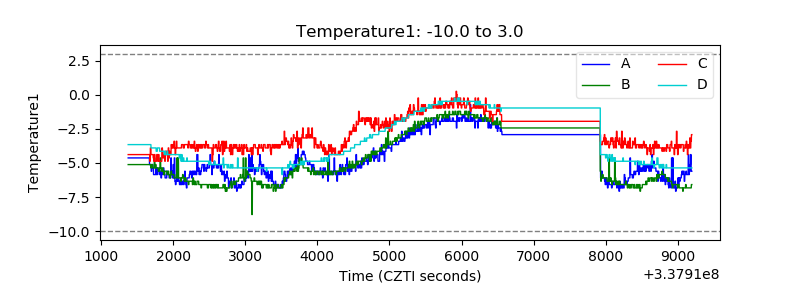 |
| Veto HV Monitor |  |
| Veto LLD | 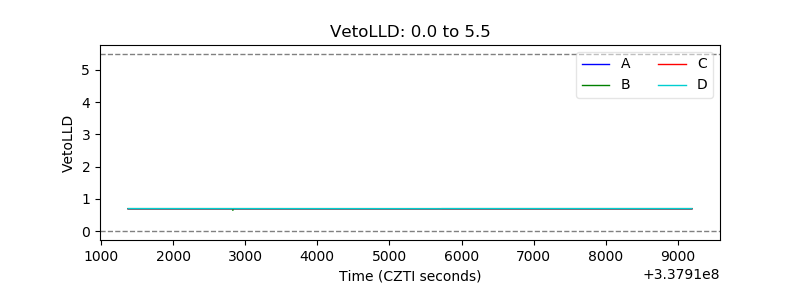 |
| Alpha Counter | 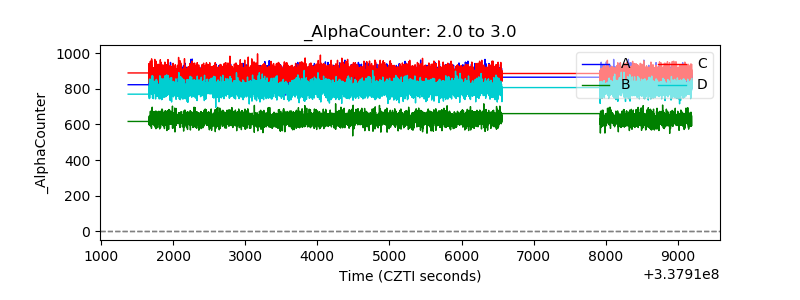 |
| _CPM_Rate | 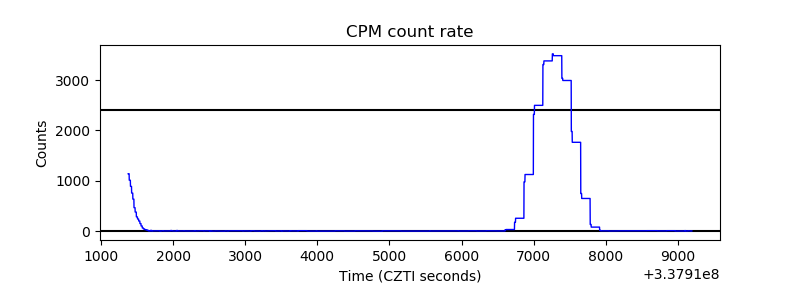 |
| CZT Counter | 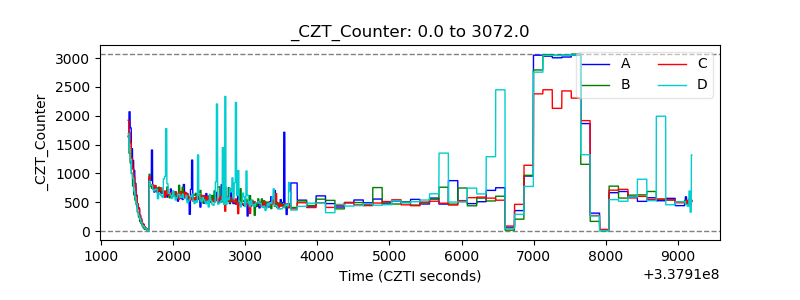 |
| +2.5 Volts monitor |  |
| +5 Volts monitor |  |
| _ROLL_ROT | 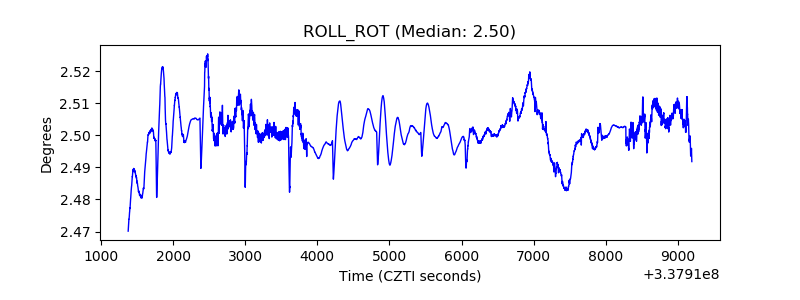 |
| _Roll_DEC | 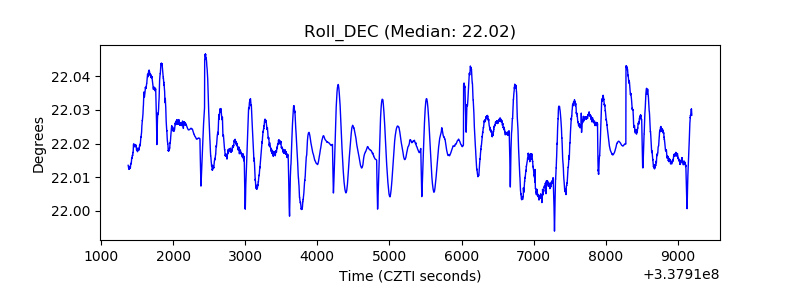 |
| _Roll_RA | 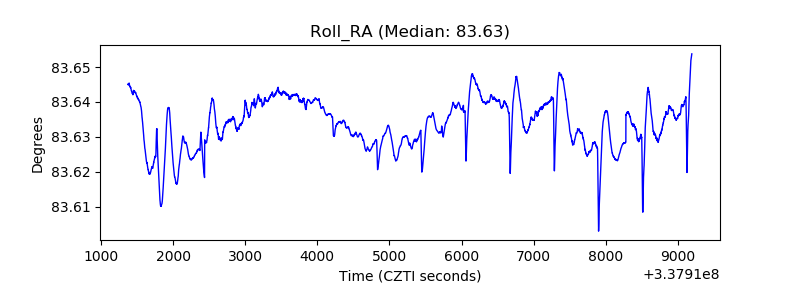 |
| Veto Counter | 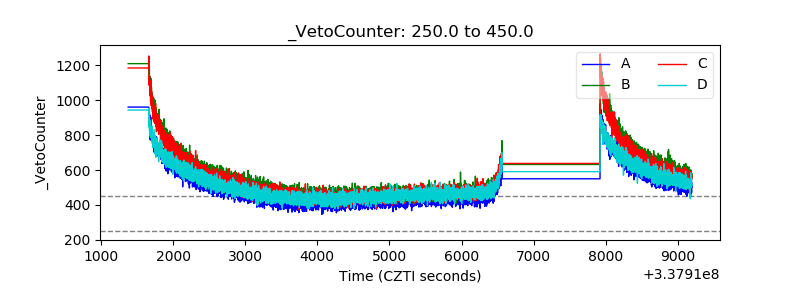 |