| Param | Original file | Final file |
|---|---|---|
| Filename | modeM0/AS1A09_145T01_9000003870_26865cztM0_level2.evt | modeM0/AS1A09_145T01_9000003870_26865cztM0_level2_quad_clean.evt |
| Size (bytes) | 388,802,880 | 77,028,480 |
| Size | 370.8 MB | 73.5 MB |
| Events in quadrant A | 2,660,150 | 508,642 |
| Events in quadrant B | 2,607,042 | 527,642 |
| Events in quadrant C | 2,563,946 | 492,225 |
| Events in quadrant D | 3,617,196 | 467,063 |
| Mode M9 | |||
|---|---|---|---|
| Quadrant | BADHDUFLAG | Total packets | Discarded packets |
| A | 0 | 12 | 0 |
| B | 0 | 12 | 0 |
| C | 0 | 12 | 0 |
| D | 0 | 12 | 0 |
| Mode M0 | |||
|---|---|---|---|
| Quadrant | BADHDUFLAG | Total packets | Discarded packets |
| A | 0 | 10744 | 0 |
| B | 0 | 10527 | 0 |
| C | 0 | 10446 | 0 |
| D | 0 | 13921 | 0 |
| Quadrant | Total seconds | Saturated seconds | Saturation percentage |
|---|---|---|---|
| A | 4800 | 57 | 1.187500% |
| B | 4800 | 59 | 1.229167% |
| C | 4801 | 66 | 1.374714% |
| D | 4801 | 393 | 8.185795% |
Noise dominated data is calculated using 1-second bins in cleaned event files. If a bin has >2000 counts, and if more than 50% of those come from <1% of pixels, then it is considered to be noise-dominated and hence unusable.
| Quadrant | # 1 sec bins | Bins with >0 counts | Bins with >2000 counts | High rate bins dominated by noise | Noise dominated (total time) | Noise dominated (detector-on time) | Marked lightcurve |
|---|---|---|---|---|---|---|---|
| A | 4800 | 4800 | 10 | 10 | 0.21% | 0.21% | 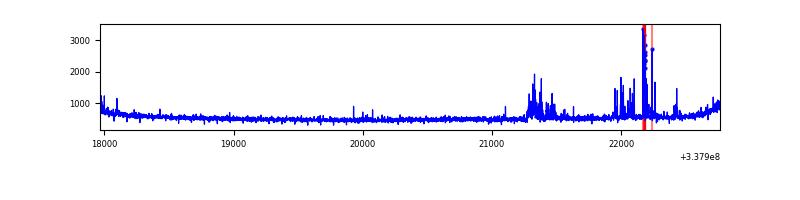 |
| B | 4799 | 4799 | 1 | 1 | 0.02% | 0.02% | 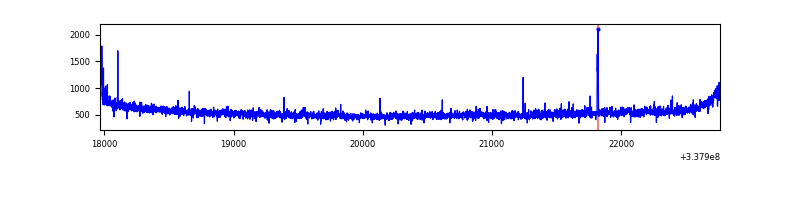 |
| C | 4801 | 4801 | 1 | 1 | 0.02% | 0.02% | 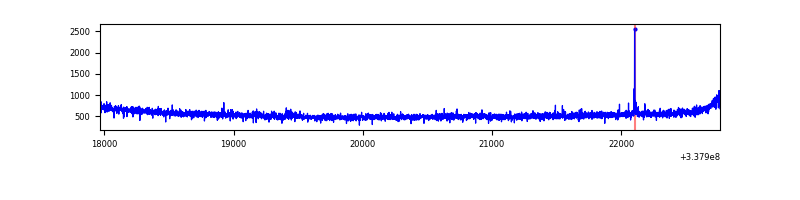 |
| D | 4801 | 4801 | 295 | 295 | 6.14% | 6.14% | 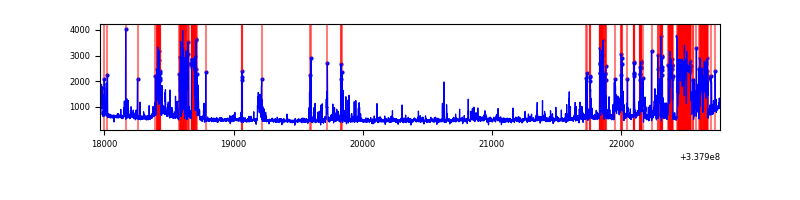 |
Top three noisy pixels from each quadrant. If the there are fewer than three noisy pixels in the level2.evt file, extra rows are filled as -1
| Pixel properties | Quadrant properties | ||||||
|---|---|---|---|---|---|---|---|
| Quadrant | DetID | PixID | Counts | Sigma | Mean | Median | Sigma |
| A | 0 | 13 | 130353 | 989.91 | 655 | 645 | 131.0 |
| A | 13 | 254 | 7786 | 54.5 | 655 | 645 | 131.0 |
| A | 12 | 96 | 6593 | 45.39 | 655 | 645 | 131.0 |
| B | 12 | 111 | 14066 | 109.41 | 658 | 646 | 122.7 |
| B | 15 | 33 | 12986 | 100.6 | 658 | 646 | 122.7 |
| B | 11 | 111 | 12438 | 96.14 | 658 | 646 | 122.7 |
| C | 14 | 238 | 104054 | 704.18 | 628 | 635 | 146.9 |
| C | 15 | 208 | 9748 | 62.05 | 628 | 635 | 146.9 |
| C | 13 | 61 | 4478 | 26.17 | 628 | 635 | 146.9 |
| D | 7 | 80 | 1171605 | 8233.13 | 601 | 591 | 142.2 |
| D | 11 | 176 | 85203 | 594.89 | 601 | 591 | 142.2 |
| D | 2 | 250 | 49595 | 344.54 | 601 | 591 | 142.2 |
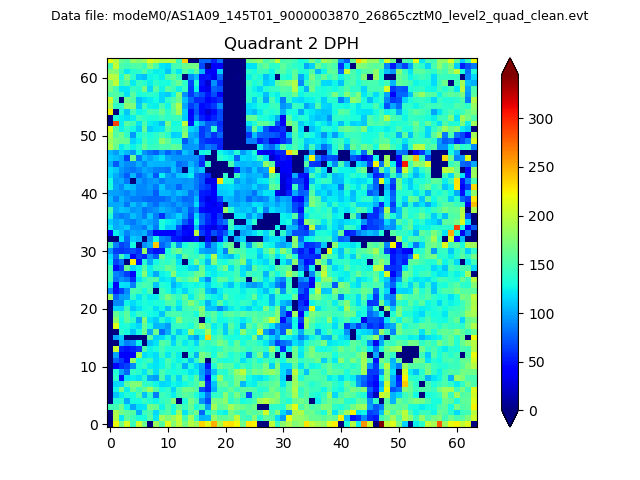
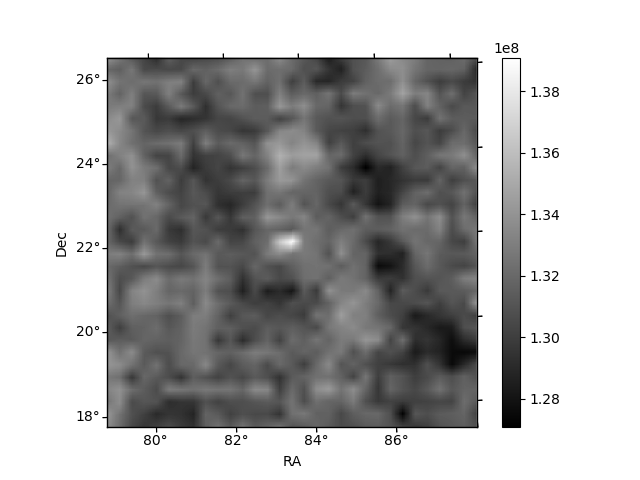
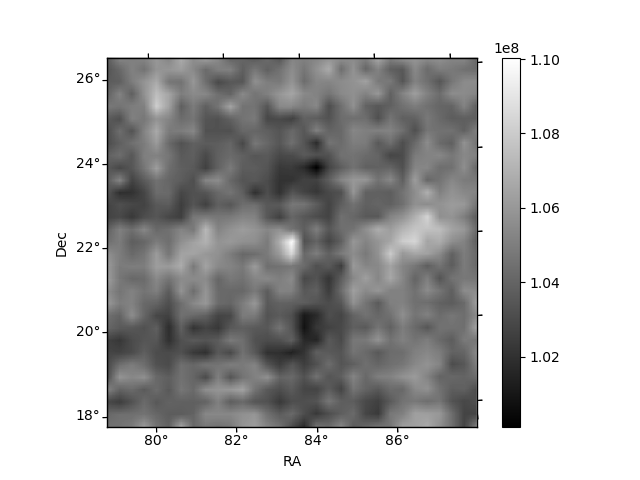
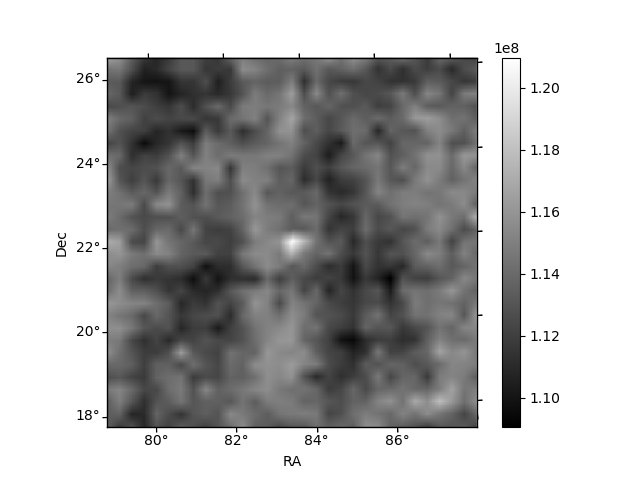
Histogram calculated using DETX and DETY for each event in the final _common_clean file
| Quadrant A | 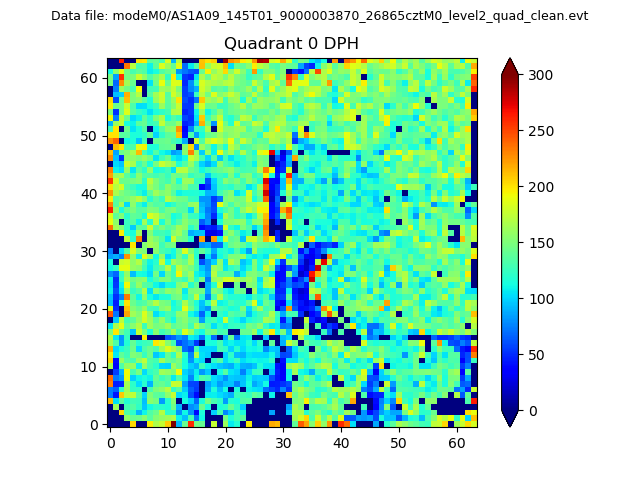 |
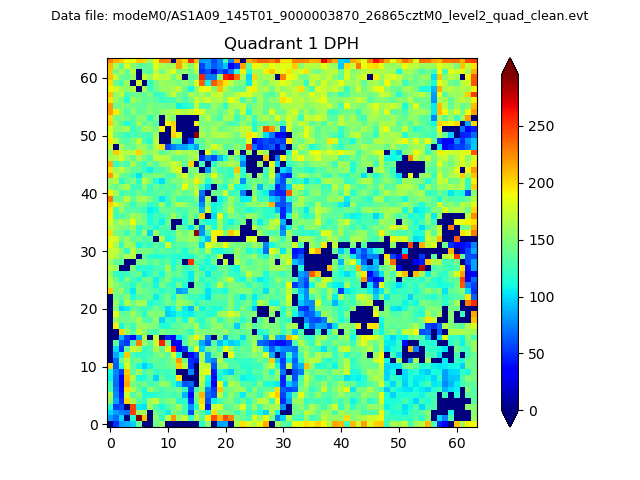 |
Quadrant B |
|---|---|---|---|
| Quadrant D | 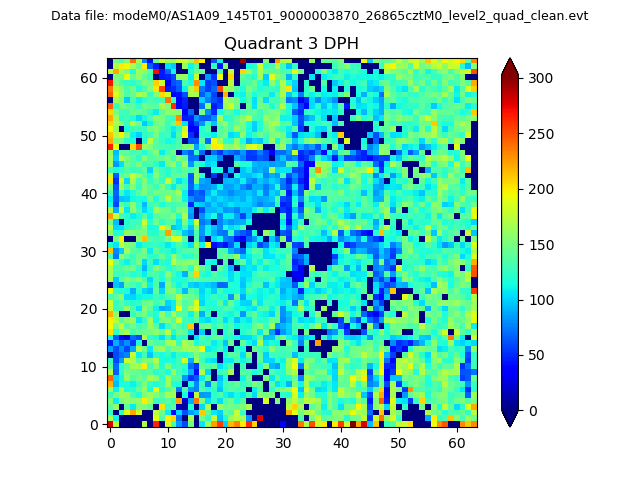 |
 |
Quadrant C |
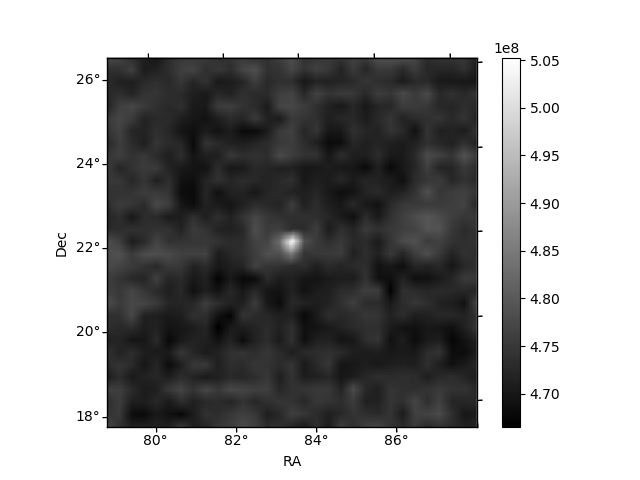
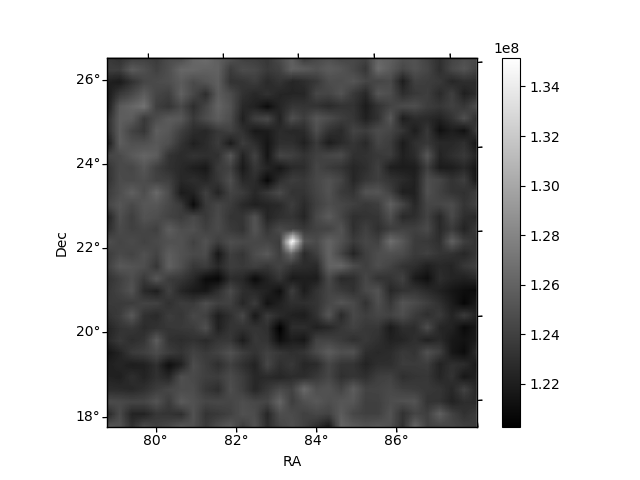
| Plot type | Count rate plots | Images |
|---|---|---|
| Comparison with Poisson distribution Blue bars denote a histogram of data divided into 1 sec bins. Red curve is a Poisson curve with rate = median count rate of data. |
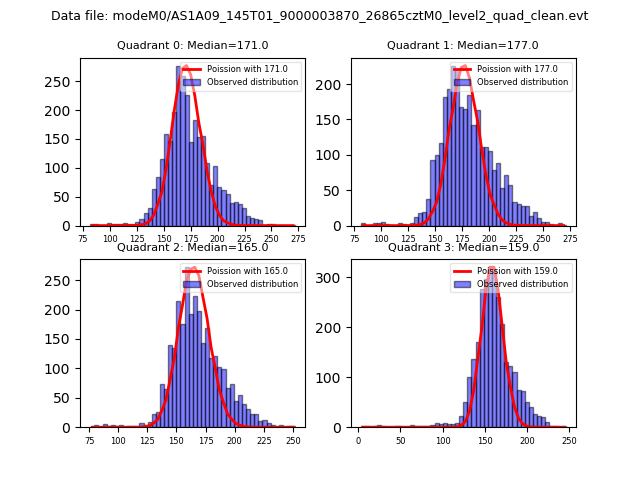 |
 |
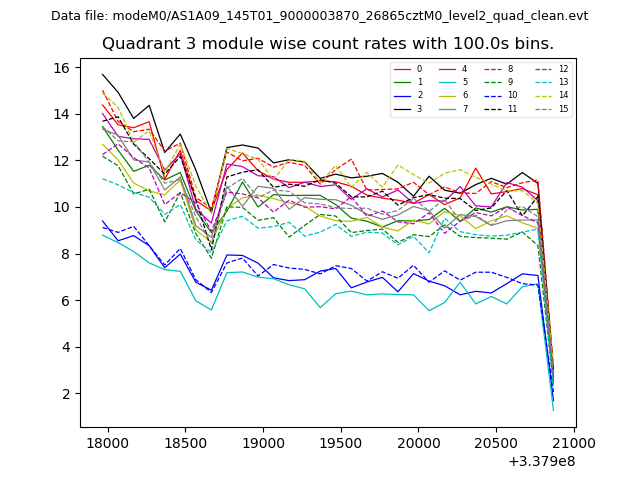
| Quadrant-wise count rates Data is divided into 100 sec bins |
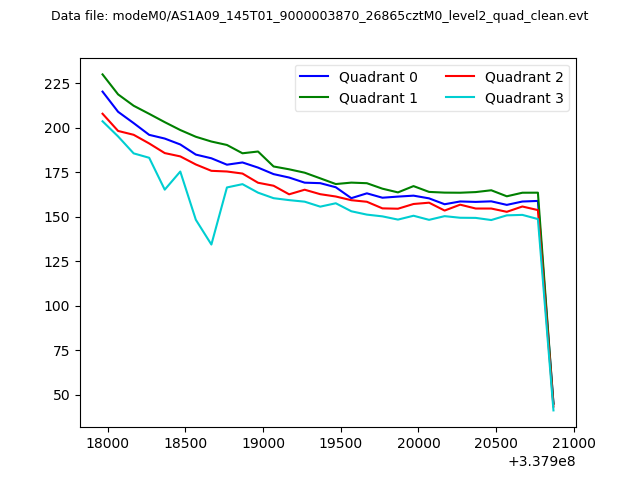 |
|
| Module-wise count rates for Quadrant A Data is divided into 100 sec bins |
 |
 |
| Module-wise count rates for Quadrant B Data is divided into 100 sec bins |
 |
 |
| Module-wise count rates for Quadrant C Data is divided into 100 sec bins |
 |
 |
| Module-wise count rates for Quadrant D Data is divided into 100 sec bins |
 |
 |
| Parameter | Plot |
|---|---|
| CZT HV Monitor | 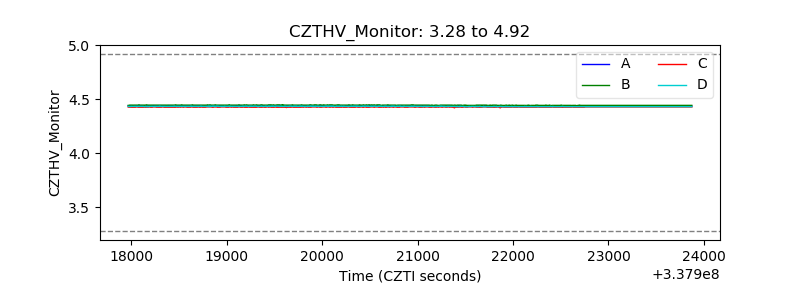 |
| D_VDD | 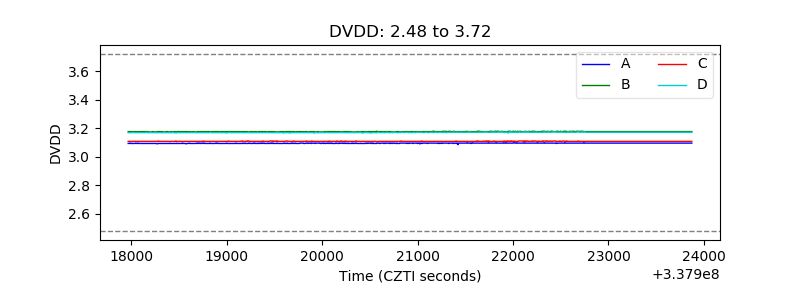 |
| Temperature 1 | 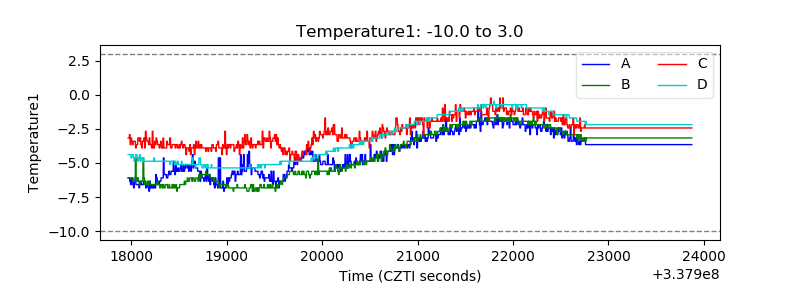 |
| Veto HV Monitor | 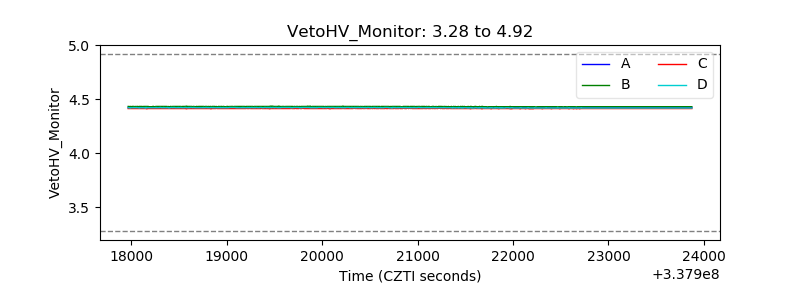 |
| Veto LLD | 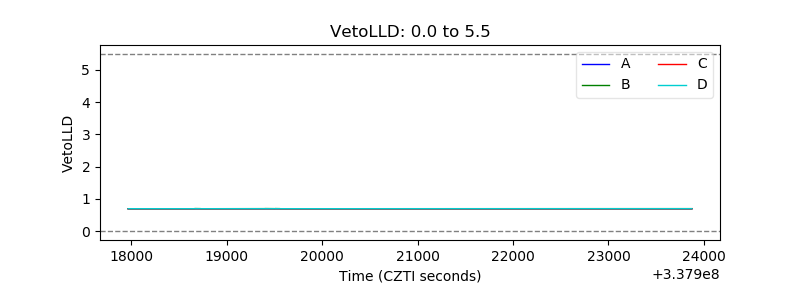 |
| Alpha Counter | 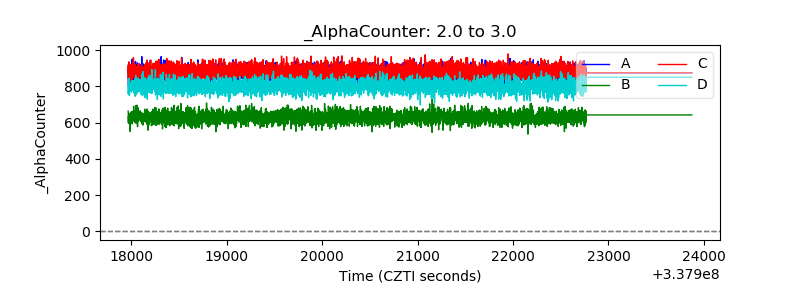 |
| _CPM_Rate | 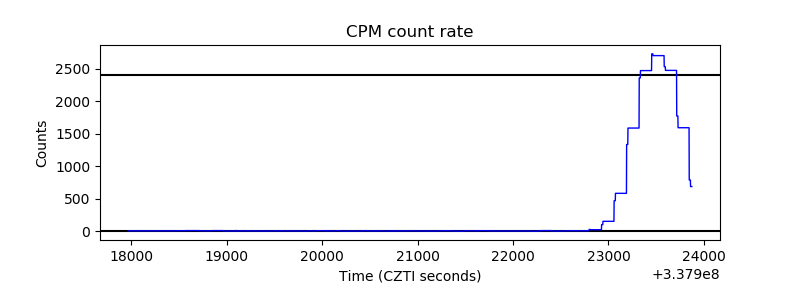 |
| CZT Counter | 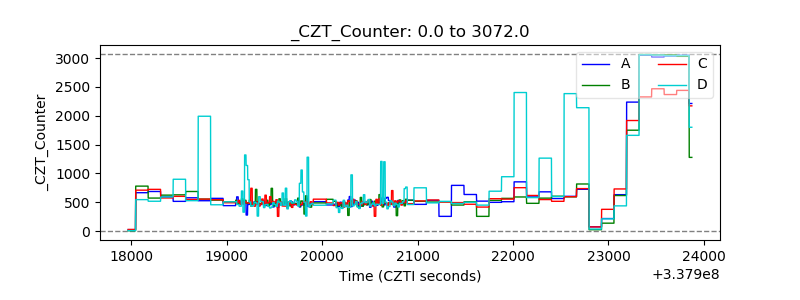 |
| +2.5 Volts monitor | 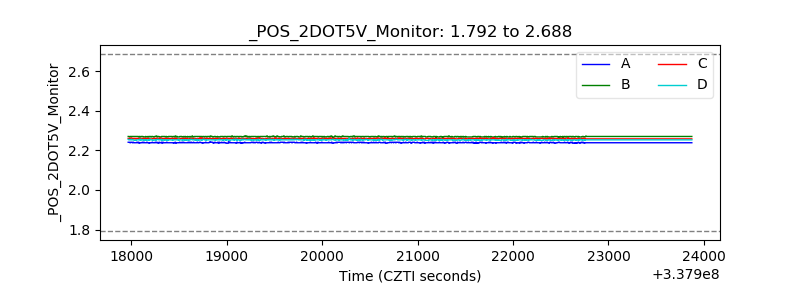 |
| +5 Volts monitor |  |
| _ROLL_ROT | 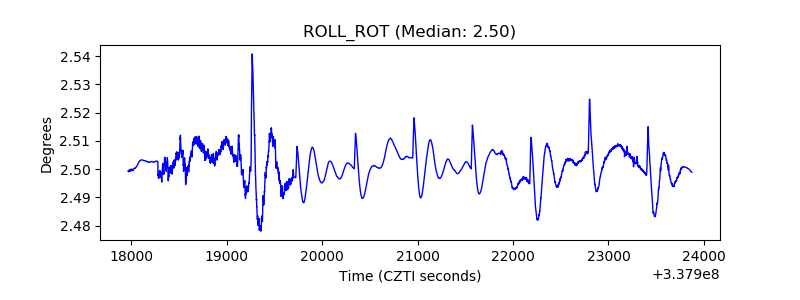 |
| _Roll_DEC | 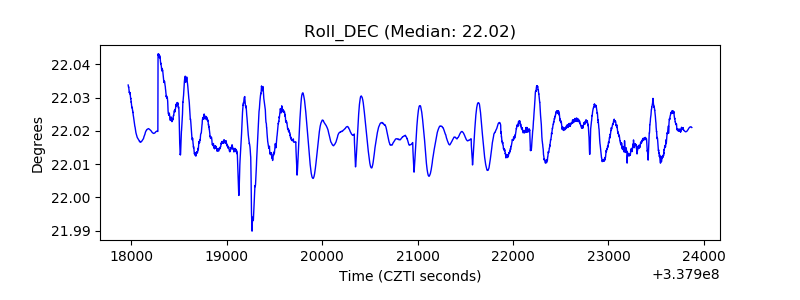 |
| _Roll_RA | 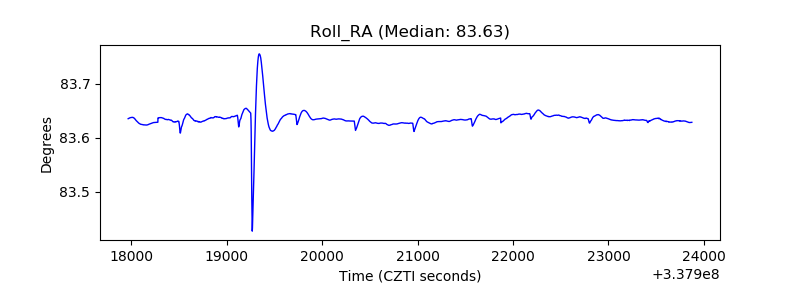 |
| Veto Counter | 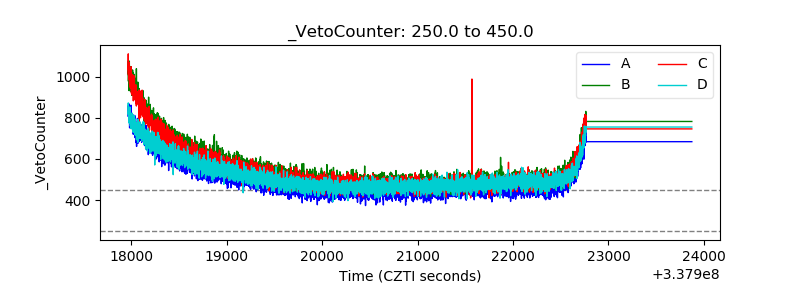 |