| Param | Original file | Final file |
|---|---|---|
| Filename | modeM0/AS1T03_224T01_9000003872cztM0_level2.fits | modeM0/AS1T03_224T01_9000003872cztM0_level2_quad_clean.evt |
| Size (bytes) | 992,329,920 | 802,555,200 |
| Size | 946.4 MB | 765.4 MB |
| Events in quadrant A | 6,194,870 | 4,606,989 |
| Events in quadrant B | 5,971,194 | 4,686,618 |
| Events in quadrant C | 6,139,430 | 4,574,333 |
| Events in quadrant D | 4,965,478 | 3,659,316 |
| Mode M0 | |||
|---|---|---|---|
| Quadrant | BADHDUFLAG | Total packets | Discarded packets |
| A | 0 | 243101 | 0 |
| B | 0 | 236813 | 0 |
| C | 0 | 208464 | 0 |
| D | 0 | 326020 | 0 |
| Mode SS | |||
|---|---|---|---|
| Quadrant | BADHDUFLAG | Total packets | Discarded packets |
| A | 0 | 2016 | 0 |
| B | 0 | 2016 | 0 |
| C | 0 | 2016 | 0 |
| D | 0 | 2016 | 0 |
| Mode M9 | |||
|---|---|---|---|
| Quadrant | BADHDUFLAG | Total packets | Discarded packets |
| A | 0 | 155 | 0 |
| B | 0 | 155 | 0 |
| C | 0 | 155 | 0 |
| D | 0 | 155 | 0 |
| Quadrant | Total seconds | Saturated seconds | Saturation percentage |
|---|---|---|---|
| A | 98849 | 2947 | 2.981315% |
| B | 98849 | 3218 | 3.255470% |
| C | 98849 | 2029 | 2.052626% |
| D | 98849 | 13211 | 13.364829% |
Noise dominated data is calculated using 1-second bins in cleaned event files. If a bin has >2000 counts, and if more than 50% of those come from <1% of pixels, then it is considered to be noise-dominated and hence unusable.
| Quadrant | # 1 sec bins | Bins with >0 counts | Bins with >2000 counts | High rate bins dominated by noise | Noise dominated (total time) | Noise dominated (detector-on time) | Marked lightcurve |
|---|---|---|---|---|---|---|---|
| A | 114299 | 98816 | 0 | 0 | 0.00% | 0.00% |  |
| B | 114299 | 98829 | 0 | 0 | 0.00% | 0.00% |  |
| C | 114299 | 98841 | 0 | 0 | 0.00% | 0.00% |  |
| D | 114299 | 96514 | 0 | 0 | 0.00% | 0.00% |  |
Top three noisy pixels from each quadrant. If the there are fewer than three noisy pixels in the level2.evt file, extra rows are filled as -1
| Pixel properties | Quadrant properties | ||||||
|---|---|---|---|---|---|---|---|
| Quadrant | DetID | PixID | Counts | Sigma | Mean | Median | Sigma |
| A | 0 | 29 | 5164 | 9.34 | 1613 | 1519 | 390.0 |
| A | 7 | 110 | 5042 | 9.03 | 1613 | 1519 | 390.0 |
| A | 0 | 30 | 4602 | 7.9 | 1613 | 1519 | 390.0 |
| B | 2 | 9 | 4766 | 10.67 | 1578 | 1510 | 305.3 |
| B | 2 | 8 | 3933 | 7.94 | 1578 | 1510 | 305.3 |
| B | 5 | 255 | 3932 | 7.93 | 1578 | 1510 | 305.3 |
| C | 1 | 81 | 4867 | 8.22 | 1622 | 1523 | 407.0 |
| C | 1 | 80 | 4794 | 8.04 | 1622 | 1523 | 407.0 |
| C | 12 | 241 | 4234 | 6.66 | 1622 | 1523 | 407.0 |
| D | 3 | 14 | 3651 | 6.34 | 1415 | 1292 | 372.0 |
| D | 7 | 3 | 3529 | 6.01 | 1415 | 1292 | 372.0 |
| D | 6 | 38 | 3469 | 5.85 | 1415 | 1292 | 372.0 |
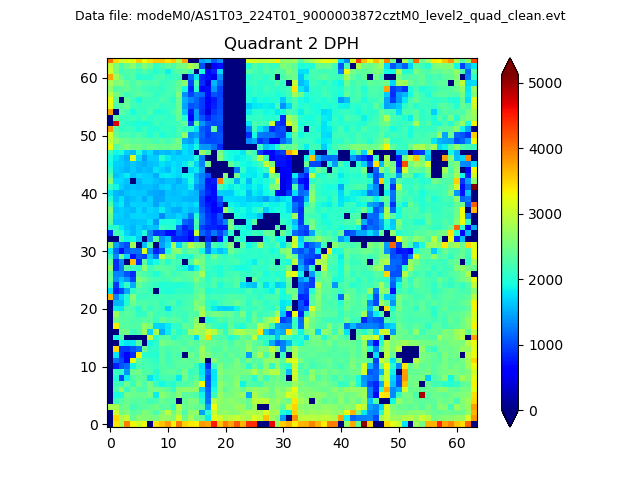
Histogram calculated using DETX and DETY for each event in the final _common_clean file
| Quadrant A |  |
 |
Quadrant B |
|---|---|---|---|
| Quadrant D |  |
 |
Quadrant C |
| Plot type | Count rate plots | Images |
|---|---|---|
| Comparison with Poisson distribution Blue bars denote a histogram of data divided into 1 sec bins. Red curve is a Poisson curve with rate = median count rate of data. |
 |
 |
| Quadrant-wise count rates Data is divided into 100 sec bins |
 |
|
| Module-wise count rates for Quadrant A Data is divided into 100 sec bins |
 |
 |
| Module-wise count rates for Quadrant B Data is divided into 100 sec bins |
 |
 |
| Module-wise count rates for Quadrant C Data is divided into 100 sec bins |
 |
 |
| Module-wise count rates for Quadrant D Data is divided into 100 sec bins |
 |
 |
| Parameter | Plot |
|---|---|
| CZT HV Monitor |  |
| D_VDD |  |
| Temperature 1 |  |
| Veto HV Monitor |  |
| Veto LLD | 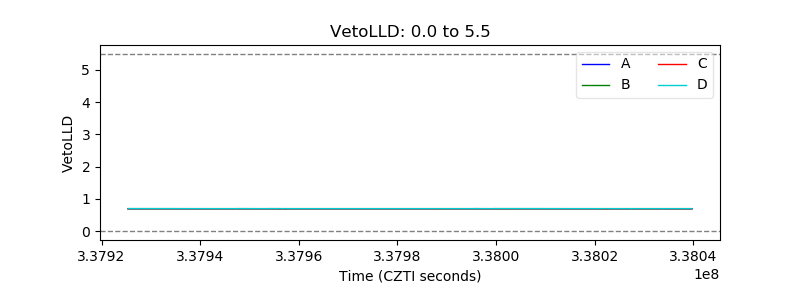 |
| Alpha Counter |  |
| _CPM_Rate | 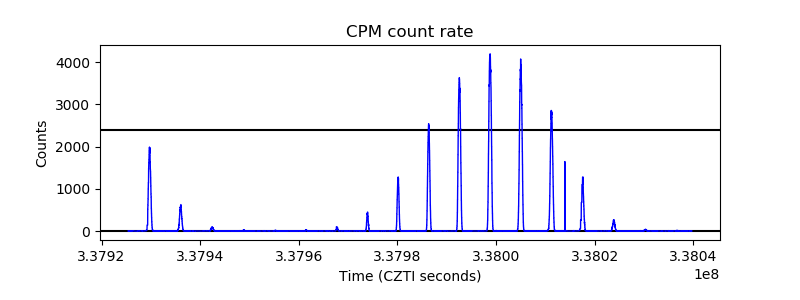 |
| CZT Counter |  |
| +2.5 Volts monitor |  |
| +5 Volts monitor |  |
| _ROLL_ROT |  |
| _Roll_DEC |  |
| _Roll_RA |  |
| Veto Counter |  |