| Param | Original file | Final file |
|---|---|---|
| Filename | modeM0/AS1T03_224T01_9000003872_26866cztM0_level2.evt | modeM0/AS1T03_224T01_9000003872_26866cztM0_level2_quad_clean.evt |
| Size (bytes) | 422,570,880 | 60,310,080 |
| Size | 403.0 MB | 57.5 MB |
| Events in quadrant A | 3,103,049 | 375,574 |
| Events in quadrant B | 2,802,962 | 390,212 |
| Events in quadrant C | 2,604,860 | 371,698 |
| Events in quadrant D | 3,949,682 | 340,327 |
| Mode M0 | |||
|---|---|---|---|
| Quadrant | BADHDUFLAG | Total packets | Discarded packets |
| A | 0 | 12202 | 0 |
| B | 0 | 11185 | 0 |
| C | 0 | 10560 | 0 |
| D | 0 | 14900 | 0 |
| Mode M9 | |||
|---|---|---|---|
| Quadrant | BADHDUFLAG | Total packets | Discarded packets |
| A | 0 | 14 | 0 |
| B | 0 | 14 | 0 |
| C | 0 | 14 | 0 |
| D | 0 | 14 | 0 |
| Quadrant | Total seconds | Saturated seconds | Saturation percentage |
|---|---|---|---|
| A | 4965 | 132 | 2.658610% |
| B | 4965 | 61 | 1.228600% |
| C | 4965 | 88 | 1.772407% |
| D | 4964 | 359 | 7.232071% |
Noise dominated data is calculated using 1-second bins in cleaned event files. If a bin has >2000 counts, and if more than 50% of those come from <1% of pixels, then it is considered to be noise-dominated and hence unusable.
| Quadrant | # 1 sec bins | Bins with >0 counts | Bins with >2000 counts | High rate bins dominated by noise | Noise dominated (total time) | Noise dominated (detector-on time) | Marked lightcurve |
|---|---|---|---|---|---|---|---|
| A | 6355 | 4965 | 57 | 57 | 0.90% | 1.15% | 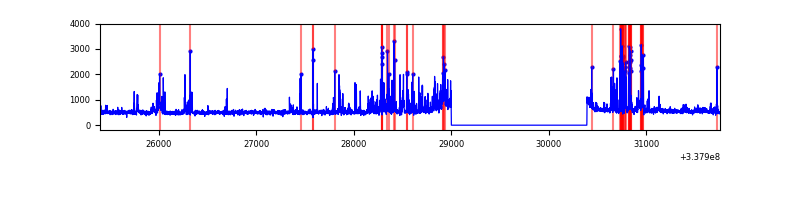 |
| B | 6355 | 4966 | 10 | 10 | 0.16% | 0.20% | 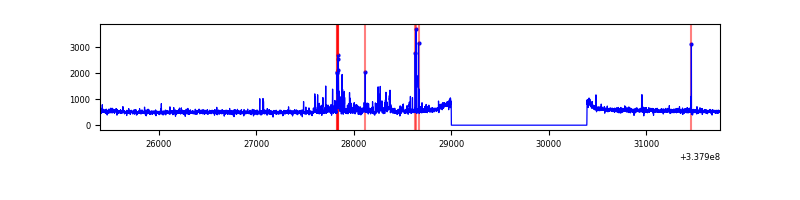 |
| C | 6355 | 4966 | 0 | 0 | 0.00% | 0.00% | 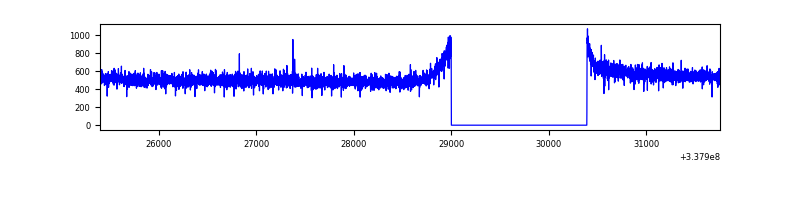 |
| D | 6354 | 4964 | 285 | 285 | 4.49% | 5.74% | 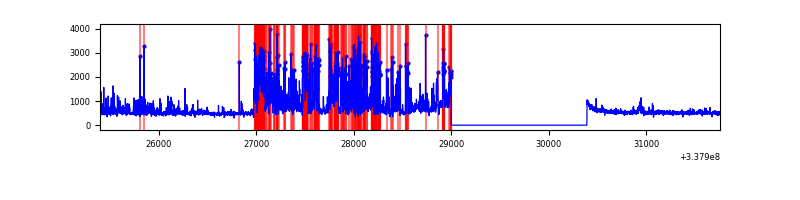 |
Top three noisy pixels from each quadrant. If the there are fewer than three noisy pixels in the level2.evt file, extra rows are filled as -1
| Pixel properties | Quadrant properties | ||||||
|---|---|---|---|---|---|---|---|
| Quadrant | DetID | PixID | Counts | Sigma | Mean | Median | Sigma |
| A | 0 | 13 | 529964 | 4009.56 | 662 | 650 | 132.0 |
| A | 12 | 96 | 22482 | 165.38 | 662 | 650 | 132.0 |
| A | 13 | 254 | 8124 | 56.62 | 662 | 650 | 132.0 |
| B | 0 | 190 | 123500 | 975.38 | 666 | 650 | 126.0 |
| B | 10 | 246 | 43452 | 339.83 | 666 | 650 | 126.0 |
| B | 0 | 189 | 20261 | 155.7 | 666 | 650 | 126.0 |
| C | 14 | 238 | 105067 | 705.63 | 640 | 645 | 148.0 |
| C | 13 | 61 | 4547 | 26.37 | 640 | 645 | 148.0 |
| C | 15 | 208 | 2703 | 13.91 | 640 | 645 | 148.0 |
| D | 7 | 80 | 1326563 | 9100.14 | 625 | 611 | 145.7 |
| D | 1 | 52 | 104468 | 712.78 | 625 | 611 | 145.7 |
| D | 12 | 227 | 65616 | 446.14 | 625 | 611 | 145.7 |
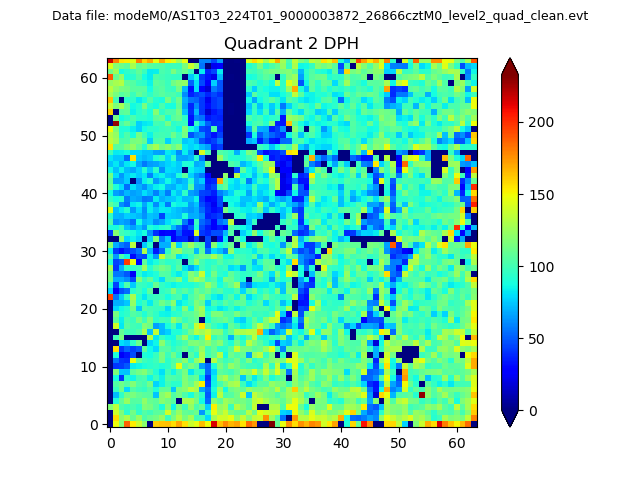
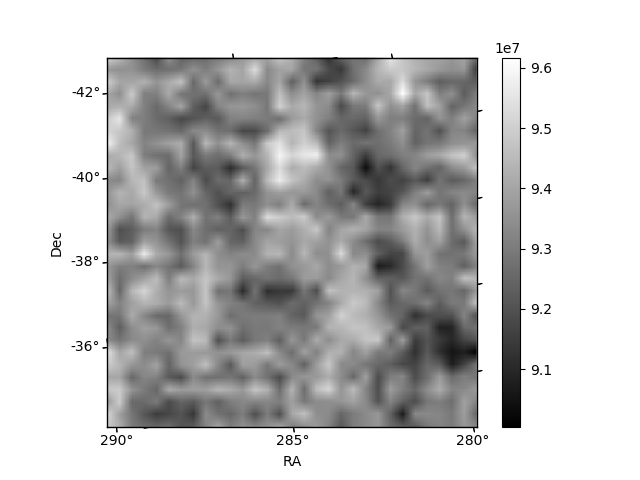
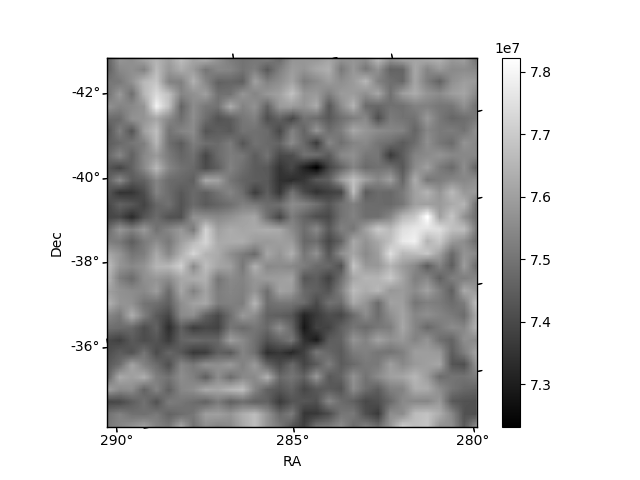
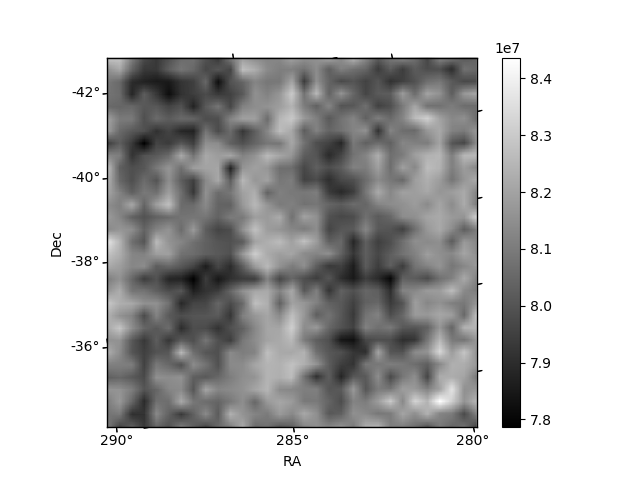
Histogram calculated using DETX and DETY for each event in the final _common_clean file
| Quadrant A | 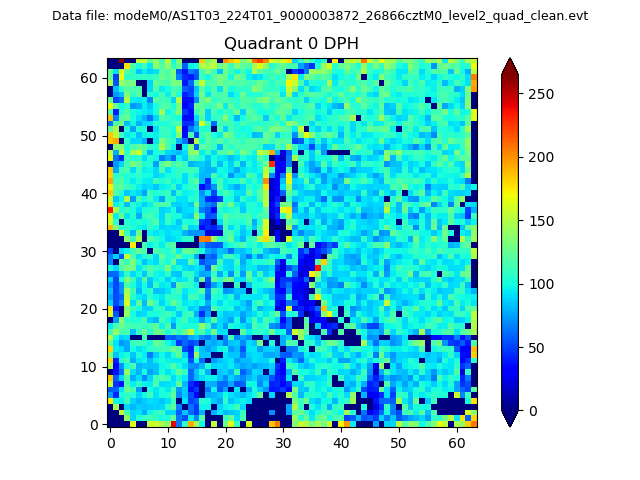 |
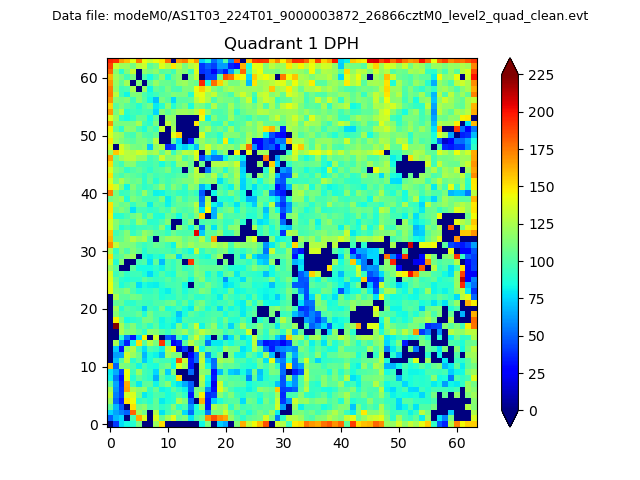 |
Quadrant B |
|---|---|---|---|
| Quadrant D | 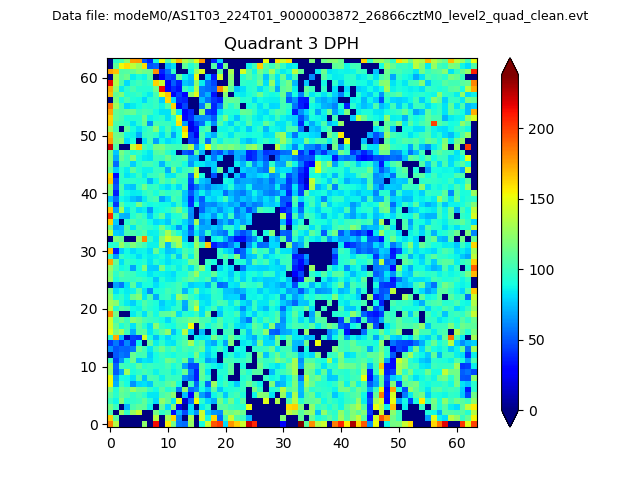 |
 |
Quadrant C |
| Plot type | Count rate plots | Images |
|---|---|---|
| Comparison with Poisson distribution Blue bars denote a histogram of data divided into 1 sec bins. Red curve is a Poisson curve with rate = median count rate of data. |
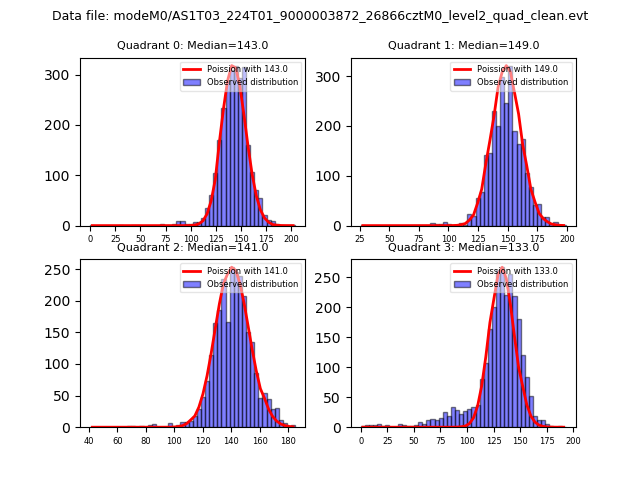 |
 |
| Quadrant-wise count rates Data is divided into 100 sec bins |
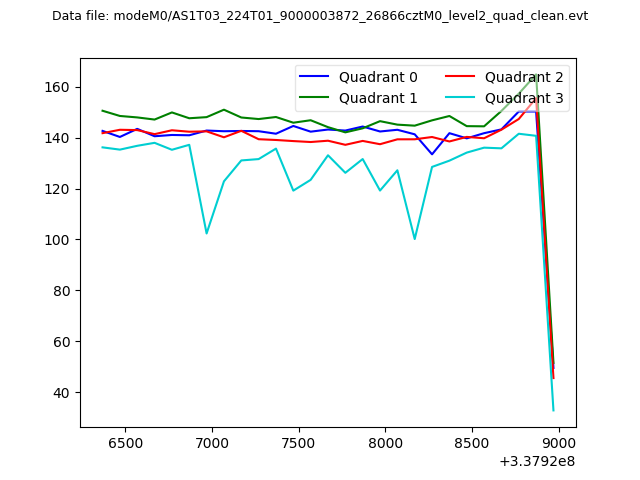 |
|
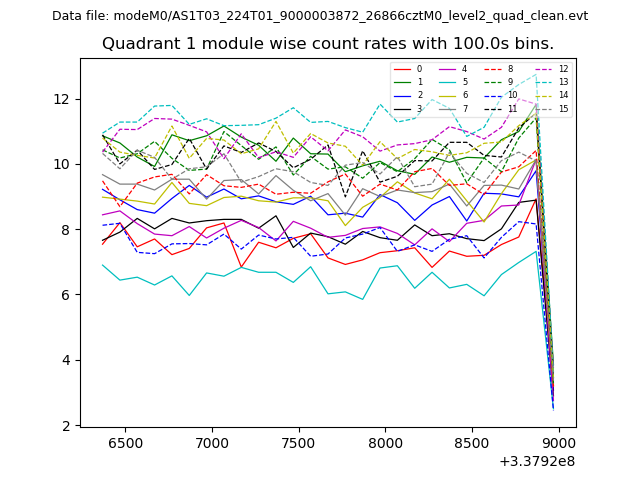
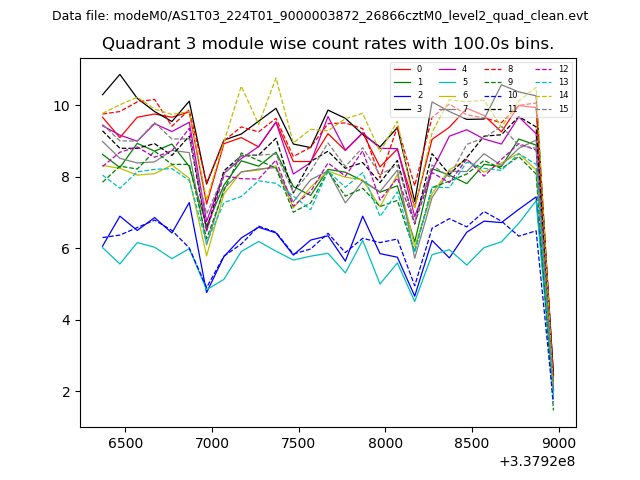
| Module-wise count rates for Quadrant A Data is divided into 100 sec bins |
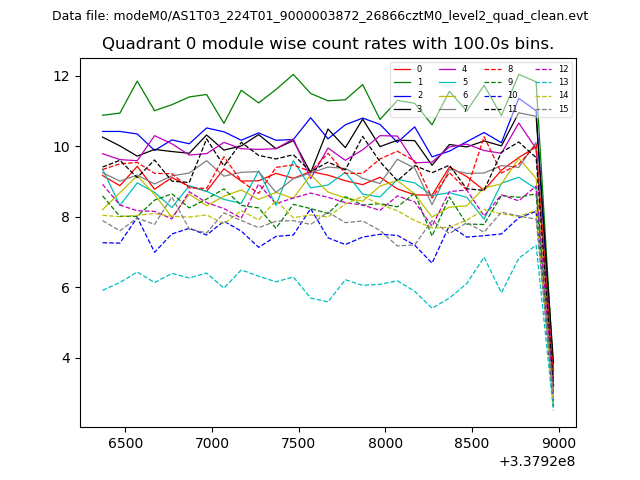 |
 |
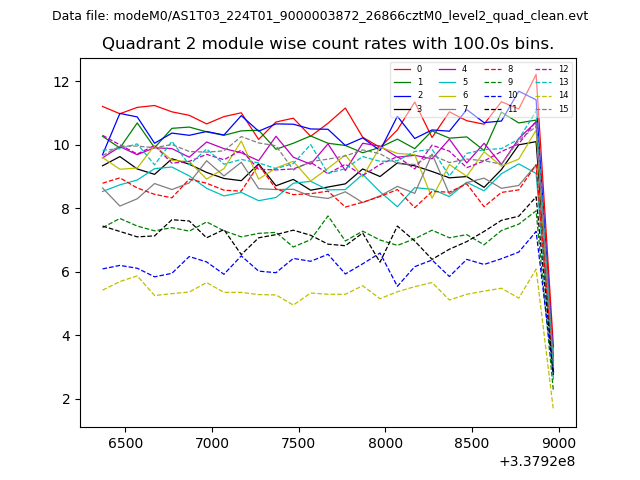
| Module-wise count rates for Quadrant B Data is divided into 100 sec bins |
 |
 |
| Module-wise count rates for Quadrant C Data is divided into 100 sec bins |
 |
 |
| Module-wise count rates for Quadrant D Data is divided into 100 sec bins |
 |
 |
| Parameter | Plot |
|---|---|
| CZT HV Monitor | 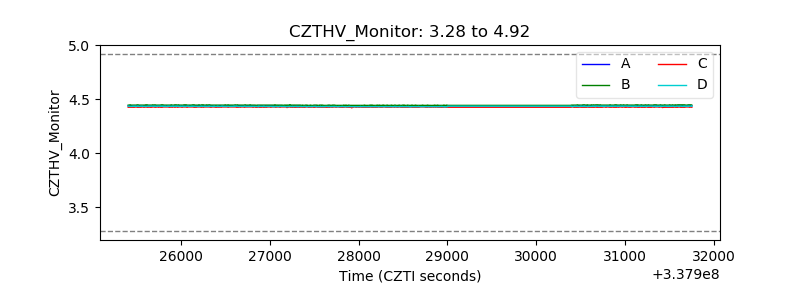 |
| D_VDD | 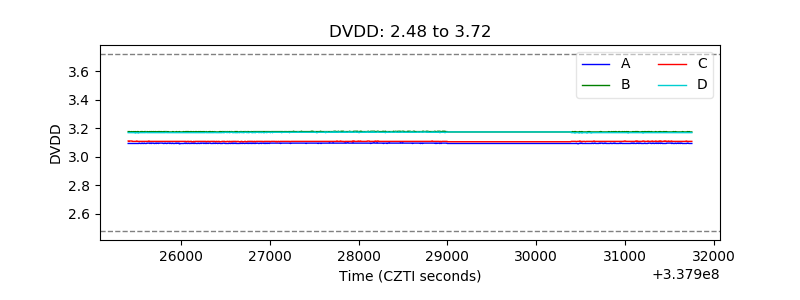 |
| Temperature 1 |  |
| Veto HV Monitor | 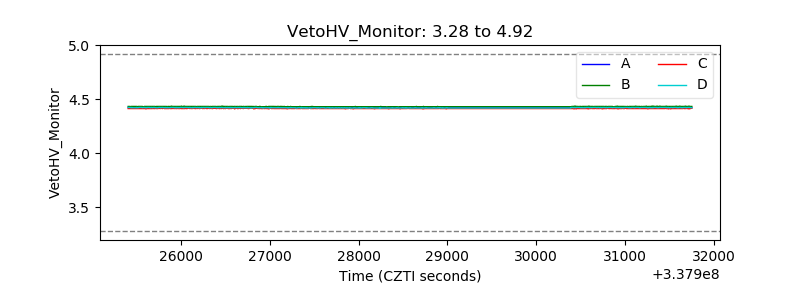 |
| Veto LLD | 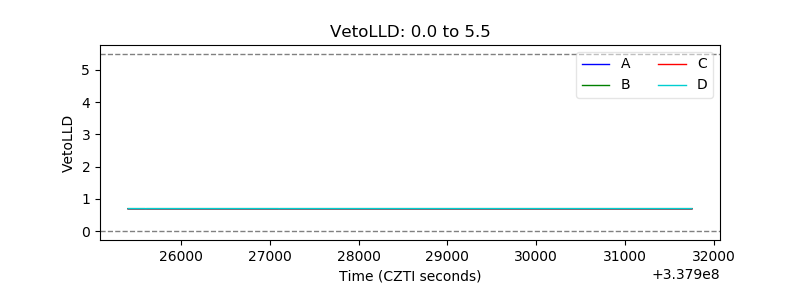 |
| Alpha Counter | 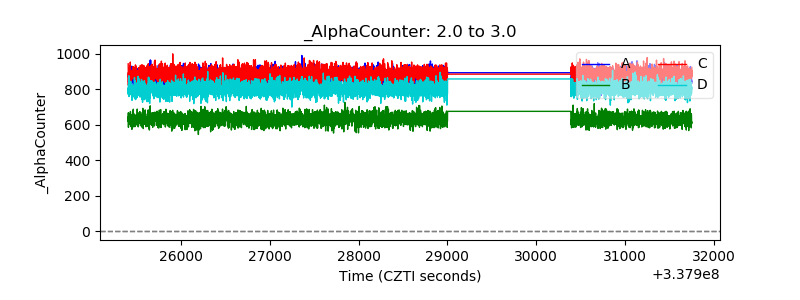 |
| _CPM_Rate | 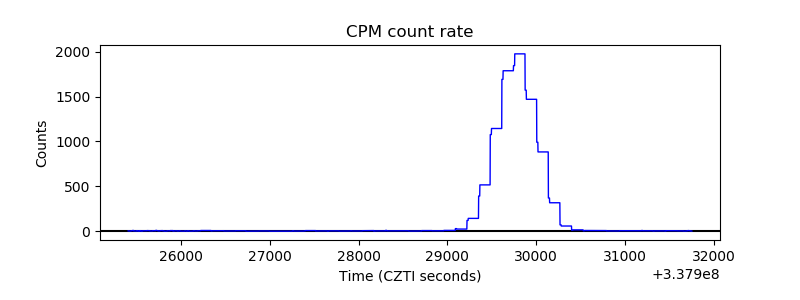 |
| CZT Counter | 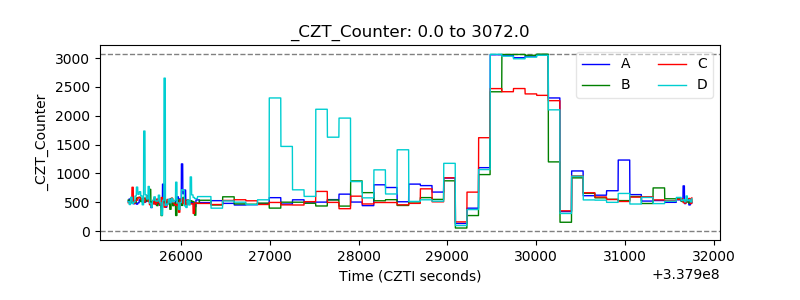 |
| +2.5 Volts monitor |  |
| +5 Volts monitor |  |
| _ROLL_ROT | 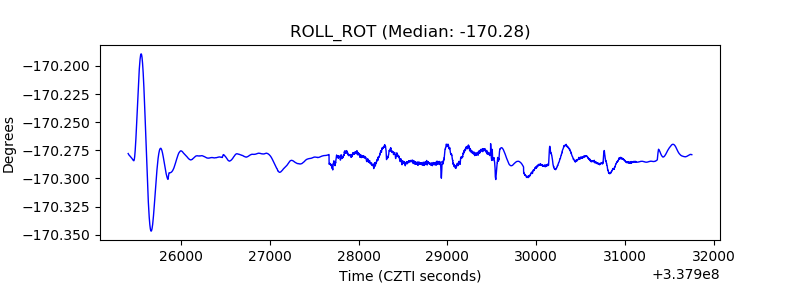 |
| _Roll_DEC | 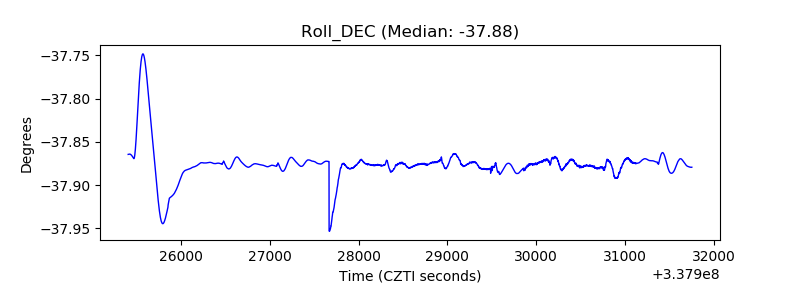 |
| _Roll_RA | 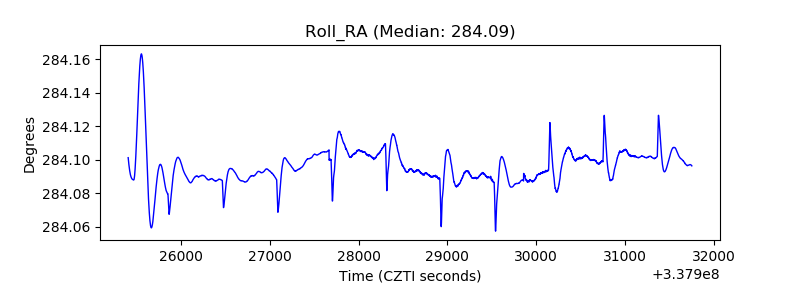 |
| Veto Counter | 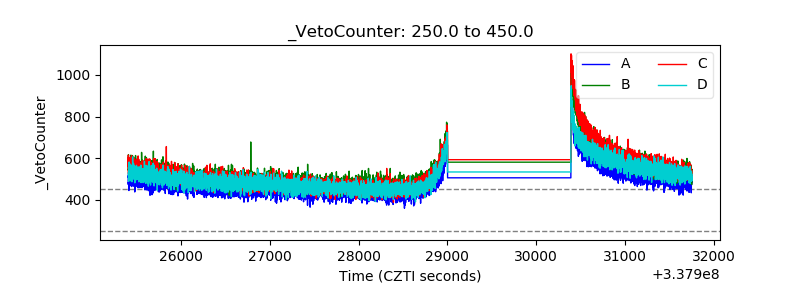 |