| Param | Original file | Final file |
|---|---|---|
| Filename | modeM0/AS1T03_224T01_9000003872_26867cztM0_level2.evt | modeM0/AS1T03_224T01_9000003872_26867cztM0_level2_quad_clean.evt |
| Size (bytes) | 510,468,480 | 75,182,400 |
| Size | 486.8 MB | 71.7 MB |
| Events in quadrant A | 3,860,164 | 460,677 |
| Events in quadrant B | 3,739,413 | 473,809 |
| Events in quadrant C | 3,376,548 | 456,746 |
| Events in quadrant D | 4,052,037 | 441,494 |
| Mode M0 | |||
|---|---|---|---|
| Quadrant | BADHDUFLAG | Total packets | Discarded packets |
| A | 0 | 15236 | 0 |
| B | 0 | 14854 | 0 |
| C | 0 | 13670 | 0 |
| D | 0 | 15965 | 0 |
| Mode M9 | |||
|---|---|---|---|
| Quadrant | BADHDUFLAG | Total packets | Discarded packets |
| A | 0 | 16 | 0 |
| B | 0 | 17 | 0 |
| C | 0 | 17 | 0 |
| D | 0 | 17 | 0 |
| Quadrant | Total seconds | Saturated seconds | Saturation percentage |
|---|---|---|---|
| A | 6362 | 166 | 2.609242% |
| B | 6362 | 152 | 2.389186% |
| C | 6362 | 144 | 2.263439% |
| D | 6362 | 189 | 2.970764% |
Noise dominated data is calculated using 1-second bins in cleaned event files. If a bin has >2000 counts, and if more than 50% of those come from <1% of pixels, then it is considered to be noise-dominated and hence unusable.
| Quadrant | # 1 sec bins | Bins with >0 counts | Bins with >2000 counts | High rate bins dominated by noise | Noise dominated (total time) | Noise dominated (detector-on time) | Marked lightcurve |
|---|---|---|---|---|---|---|---|
| A | 7547 | 6363 | 56 | 56 | 0.74% | 0.88% | 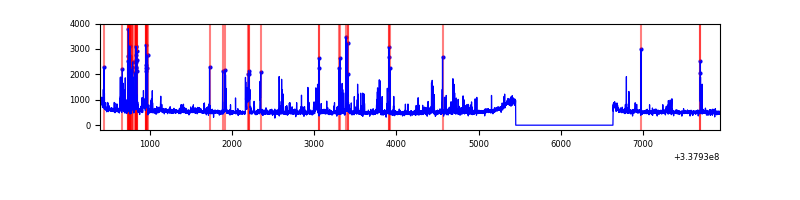 |
| B | 7547 | 6362 | 29 | 29 | 0.38% | 0.46% | 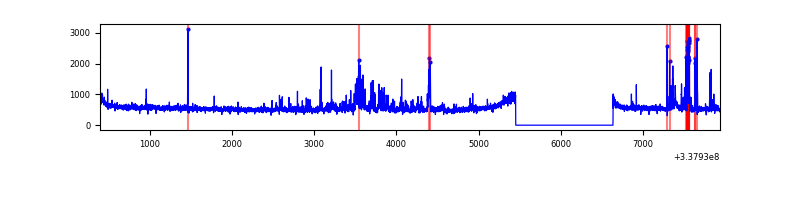 |
| C | 7547 | 6362 | 0 | 0 | 0.00% | 0.00% | 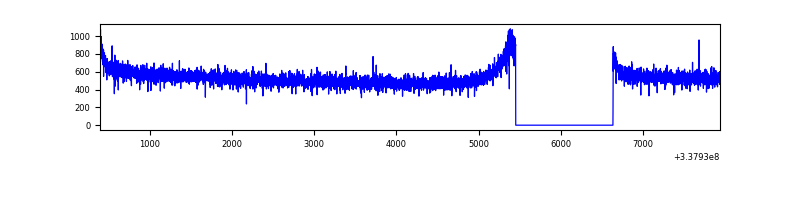 |
| D | 7547 | 6362 | 115 | 115 | 1.52% | 1.81% | 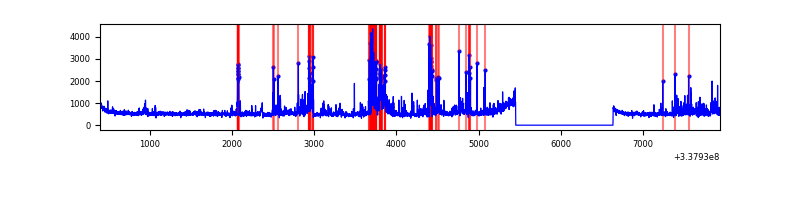 |
Top three noisy pixels from each quadrant. If the there are fewer than three noisy pixels in the level2.evt file, extra rows are filled as -1
| Pixel properties | Quadrant properties | ||||||
|---|---|---|---|---|---|---|---|
| Quadrant | DetID | PixID | Counts | Sigma | Mean | Median | Sigma |
| A | 0 | 13 | 547602 | 3235.05 | 856 | 842 | 169.0 |
| A | 12 | 96 | 12523 | 69.11 | 856 | 842 | 169.0 |
| A | 13 | 254 | 10094 | 54.74 | 856 | 842 | 169.0 |
| B | 10 | 246 | 149977 | 923.73 | 857 | 834 | 161.5 |
| B | 0 | 190 | 129495 | 796.87 | 857 | 834 | 161.5 |
| B | 0 | 189 | 79051 | 484.44 | 857 | 834 | 161.5 |
| C | 14 | 238 | 134330 | 693.0 | 832 | 840 | 192.6 |
| C | 13 | 61 | 5832 | 25.92 | 832 | 840 | 192.6 |
| C | 3 | 233 | 2943 | 10.92 | 832 | 840 | 192.6 |
| D | 7 | 80 | 624636 | 3237.65 | 830 | 813 | 192.7 |
| D | 2 | 250 | 113945 | 587.16 | 830 | 813 | 192.7 |
| D | 12 | 227 | 95834 | 493.16 | 830 | 813 | 192.7 |
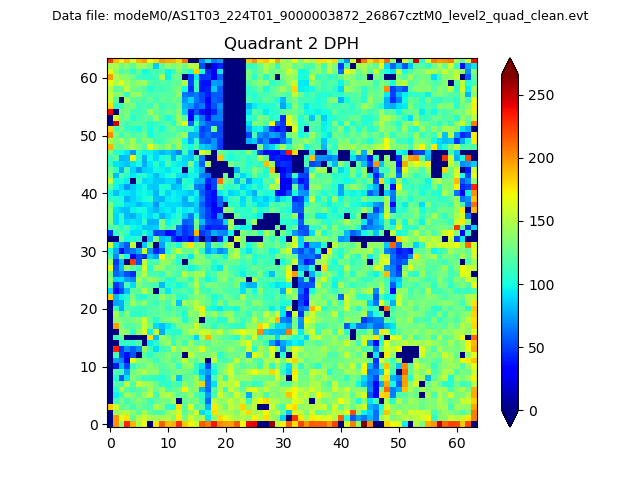
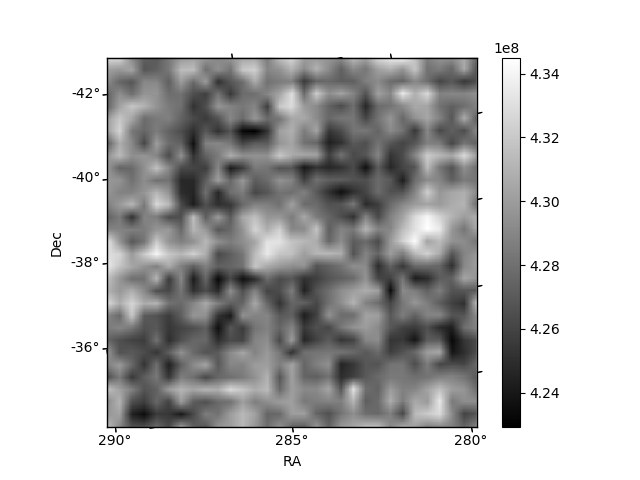
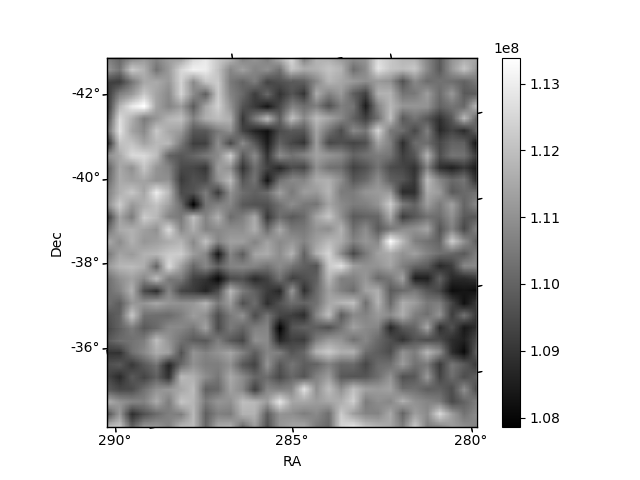
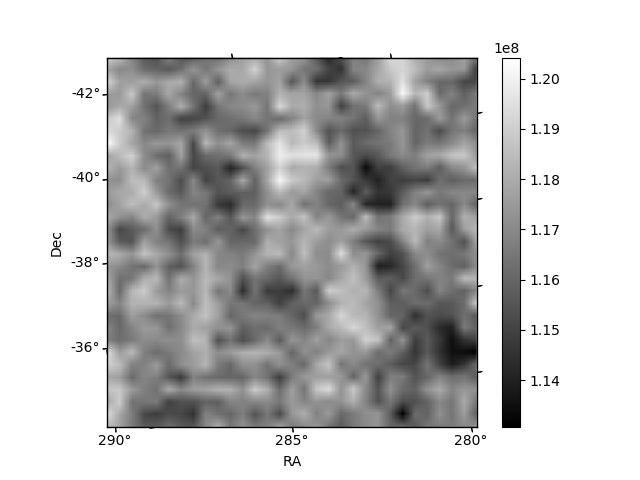
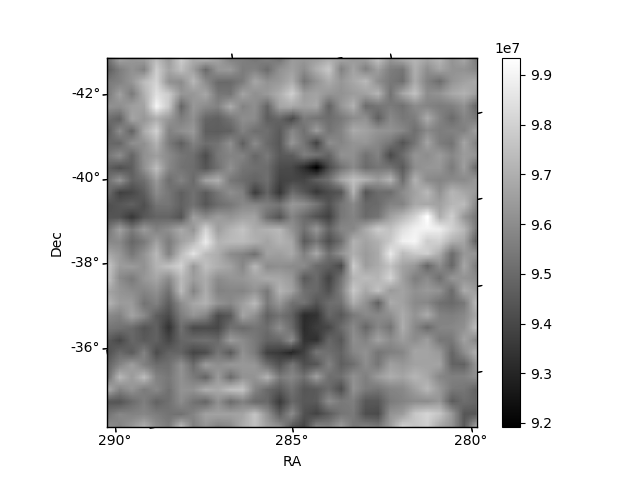
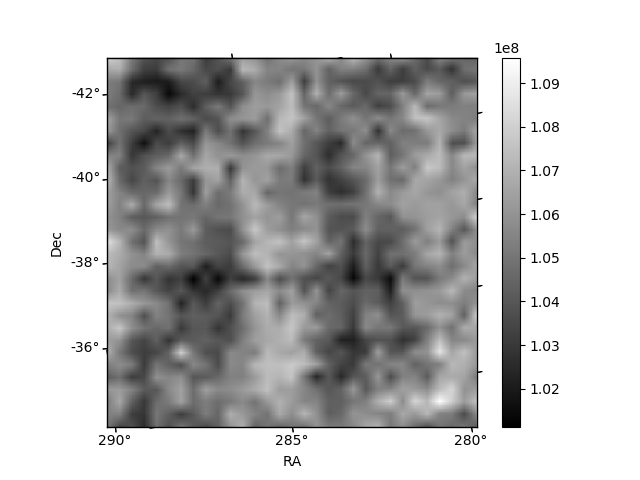
Histogram calculated using DETX and DETY for each event in the final _common_clean file
| Quadrant A | 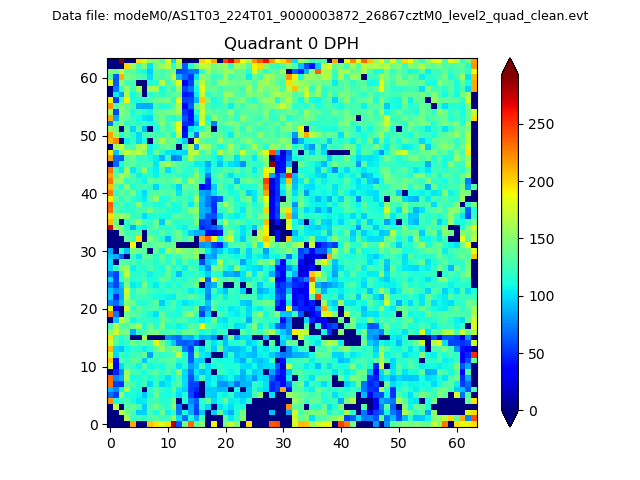 |
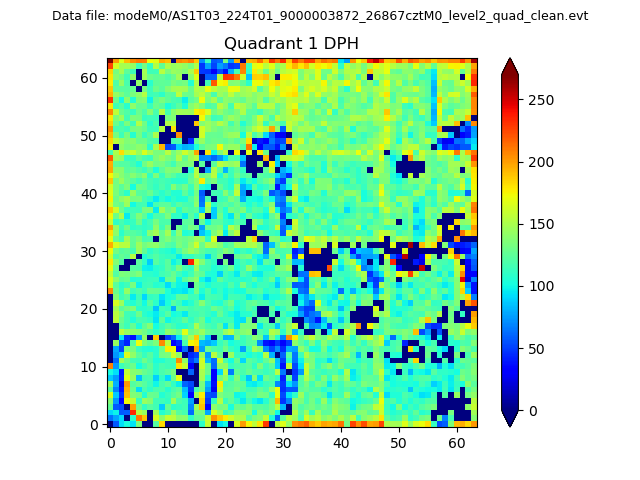 |
Quadrant B |
|---|---|---|---|
| Quadrant D | 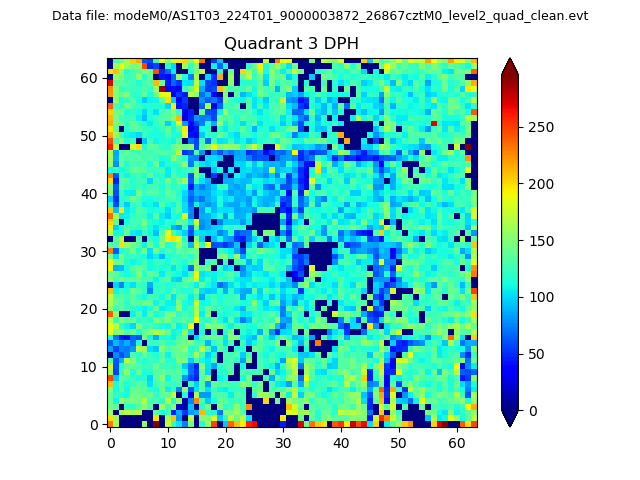 |
 |
Quadrant C |
| Plot type | Count rate plots | Images |
|---|---|---|
| Comparison with Poisson distribution Blue bars denote a histogram of data divided into 1 sec bins. Red curve is a Poisson curve with rate = median count rate of data. |
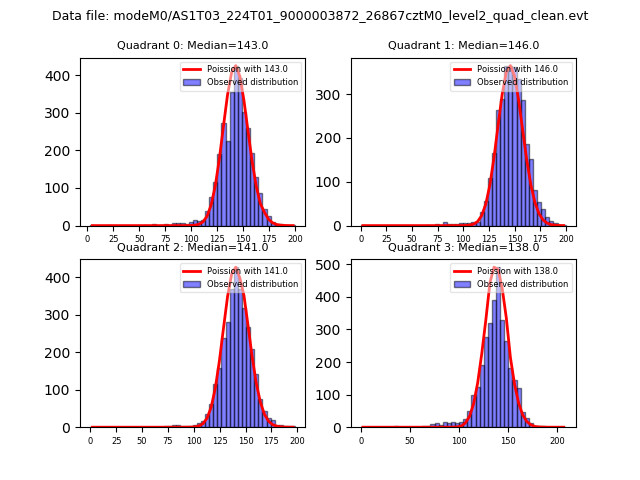 |
 |
| Quadrant-wise count rates Data is divided into 100 sec bins |
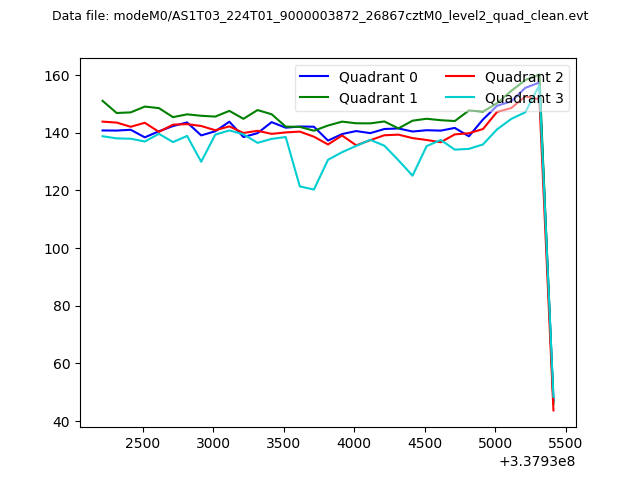 |
|
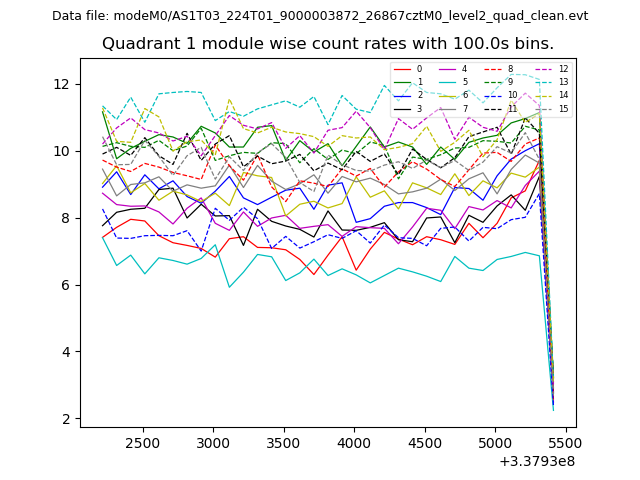
| Module-wise count rates for Quadrant A Data is divided into 100 sec bins |
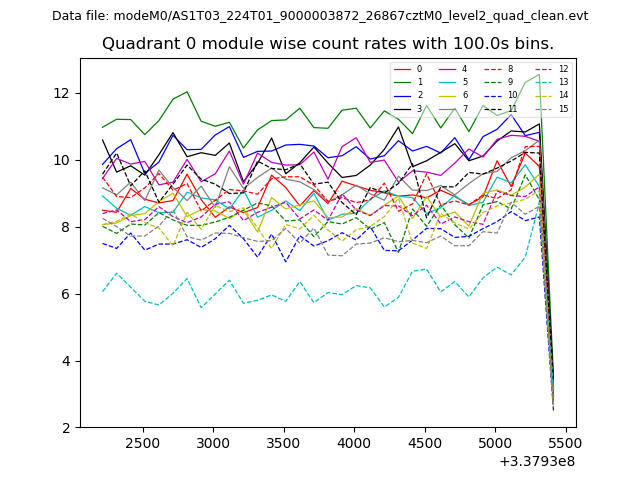 |
 |
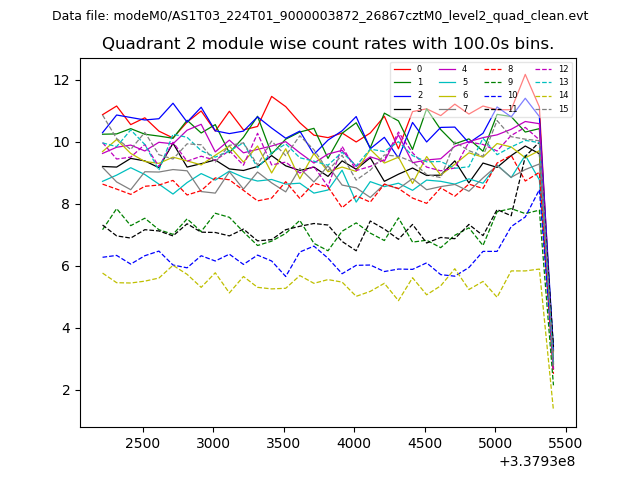
| Module-wise count rates for Quadrant B Data is divided into 100 sec bins |
 |
 |
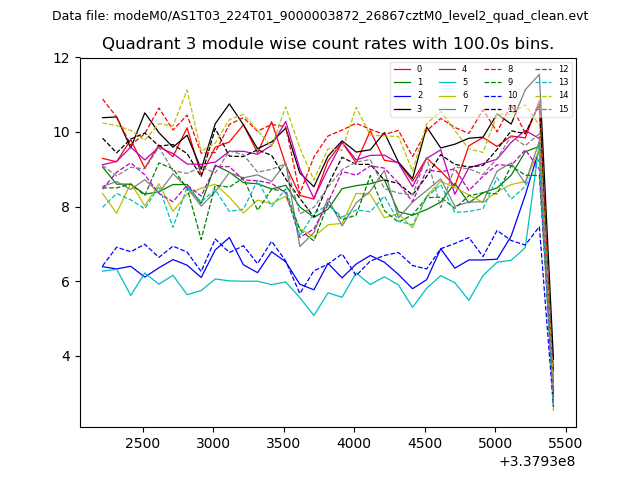
| Module-wise count rates for Quadrant C Data is divided into 100 sec bins |
 |
 |
| Module-wise count rates for Quadrant D Data is divided into 100 sec bins |
 |
 |
| Parameter | Plot |
|---|---|
| CZT HV Monitor | 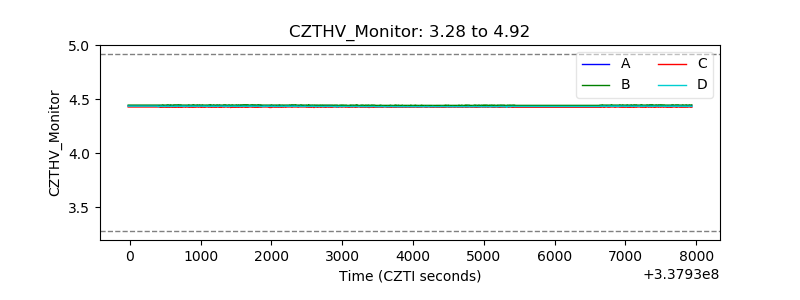 |
| D_VDD | 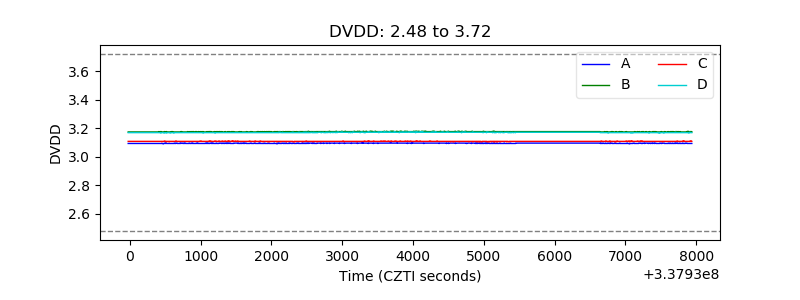 |
| Temperature 1 | 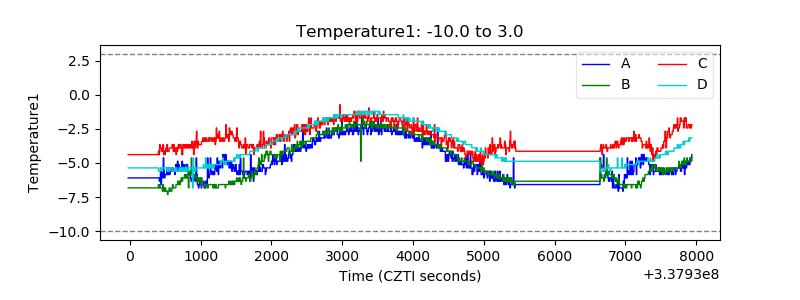 |
| Veto HV Monitor | 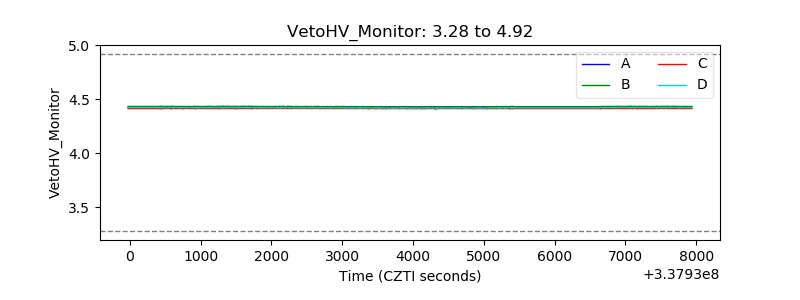 |
| Veto LLD | 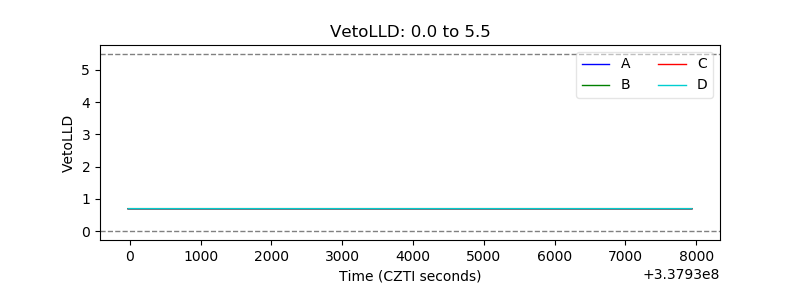 |
| Alpha Counter | 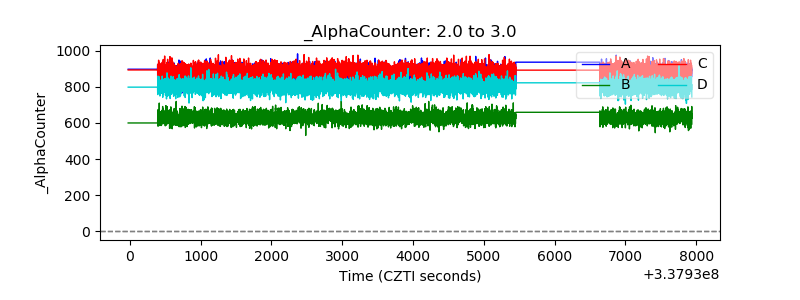 |
| _CPM_Rate | 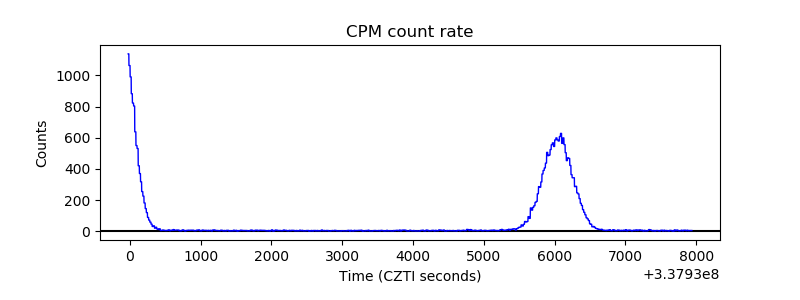 |
| CZT Counter |  |
| +2.5 Volts monitor |  |
| +5 Volts monitor | 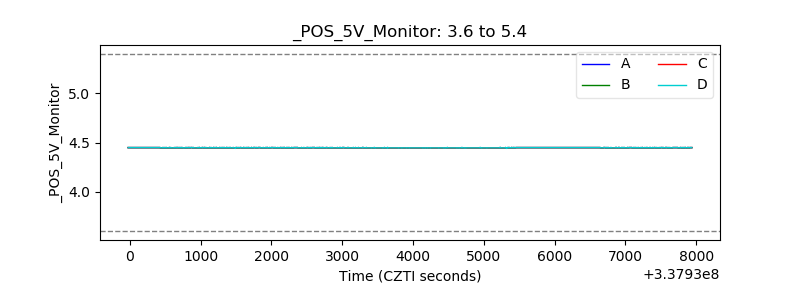 |
| _ROLL_ROT | 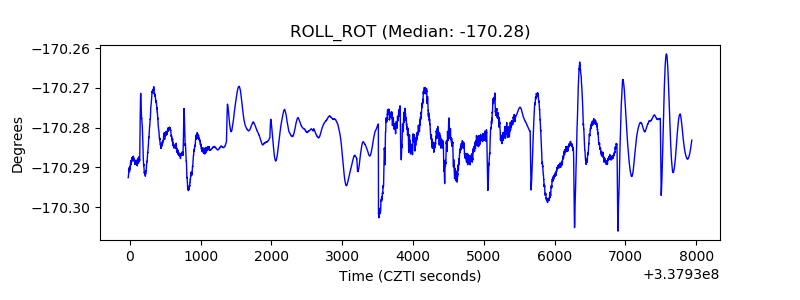 |
| _Roll_DEC | 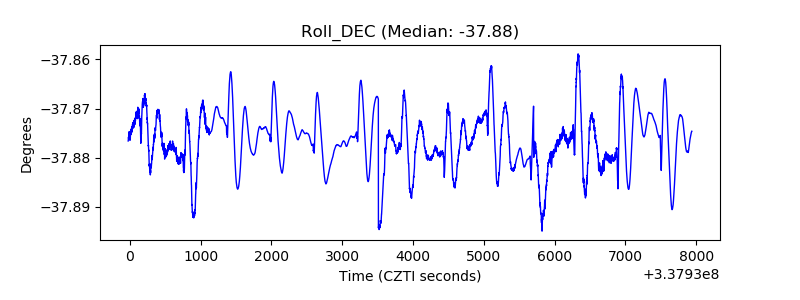 |
| _Roll_RA |  |
| Veto Counter | 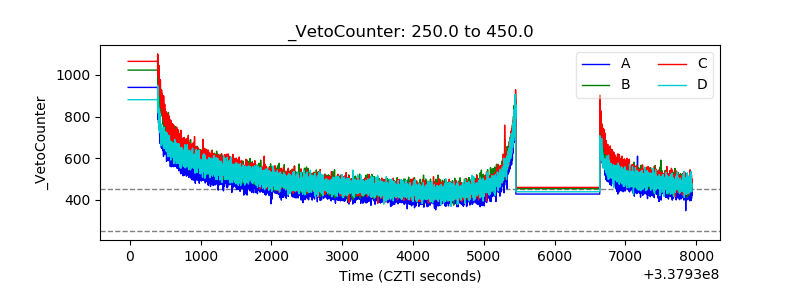 |