| Param | Original file | Final file |
|---|---|---|
| Filename | modeM0/AS1T03_224T01_9000003872_26868cztM0_level2.evt | modeM0/AS1T03_224T01_9000003872_26868cztM0_level2_quad_clean.evt |
| Size (bytes) | 602,380,800 | 90,325,440 |
| Size | 574.5 MB | 86.1 MB |
| Events in quadrant A | 4,035,424 | 570,359 |
| Events in quadrant B | 4,361,813 | 586,339 |
| Events in quadrant C | 3,585,285 | 568,415 |
| Events in quadrant D | 5,785,345 | 521,231 |
| Mode M0 | |||
|---|---|---|---|
| Quadrant | BADHDUFLAG | Total packets | Discarded packets |
| A | 0 | 16177 | 0 |
| B | 0 | 17168 | 0 |
| C | 0 | 14736 | 0 |
| D | 0 | 21681 | 0 |
| Mode M9 | |||
|---|---|---|---|
| Quadrant | BADHDUFLAG | Total packets | Discarded packets |
| A | 0 | 20 | 0 |
| B | 0 | 20 | 0 |
| C | 0 | 20 | 0 |
| D | 0 | 20 | 0 |
| Quadrant | Total seconds | Saturated seconds | Saturation percentage |
|---|---|---|---|
| A | 7008 | 225 | 3.210616% |
| B | 7008 | 271 | 3.867009% |
| C | 7008 | 213 | 3.039384% |
| D | 7008 | 738 | 10.530822% |
Noise dominated data is calculated using 1-second bins in cleaned event files. If a bin has >2000 counts, and if more than 50% of those come from <1% of pixels, then it is considered to be noise-dominated and hence unusable.
| Quadrant | # 1 sec bins | Bins with >0 counts | Bins with >2000 counts | High rate bins dominated by noise | Noise dominated (total time) | Noise dominated (detector-on time) | Marked lightcurve |
|---|---|---|---|---|---|---|---|
| A | 9018 | 7010 | 69 | 69 | 0.77% | 0.98% | 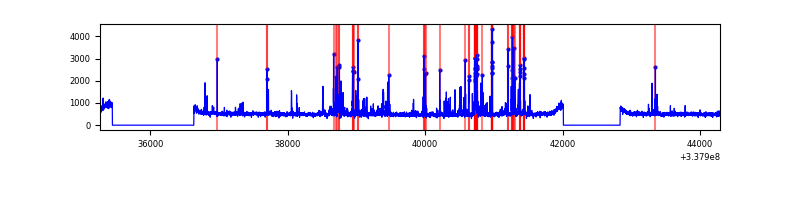 |
| B | 9018 | 7009 | 70 | 70 | 0.78% | 1.00% | 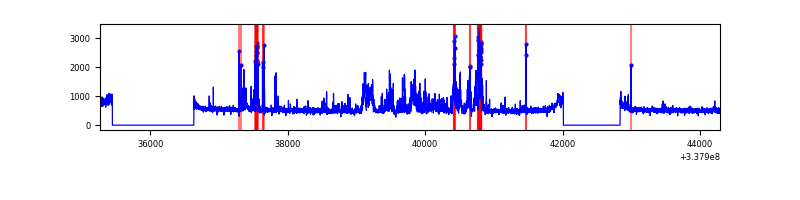 |
| C | 9018 | 7008 | 0 | 0 | 0.00% | 0.00% | 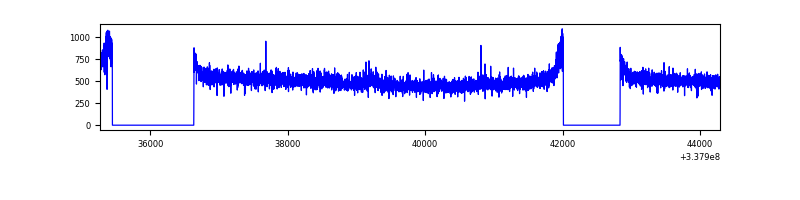 |
| D | 9018 | 7008 | 503 | 503 | 5.58% | 7.18% | 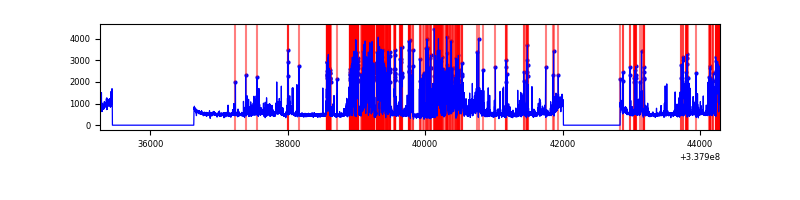 |
Top three noisy pixels from each quadrant. If the there are fewer than three noisy pixels in the level2.evt file, extra rows are filled as -1
| Pixel properties | Quadrant properties | ||||||
|---|---|---|---|---|---|---|---|
| Quadrant | DetID | PixID | Counts | Sigma | Mean | Median | Sigma |
| A | 0 | 13 | 534453 | 2930.24 | 907 | 887 | 182.1 |
| A | 13 | 254 | 11024 | 55.67 | 907 | 887 | 182.1 |
| A | 3 | 137 | 8571 | 42.2 | 907 | 887 | 182.1 |
| B | 10 | 246 | 390194 | 2284.66 | 902 | 879 | 170.4 |
| B | 0 | 189 | 317676 | 1859.1 | 902 | 879 | 170.4 |
| B | 0 | 190 | 112724 | 656.35 | 902 | 879 | 170.4 |
| C | 14 | 238 | 140178 | 677.68 | 877 | 881 | 205.6 |
| C | 3 | 233 | 18963 | 87.97 | 877 | 881 | 205.6 |
| C | 2 | 16 | 7511 | 32.25 | 877 | 881 | 205.6 |
| D | 7 | 80 | 1925835 | 9612.17 | 856 | 836 | 200.3 |
| D | 1 | 52 | 332750 | 1657.36 | 856 | 836 | 200.3 |
| D | 2 | 250 | 119630 | 593.18 | 856 | 836 | 200.3 |
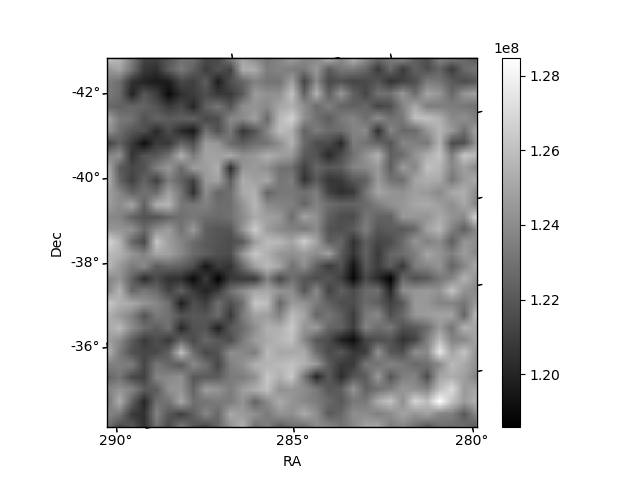
Histogram calculated using DETX and DETY for each event in the final _common_clean file
| Quadrant A |  |
 |
Quadrant B |
|---|---|---|---|
| Quadrant D |  |
 |
Quadrant C |
| Plot type | Count rate plots | Images |
|---|---|---|
| Comparison with Poisson distribution Blue bars denote a histogram of data divided into 1 sec bins. Red curve is a Poisson curve with rate = median count rate of data. |
 |
 |
| Quadrant-wise count rates Data is divided into 100 sec bins |
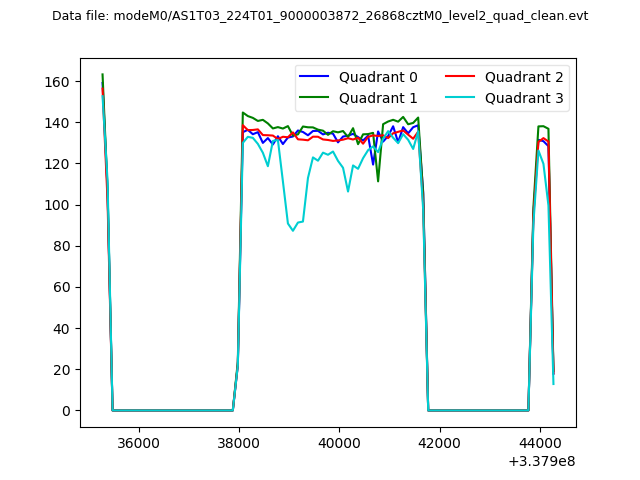 |
|
| Module-wise count rates for Quadrant A Data is divided into 100 sec bins |
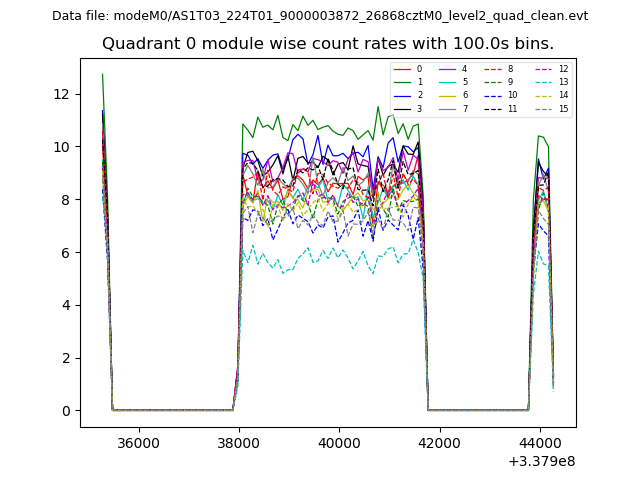 |
 |
| Module-wise count rates for Quadrant B Data is divided into 100 sec bins |
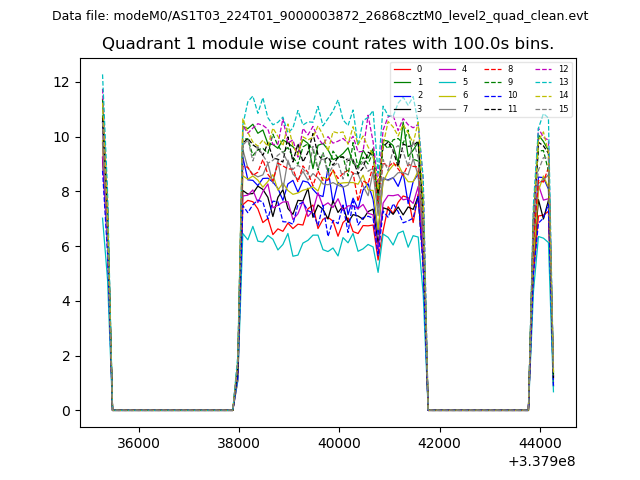 |
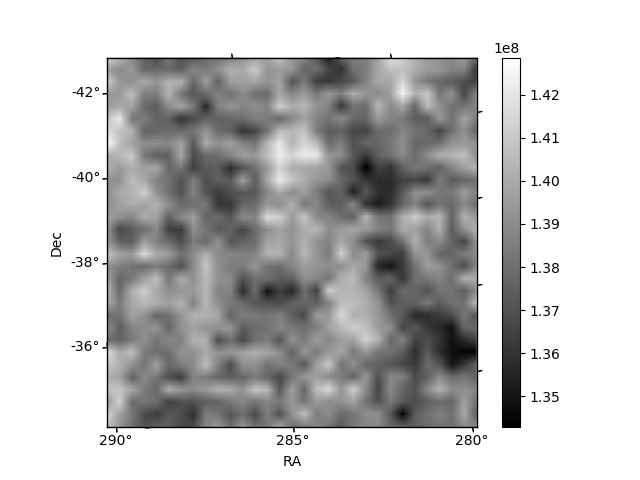 |
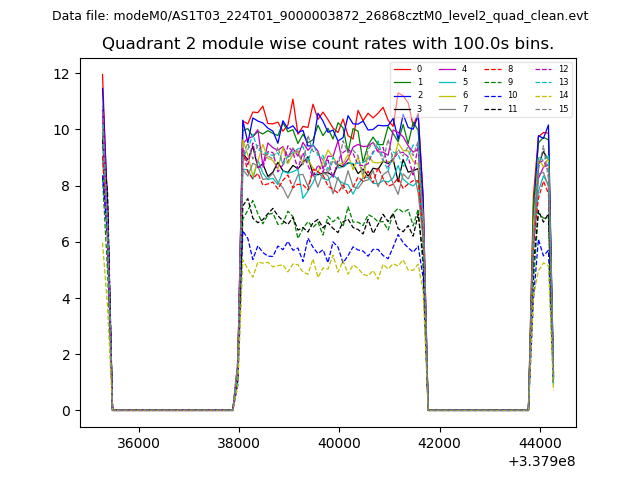
| Module-wise count rates for Quadrant C Data is divided into 100 sec bins |
 |
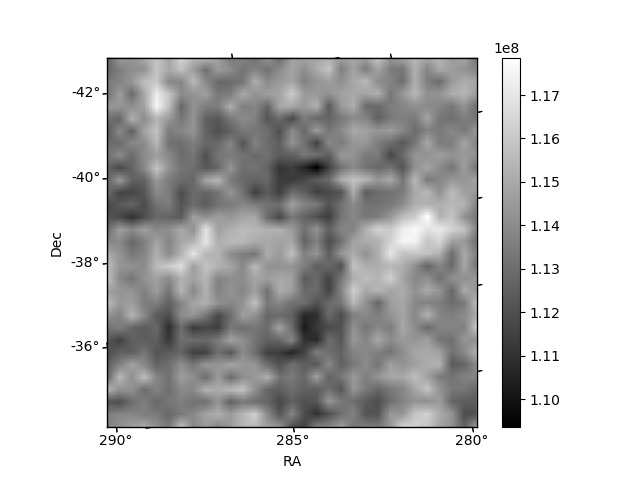 |
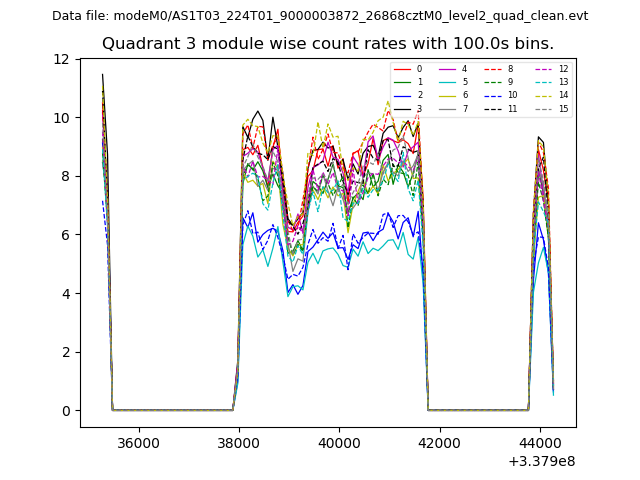
| Module-wise count rates for Quadrant D Data is divided into 100 sec bins |
 |
 |
| Parameter | Plot |
|---|---|
| CZT HV Monitor | 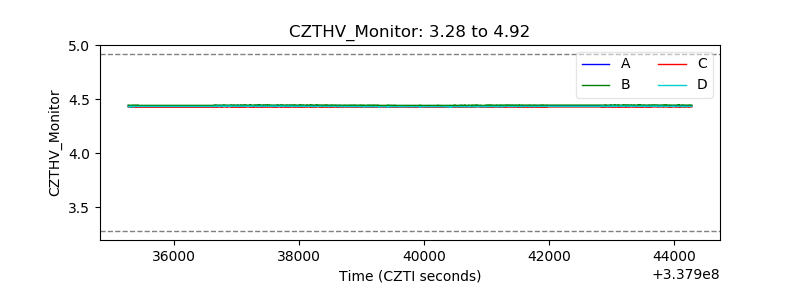 |
| D_VDD | 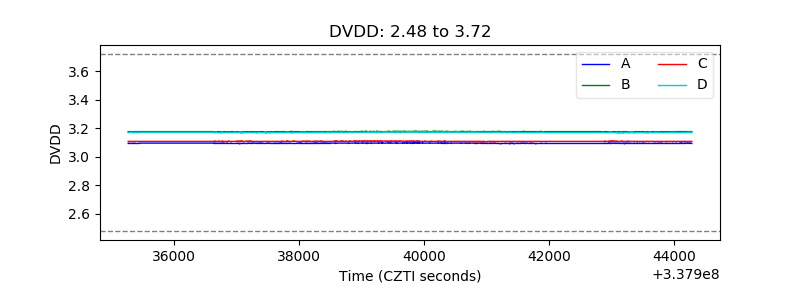 |
| Temperature 1 | 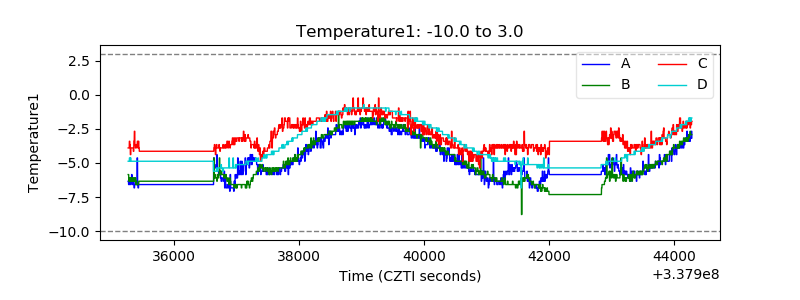 |
| Veto HV Monitor | 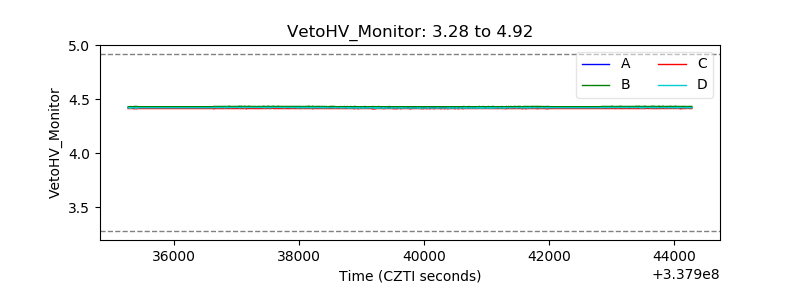 |
| Veto LLD | 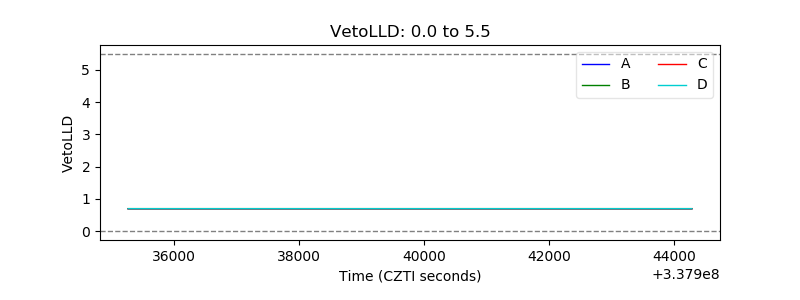 |
| Alpha Counter | 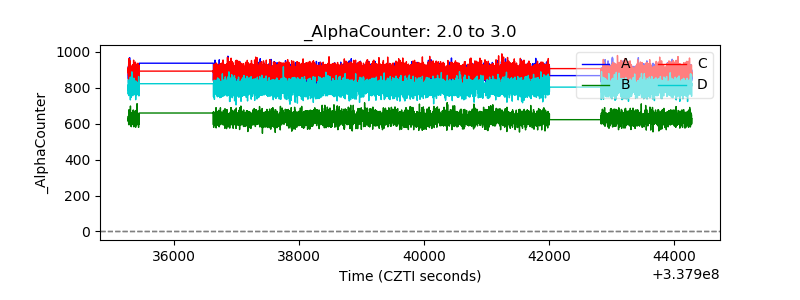 |
| _CPM_Rate | 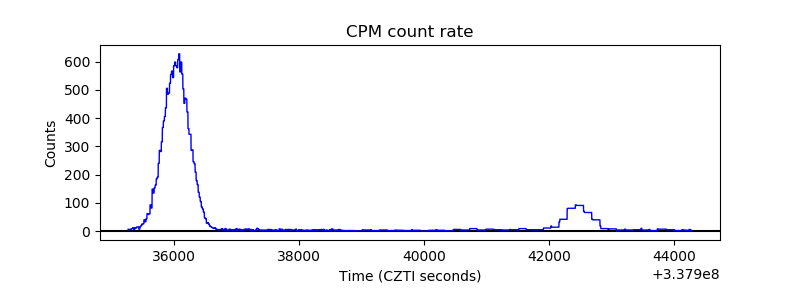 |
| CZT Counter |  |
| +2.5 Volts monitor |  |
| +5 Volts monitor | 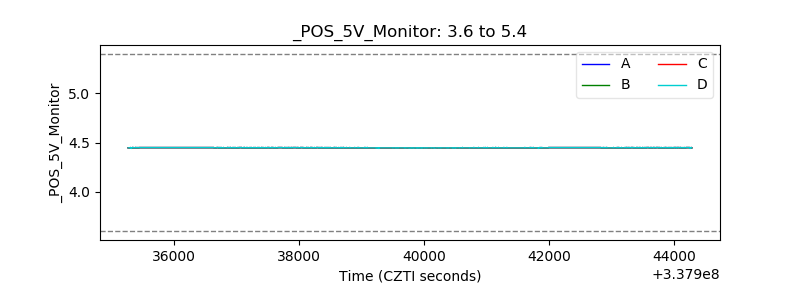 |
| _ROLL_ROT |  |
| _Roll_DEC |  |
| _Roll_RA |  |
| Veto Counter | 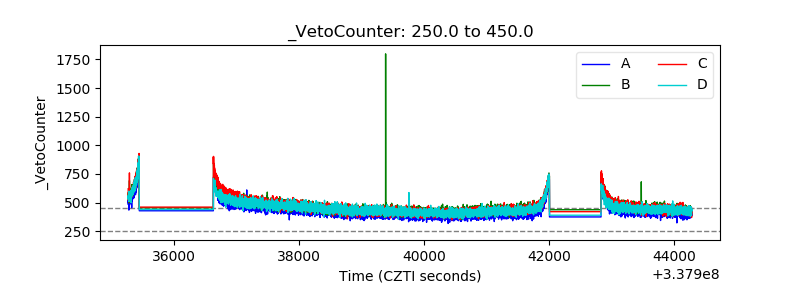 |