| Param | Original file | Final file |
|---|---|---|
| Filename | modeM0/AS1T03_224T01_9000003872_26869cztM0_level2.evt | modeM0/AS1T03_224T01_9000003872_26869cztM0_level2_quad_clean.evt |
| Size (bytes) | 575,403,840 | 92,784,960 |
| Size | 548.7 MB | 88.5 MB |
| Events in quadrant A | 3,929,595 | 577,746 |
| Events in quadrant B | 4,112,528 | 589,547 |
| Events in quadrant C | 3,631,708 | 575,800 |
| Events in quadrant D | 5,249,577 | 550,847 |
| Mode M0 | |||
|---|---|---|---|
| Quadrant | BADHDUFLAG | Total packets | Discarded packets |
| A | 0 | 16291 | 0 |
| B | 0 | 16716 | 0 |
| C | 0 | 15397 | 0 |
| D | 0 | 20472 | 0 |
| Mode M9 | |||
|---|---|---|---|
| Quadrant | BADHDUFLAG | Total packets | Discarded packets |
| A | 0 | 8 | 0 |
| B | 0 | 9 | 0 |
| C | 0 | 9 | 0 |
| D | 0 | 9 | 0 |
| Quadrant | Total seconds | Saturated seconds | Saturation percentage |
|---|---|---|---|
| A | 7419 | 196 | 2.641865% |
| B | 7419 | 249 | 3.356247% |
| C | 7419 | 224 | 3.019275% |
| D | 7419 | 483 | 6.510311% |
Noise dominated data is calculated using 1-second bins in cleaned event files. If a bin has >2000 counts, and if more than 50% of those come from <1% of pixels, then it is considered to be noise-dominated and hence unusable.
| Quadrant | # 1 sec bins | Bins with >0 counts | Bins with >2000 counts | High rate bins dominated by noise | Noise dominated (total time) | Noise dominated (detector-on time) | Marked lightcurve |
|---|---|---|---|---|---|---|---|
| A | 7729 | 7420 | 28 | 28 | 0.36% | 0.38% | 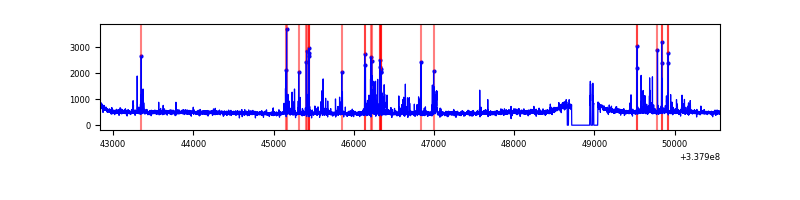 |
| B | 7729 | 7420 | 60 | 60 | 0.78% | 0.81% | 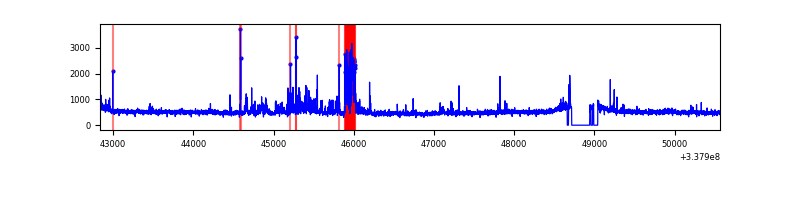 |
| C | 7729 | 7421 | 1 | 1 | 0.01% | 0.01% | 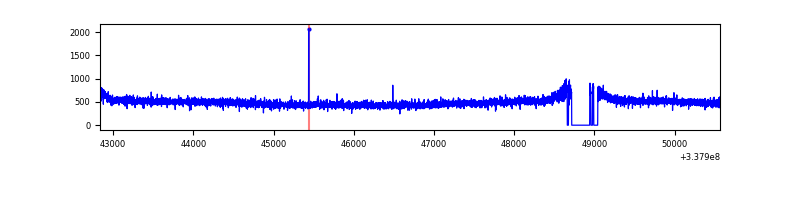 |
| D | 7729 | 7422 | 296 | 296 | 3.83% | 3.99% | 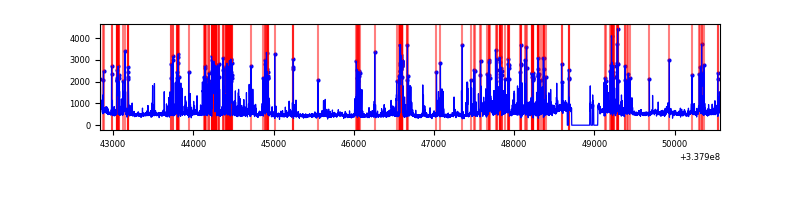 |
Top three noisy pixels from each quadrant. If the there are fewer than three noisy pixels in the level2.evt file, extra rows are filled as -1
| Pixel properties | Quadrant properties | ||||||
|---|---|---|---|---|---|---|---|
| Quadrant | DetID | PixID | Counts | Sigma | Mean | Median | Sigma |
| A | 0 | 13 | 332050 | 1776.62 | 926 | 905 | 186.4 |
| A | 4 | 2 | 18166 | 92.61 | 926 | 905 | 186.4 |
| A | 12 | 96 | 11641 | 57.6 | 926 | 905 | 186.4 |
| B | 0 | 190 | 344095 | 1954.29 | 920 | 898 | 175.6 |
| B | 10 | 246 | 75130 | 422.71 | 920 | 898 | 175.6 |
| B | 0 | 189 | 62069 | 348.33 | 920 | 898 | 175.6 |
| C | 14 | 238 | 143572 | 675.31 | 894 | 897 | 211.3 |
| C | 13 | 61 | 6028 | 24.29 | 894 | 897 | 211.3 |
| C | 15 | 208 | 5218 | 20.45 | 894 | 897 | 211.3 |
| D | 1 | 52 | 741518 | 3545.37 | 885 | 864 | 208.9 |
| D | 7 | 80 | 636298 | 3041.7 | 885 | 864 | 208.9 |
| D | 11 | 176 | 167093 | 795.71 | 885 | 864 | 208.9 |
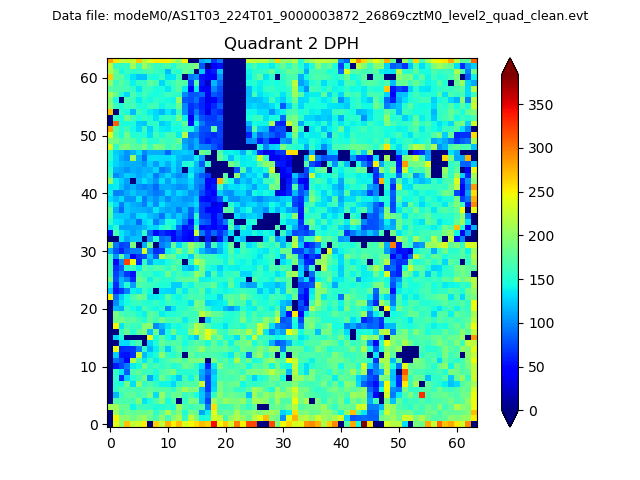
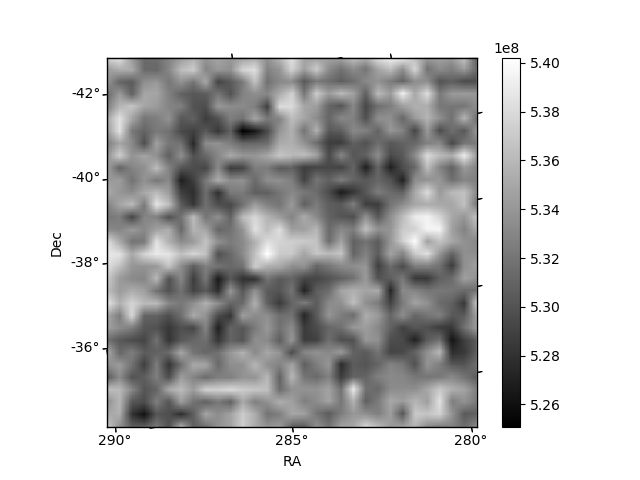
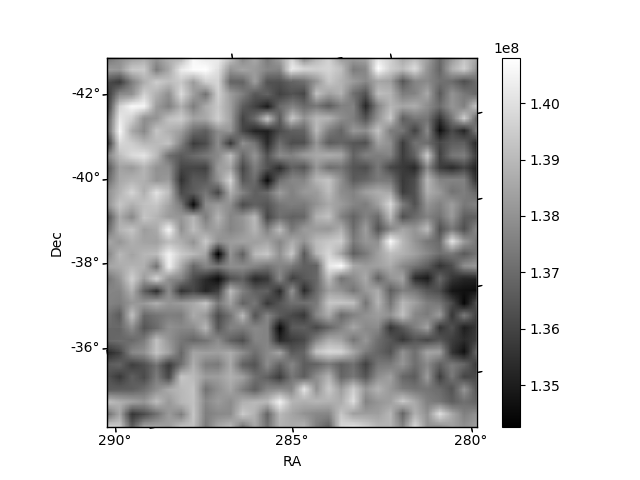
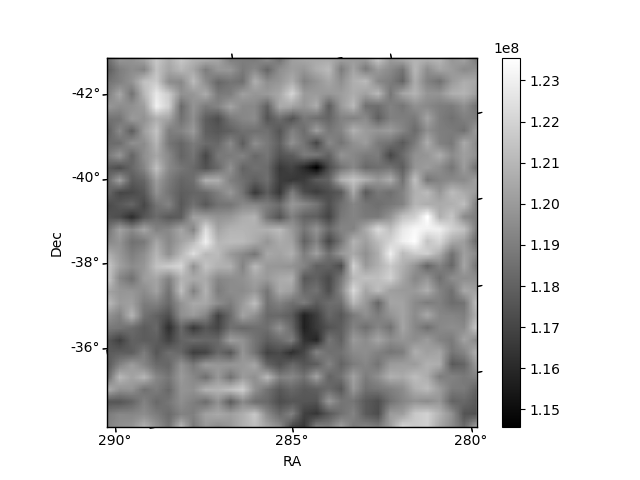
Histogram calculated using DETX and DETY for each event in the final _common_clean file
| Quadrant A | 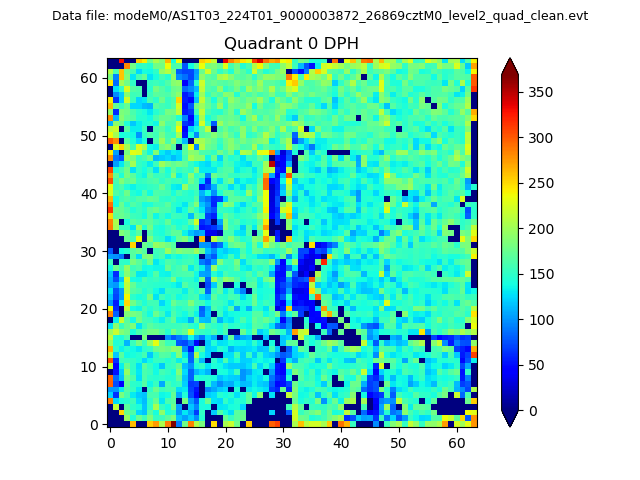 |
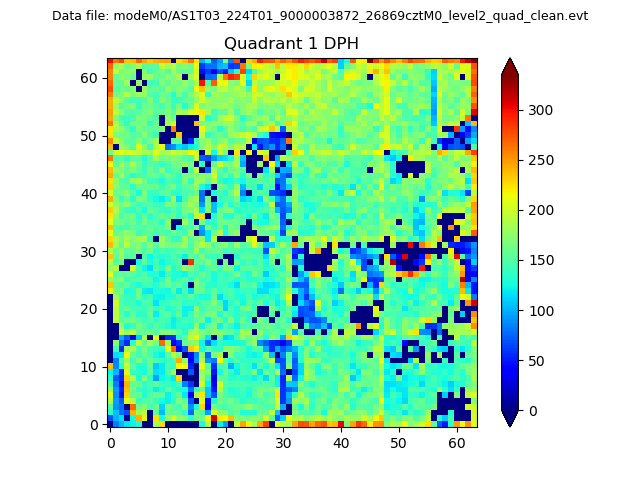 |
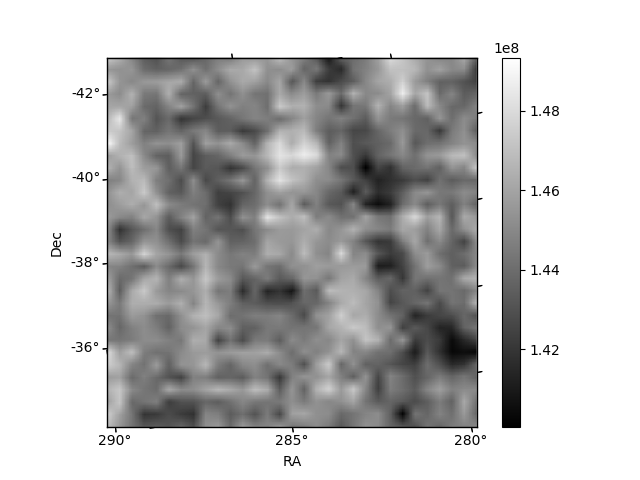
Quadrant B |
|---|---|---|---|
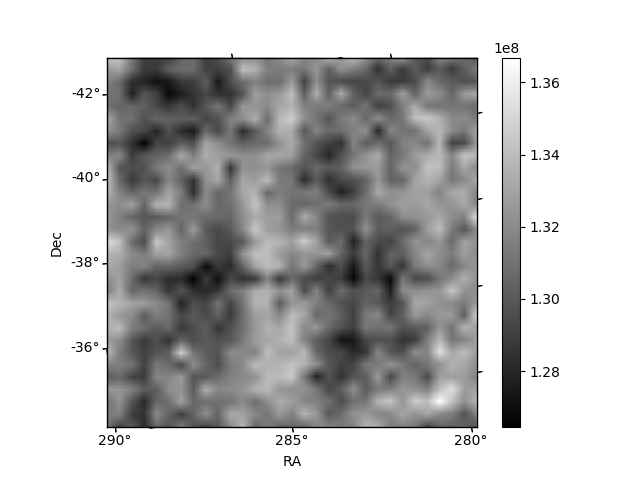
| Quadrant D | 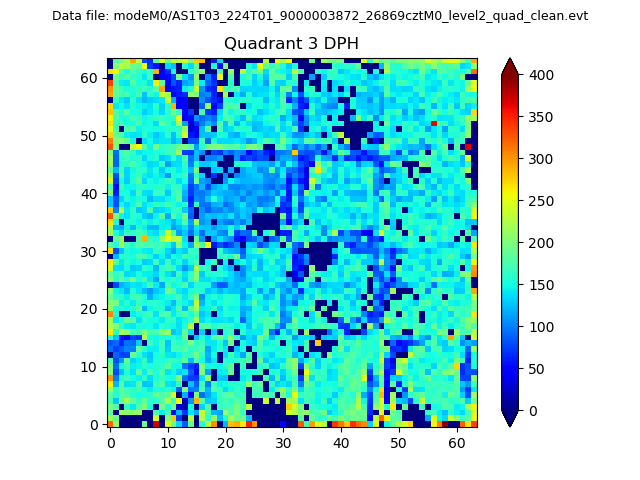 |
 |
Quadrant C |
| Plot type | Count rate plots | Images |
|---|---|---|
| Comparison with Poisson distribution Blue bars denote a histogram of data divided into 1 sec bins. Red curve is a Poisson curve with rate = median count rate of data. |
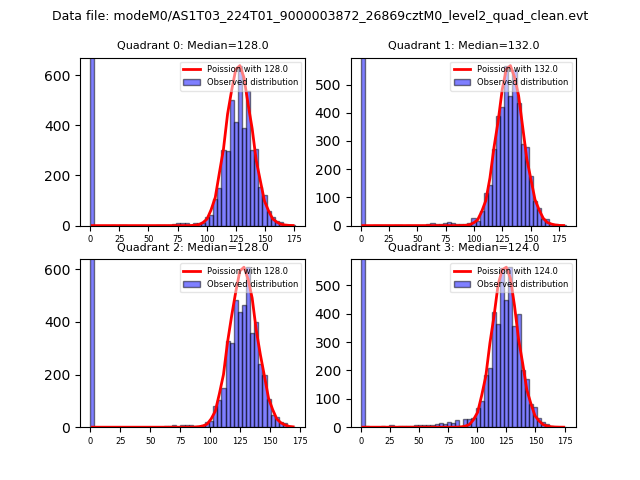 |
 |
| Quadrant-wise count rates Data is divided into 100 sec bins |
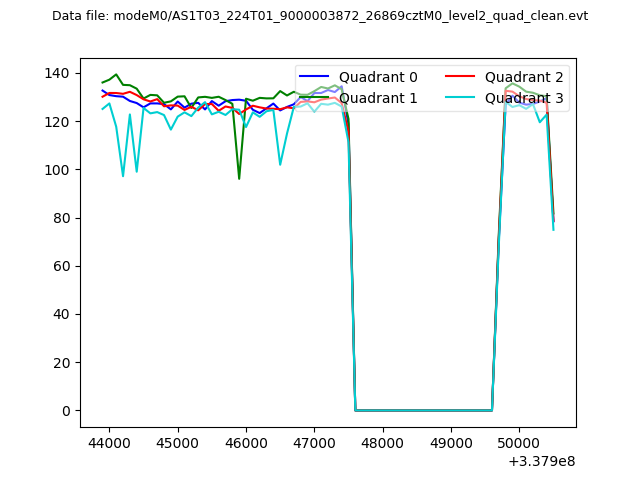 |
|
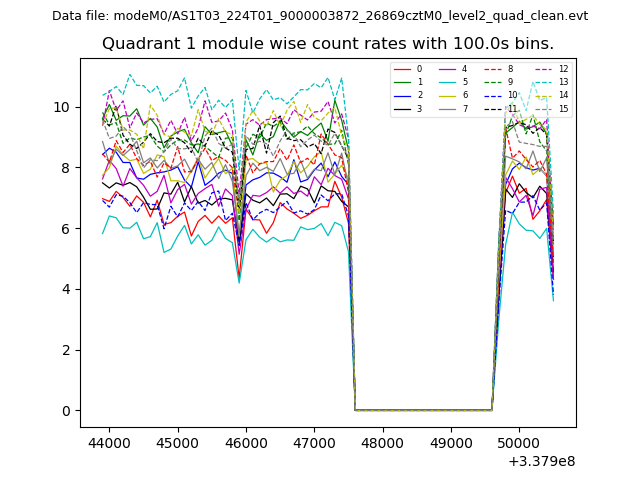
| Module-wise count rates for Quadrant A Data is divided into 100 sec bins |
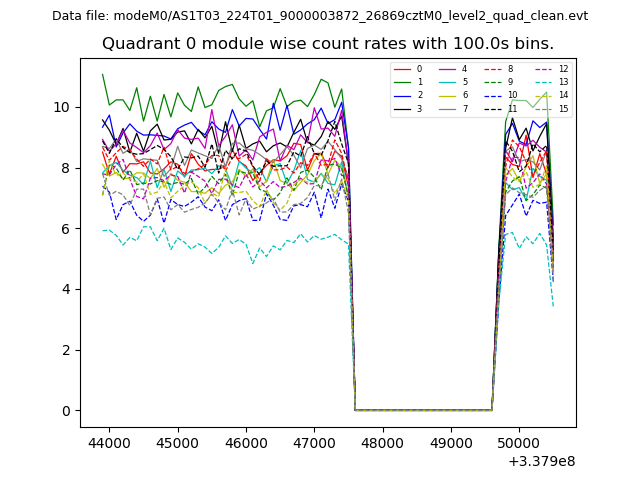 |
 |
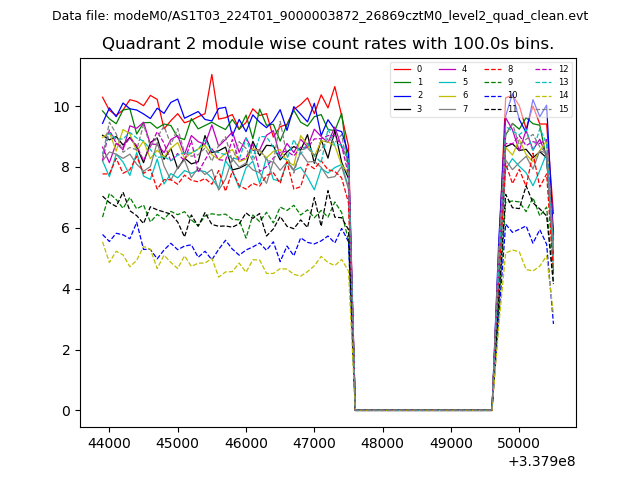
| Module-wise count rates for Quadrant B Data is divided into 100 sec bins |
 |
 |
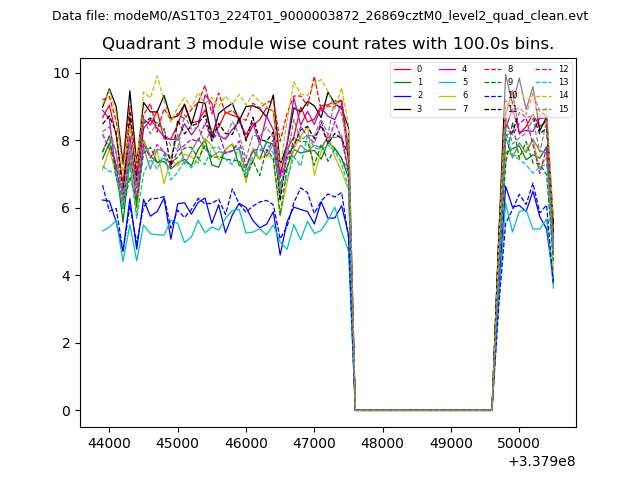
| Module-wise count rates for Quadrant C Data is divided into 100 sec bins |
 |
 |
| Module-wise count rates for Quadrant D Data is divided into 100 sec bins |
 |
 |
| Parameter | Plot |
|---|---|
| CZT HV Monitor | 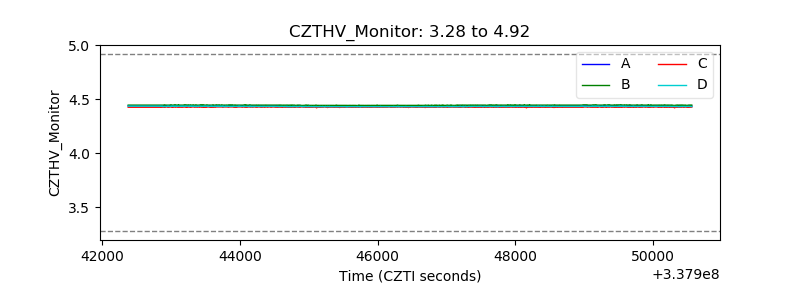 |
| D_VDD | 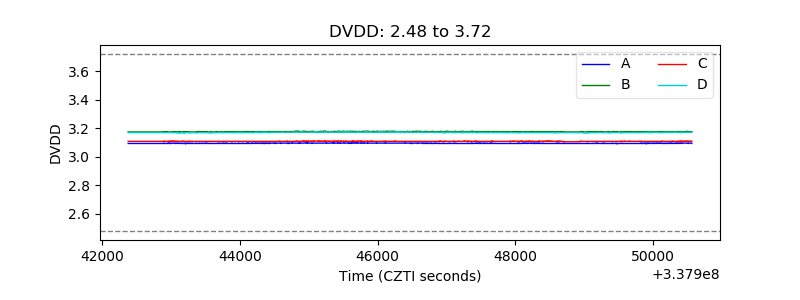 |
| Temperature 1 | 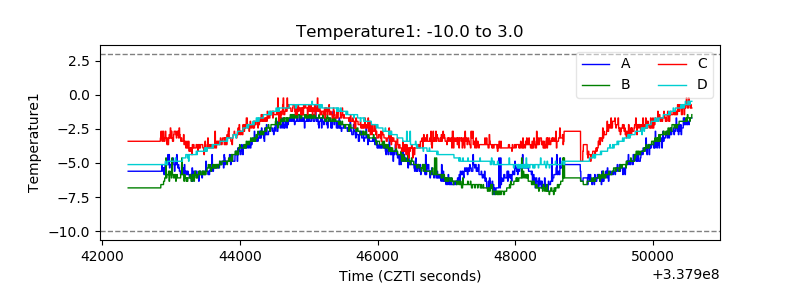 |
| Veto HV Monitor | 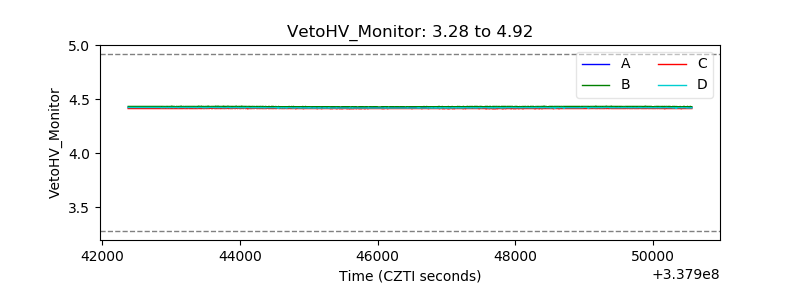 |
| Veto LLD | 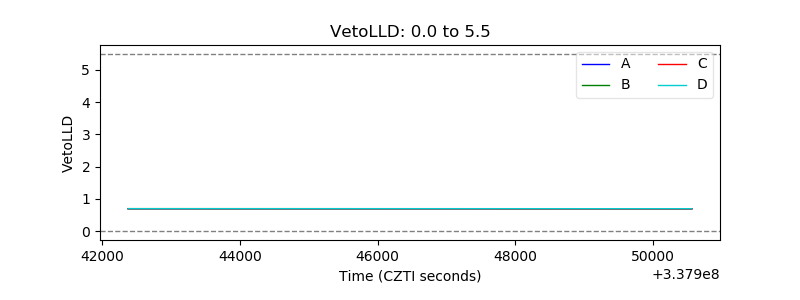 |
| Alpha Counter | 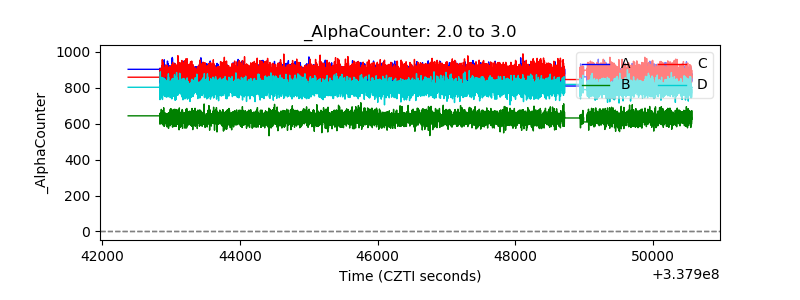 |
| _CPM_Rate | 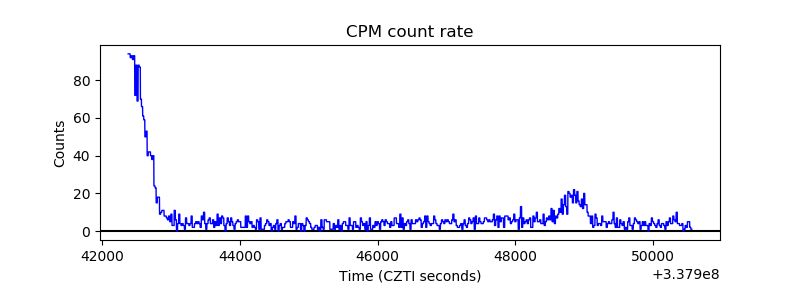 |
| CZT Counter | 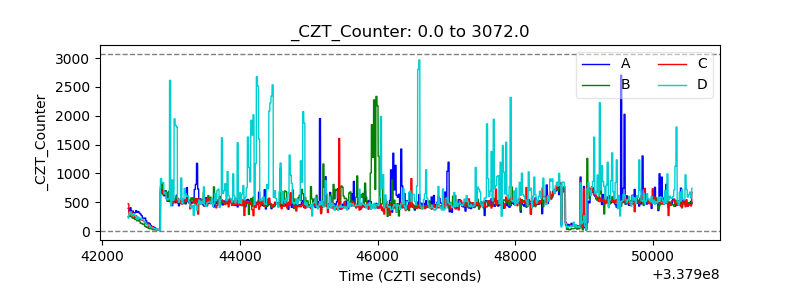 |
| +2.5 Volts monitor | 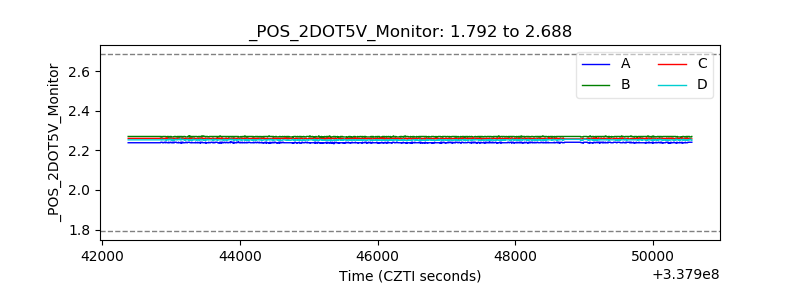 |
| +5 Volts monitor |  |
| _ROLL_ROT | 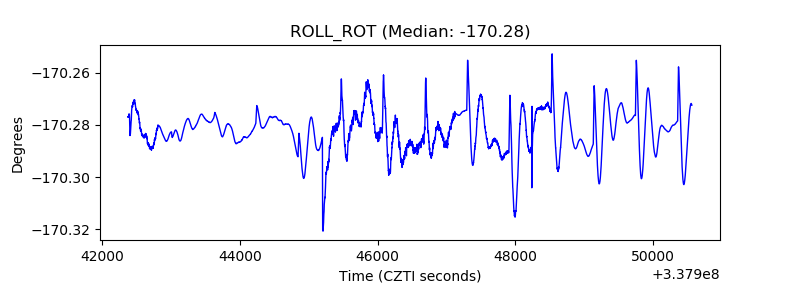 |
| _Roll_DEC | 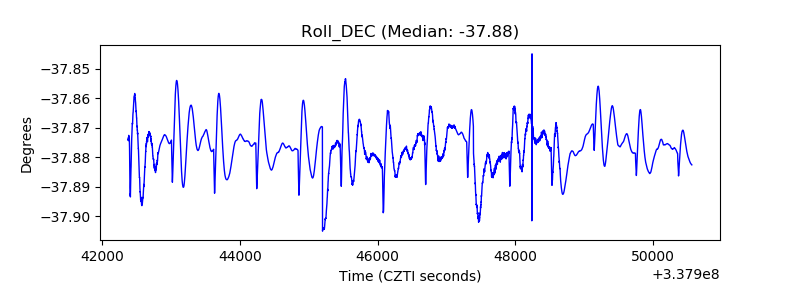 |
| _Roll_RA | 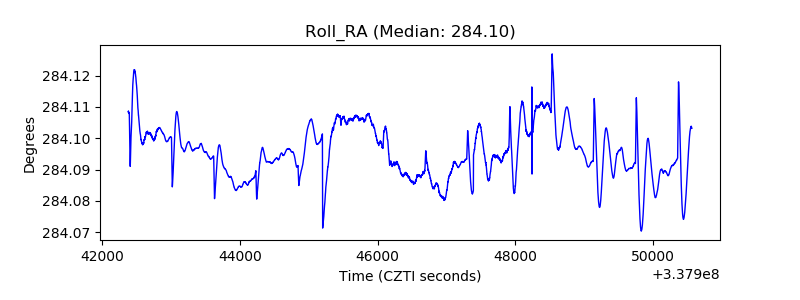 |
| Veto Counter | 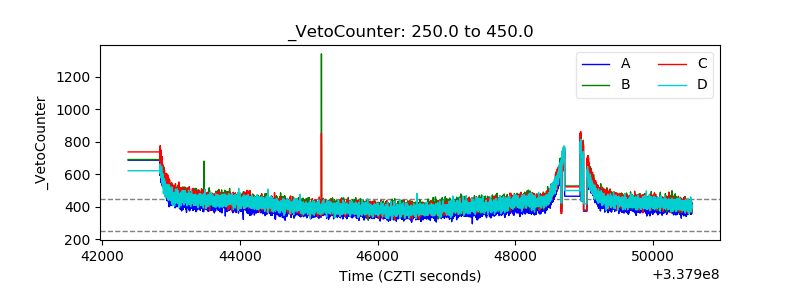 |