| Param | Original file | Final file |
|---|---|---|
| Filename | modeM0/AS1T03_224T01_9000003872_26870cztM0_level2.evt | modeM0/AS1T03_224T01_9000003872_26870cztM0_level2_quad_clean.evt |
| Size (bytes) | 592,776,000 | 99,584,640 |
| Size | 565.3 MB | 95.0 MB |
| Events in quadrant A | 4,375,542 | 621,901 |
| Events in quadrant B | 3,802,986 | 649,653 |
| Events in quadrant C | 3,587,554 | 629,715 |
| Events in quadrant D | 5,687,112 | 602,231 |
| Mode M0 | |||
|---|---|---|---|
| Quadrant | BADHDUFLAG | Total packets | Discarded packets |
| A | 0 | 17775 | 0 |
| B | 0 | 15842 | 0 |
| C | 0 | 15288 | 0 |
| D | 0 | 21692 | 0 |
| Mode M9 | |||
|---|---|---|---|
| Quadrant | BADHDUFLAG | Total packets | Discarded packets |
| A | 0 | 1 | 0 |
| B | 0 | 1 | 0 |
| C | 0 | 1 | 0 |
| D | 0 | 1 | 0 |
| Quadrant | Total seconds | Saturated seconds | Saturation percentage |
|---|---|---|---|
| A | 7364 | 468 | 6.355242% |
| B | 7364 | 256 | 3.476372% |
| C | 7365 | 209 | 2.837746% |
| D | 7365 | 497 | 6.748133% |
Noise dominated data is calculated using 1-second bins in cleaned event files. If a bin has >2000 counts, and if more than 50% of those come from <1% of pixels, then it is considered to be noise-dominated and hence unusable.
| Quadrant | # 1 sec bins | Bins with >0 counts | Bins with >2000 counts | High rate bins dominated by noise | Noise dominated (total time) | Noise dominated (detector-on time) | Marked lightcurve |
|---|---|---|---|---|---|---|---|
| A | 7419 | 7364 | 150 | 150 | 2.02% | 2.04% | 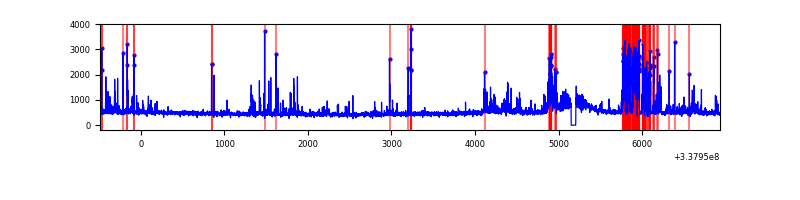 |
| B | 7419 | 7365 | 25 | 25 | 0.34% | 0.34% | 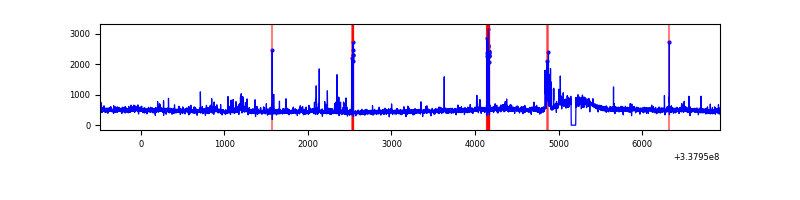 |
| C | 7420 | 7366 | 0 | 0 | 0.00% | 0.00% | 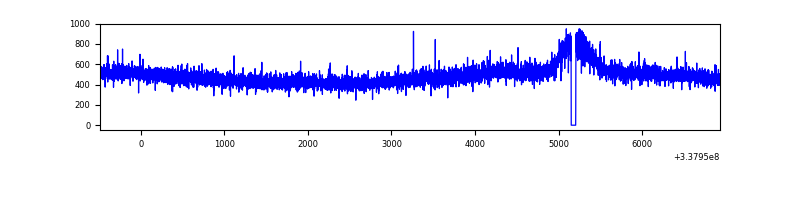 |
| D | 7419 | 7365 | 300 | 300 | 4.04% | 4.07% | 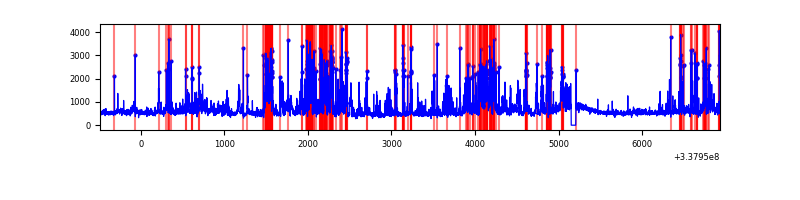 |
Top three noisy pixels from each quadrant. If the there are fewer than three noisy pixels in the level2.evt file, extra rows are filled as -1
| Pixel properties | Quadrant properties | ||||||
|---|---|---|---|---|---|---|---|
| Quadrant | DetID | PixID | Counts | Sigma | Mean | Median | Sigma |
| A | 0 | 13 | 886591 | 4852.33 | 901 | 881 | 182.5 |
| A | 13 | 254 | 11733 | 59.45 | 901 | 881 | 182.5 |
| A | 3 | 137 | 9002 | 44.49 | 901 | 881 | 182.5 |
| B | 3 | 64 | 91792 | 514.77 | 910 | 884 | 176.6 |
| B | 10 | 246 | 78283 | 438.27 | 910 | 884 | 176.6 |
| B | 0 | 189 | 35000 | 193.18 | 910 | 884 | 176.6 |
| C | 14 | 238 | 140113 | 668.29 | 882 | 886 | 208.3 |
| C | 13 | 61 | 6062 | 24.84 | 882 | 886 | 208.3 |
| C | 8 | 128 | 5102 | 20.24 | 882 | 886 | 208.3 |
| D | 7 | 80 | 1172795 | 5711.68 | 872 | 850 | 205.2 |
| D | 1 | 52 | 384122 | 1867.94 | 872 | 850 | 205.2 |
| D | 12 | 227 | 309817 | 1505.8 | 872 | 850 | 205.2 |
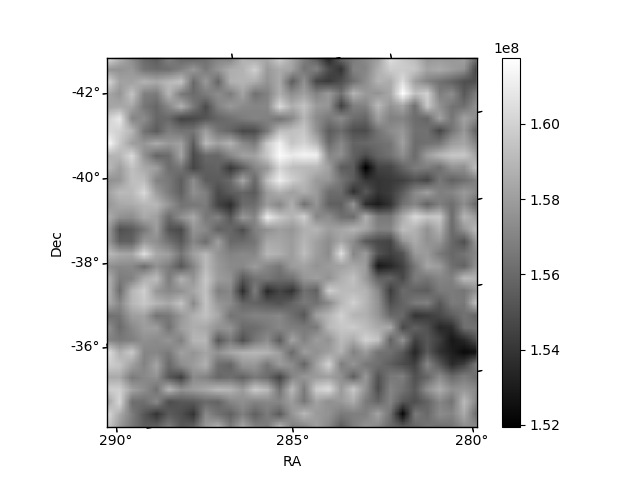
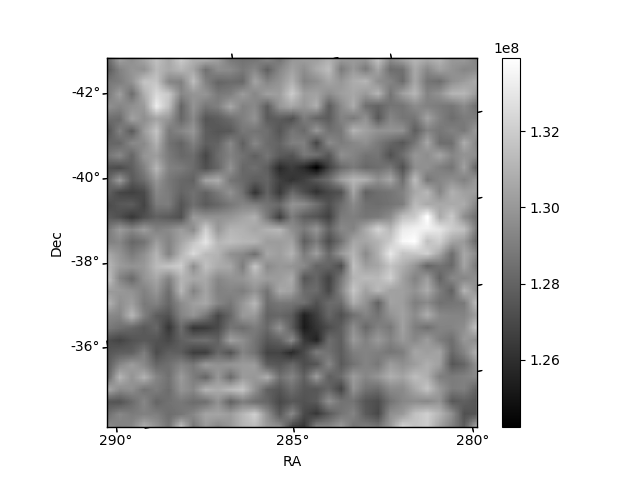
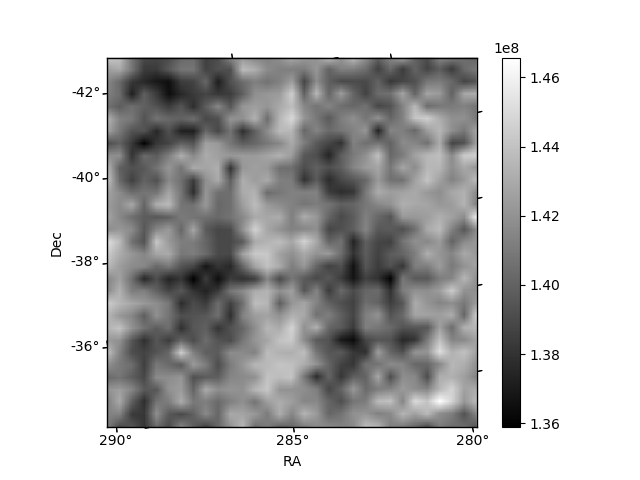
Histogram calculated using DETX and DETY for each event in the final _common_clean file
| Quadrant A | 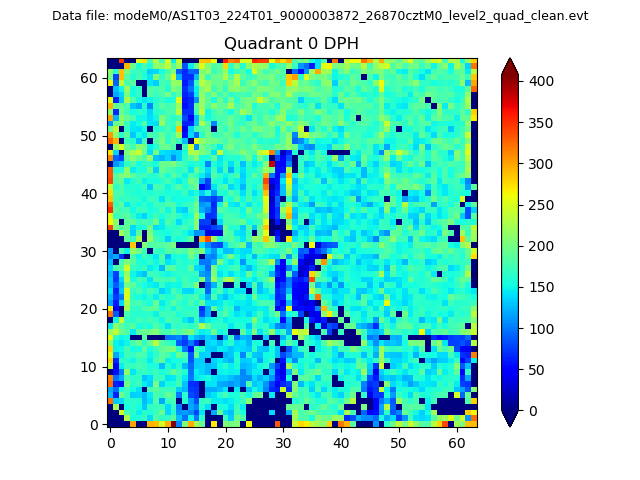 |
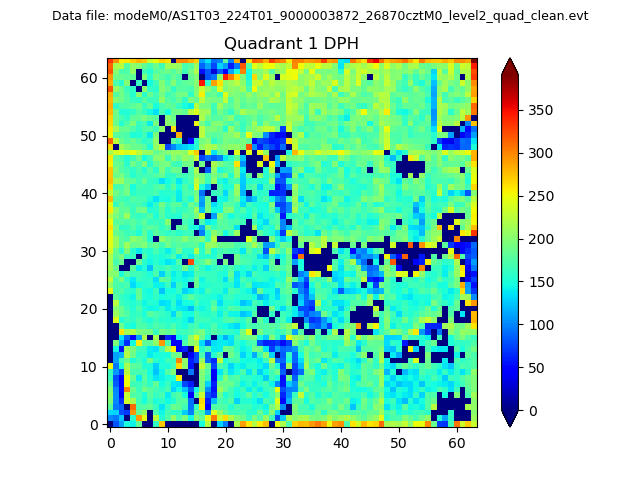 |
Quadrant B |
|---|---|---|---|
| Quadrant D | 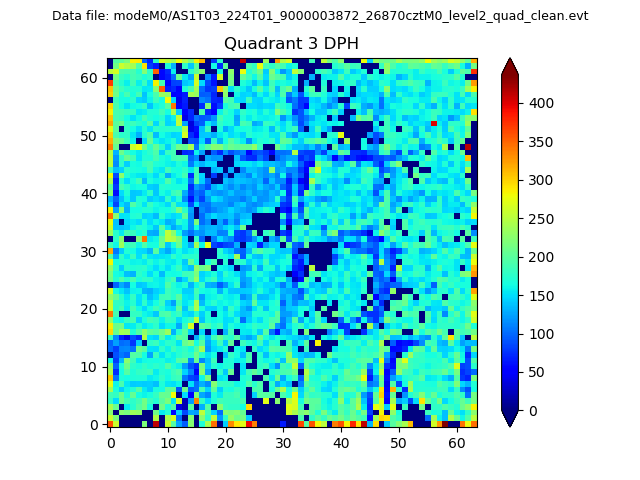 |
 |
Quadrant C |
| Plot type | Count rate plots | Images |
|---|---|---|
| Comparison with Poisson distribution Blue bars denote a histogram of data divided into 1 sec bins. Red curve is a Poisson curve with rate = median count rate of data. |
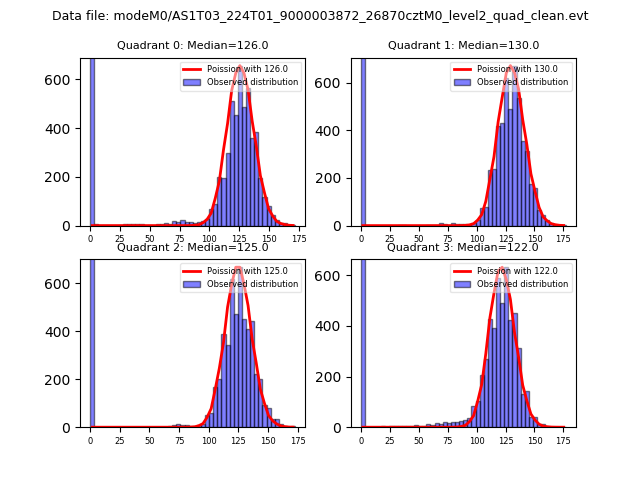 |
 |
| Quadrant-wise count rates Data is divided into 100 sec bins |
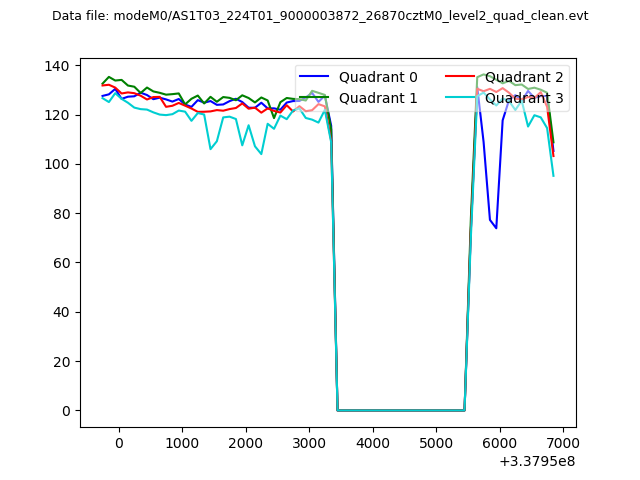 |
|
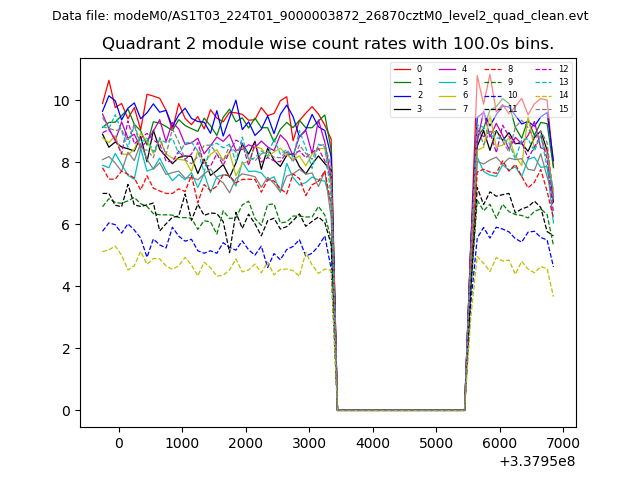
| Module-wise count rates for Quadrant A Data is divided into 100 sec bins |
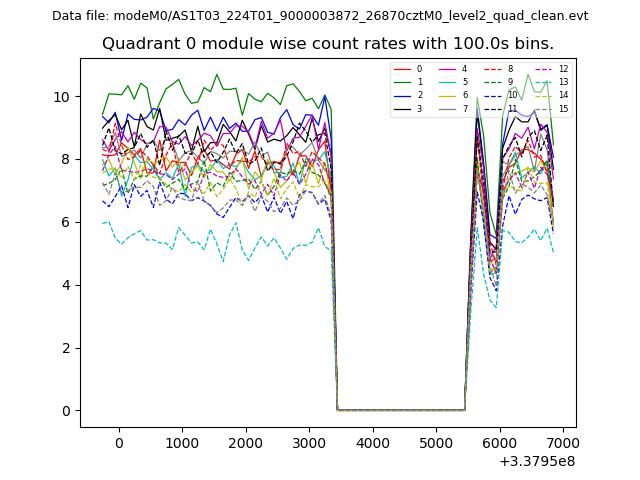 |
 |
| Module-wise count rates for Quadrant B Data is divided into 100 sec bins |
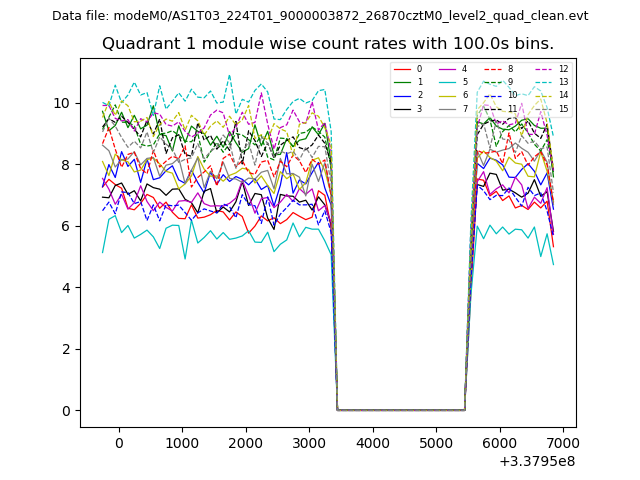 |
 |
| Module-wise count rates for Quadrant C Data is divided into 100 sec bins |
 |
 |
| Module-wise count rates for Quadrant D Data is divided into 100 sec bins |
 |
 |
| Parameter | Plot |
|---|---|
| CZT HV Monitor | 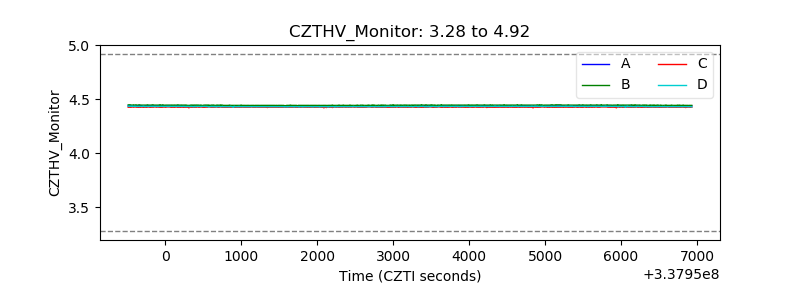 |
| D_VDD | 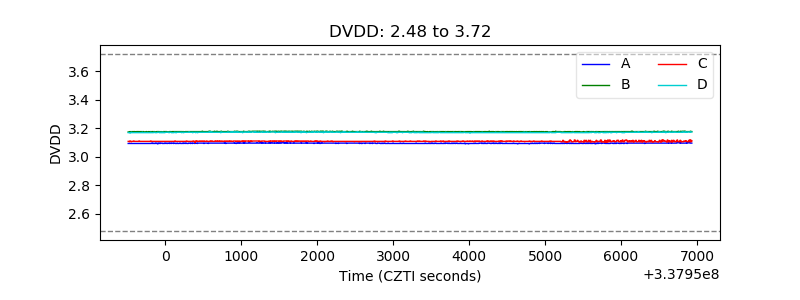 |
| Temperature 1 | 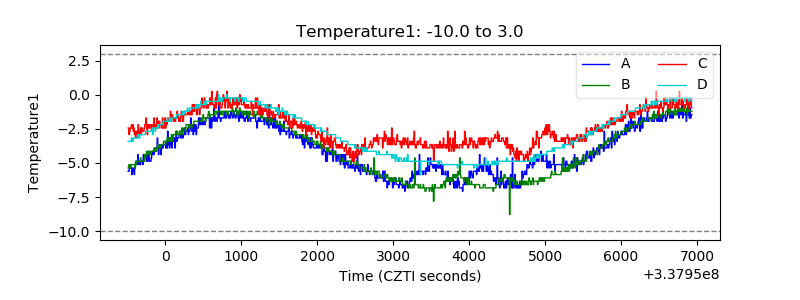 |
| Veto HV Monitor | 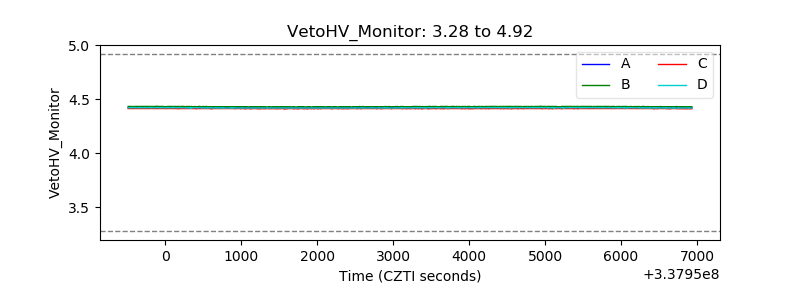 |
| Veto LLD | 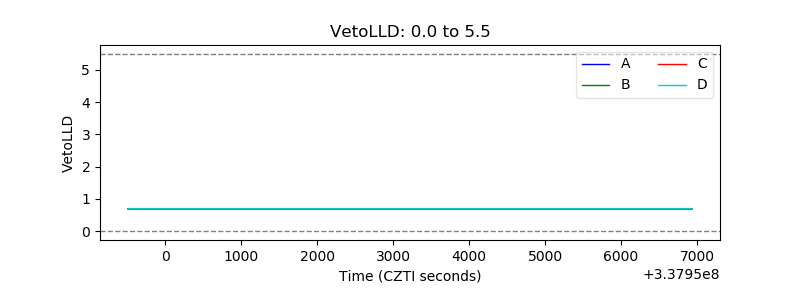 |
| Alpha Counter | 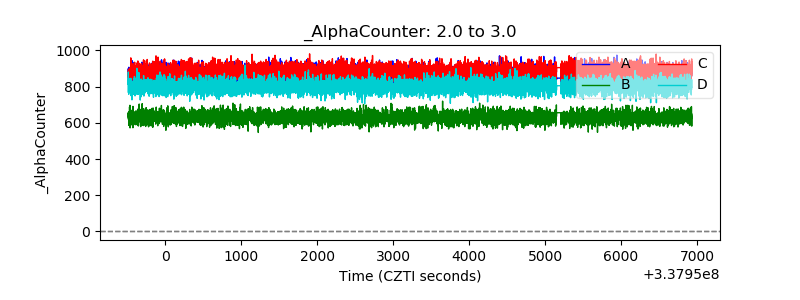 |
| _CPM_Rate | 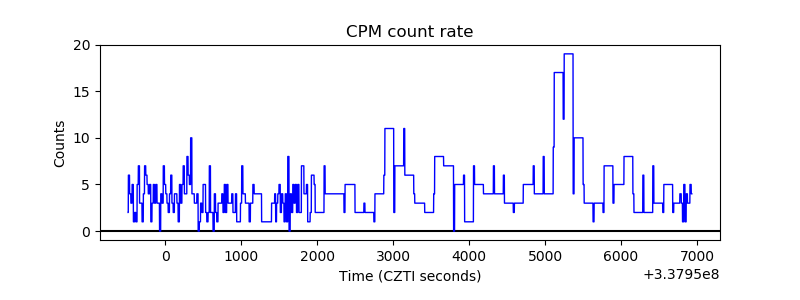 |
| CZT Counter |  |
| +2.5 Volts monitor |  |
| +5 Volts monitor |  |
| _ROLL_ROT |  |
| _Roll_DEC | 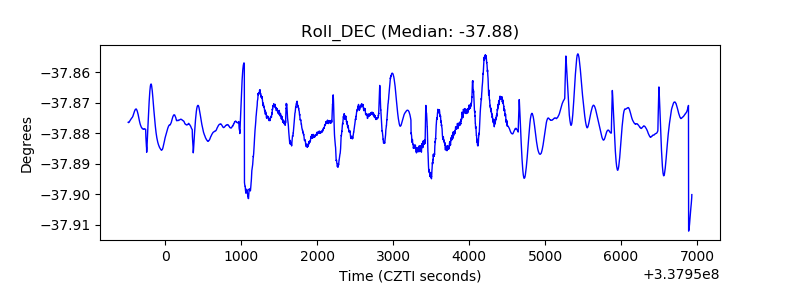 |
| _Roll_RA |  |
| Veto Counter | 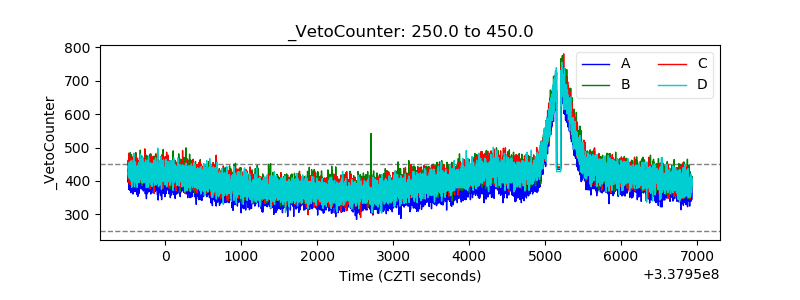 |