| Param | Original file | Final file |
|---|---|---|
| Filename | modeM0/AS1T03_224T01_9000003872_26871cztM0_level2.evt | modeM0/AS1T03_224T01_9000003872_26871cztM0_level2_quad_clean.evt |
| Size (bytes) | 573,154,560 | 94,645,440 |
| Size | 546.6 MB | 90.3 MB |
| Events in quadrant A | 3,989,016 | 606,371 |
| Events in quadrant B | 3,581,422 | 623,207 |
| Events in quadrant C | 3,323,316 | 602,633 |
| Events in quadrant D | 5,993,522 | 550,146 |
| Mode M0 | |||
|---|---|---|---|
| Quadrant | BADHDUFLAG | Total packets | Discarded packets |
| A | 0 | 16323 | 0 |
| B | 0 | 14958 | 0 |
| C | 0 | 14323 | 0 |
| D | 0 | 22365 | 0 |
| Mode M9 | |||
|---|---|---|---|
| Quadrant | BADHDUFLAG | Total packets | Discarded packets |
| A | 0 | 3 | 0 |
| B | 0 | 3 | 0 |
| C | 0 | 3 | 0 |
| D | 0 | 3 | 0 |
| Quadrant | Total seconds | Saturated seconds | Saturation percentage |
|---|---|---|---|
| A | 6938 | 181 | 2.608821% |
| B | 6938 | 137 | 1.974632% |
| C | 6939 | 124 | 1.787001% |
| D | 6939 | 657 | 9.468223% |
Noise dominated data is calculated using 1-second bins in cleaned event files. If a bin has >2000 counts, and if more than 50% of those come from <1% of pixels, then it is considered to be noise-dominated and hence unusable.
| Quadrant | # 1 sec bins | Bins with >0 counts | Bins with >2000 counts | High rate bins dominated by noise | Noise dominated (total time) | Noise dominated (detector-on time) | Marked lightcurve |
|---|---|---|---|---|---|---|---|
| A | 7228 | 6938 | 66 | 66 | 0.91% | 0.95% | 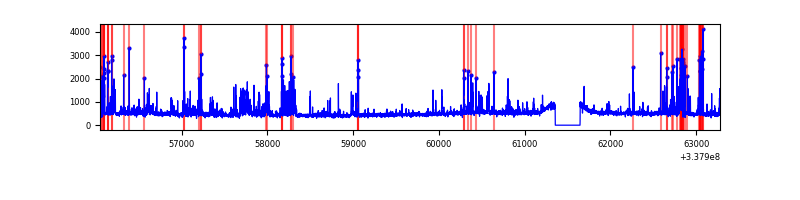 |
| B | 7228 | 6938 | 17 | 17 | 0.24% | 0.25% | 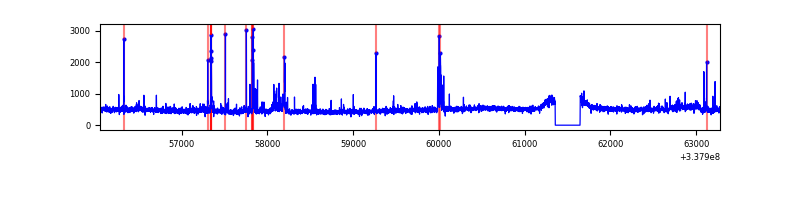 |
| C | 7229 | 6939 | 0 | 0 | 0.00% | 0.00% | 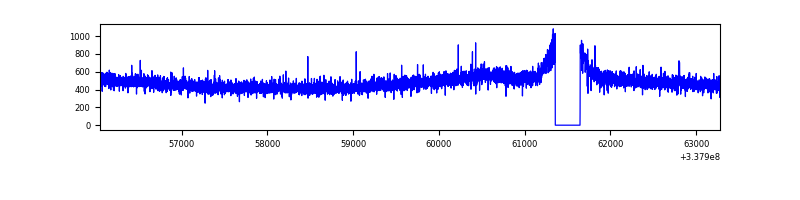 |
| D | 7229 | 6940 | 543 | 543 | 7.51% | 7.82% | 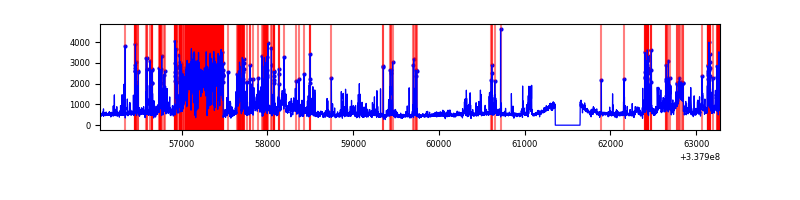 |
Top three noisy pixels from each quadrant. If the there are fewer than three noisy pixels in the level2.evt file, extra rows are filled as -1
| Pixel properties | Quadrant properties | ||||||
|---|---|---|---|---|---|---|---|
| Quadrant | DetID | PixID | Counts | Sigma | Mean | Median | Sigma |
| A | 0 | 13 | 706413 | 4137.87 | 846 | 828 | 170.5 |
| A | 12 | 96 | 15150 | 83.99 | 846 | 828 | 170.5 |
| A | 13 | 254 | 11879 | 64.81 | 846 | 828 | 170.5 |
| B | 10 | 246 | 105009 | 631.9 | 844 | 821 | 164.9 |
| B | 15 | 33 | 54830 | 327.57 | 844 | 821 | 164.9 |
| B | 0 | 189 | 45943 | 273.67 | 844 | 821 | 164.9 |
| C | 14 | 238 | 129702 | 673.66 | 813 | 816 | 191.3 |
| C | 8 | 128 | 10395 | 50.07 | 813 | 816 | 191.3 |
| C | 8 | 112 | 6076 | 27.49 | 813 | 816 | 191.3 |
| D | 7 | 80 | 1394937 | 7474.39 | 791 | 774 | 186.5 |
| D | 12 | 227 | 579390 | 3102.08 | 791 | 774 | 186.5 |
| D | 2 | 250 | 508805 | 2723.66 | 791 | 774 | 186.5 |
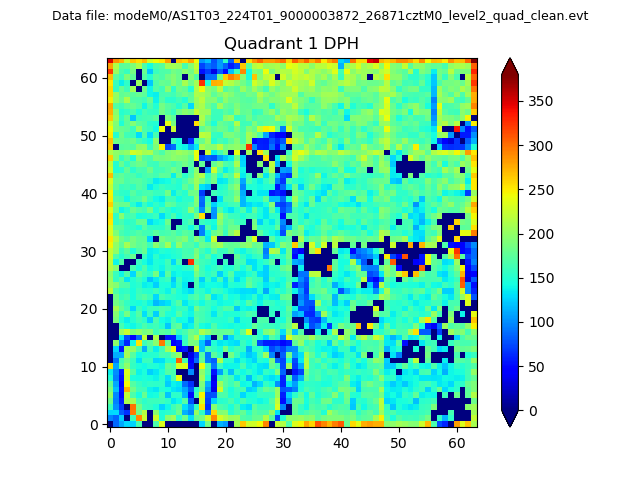
Histogram calculated using DETX and DETY for each event in the final _common_clean file
| Quadrant A | 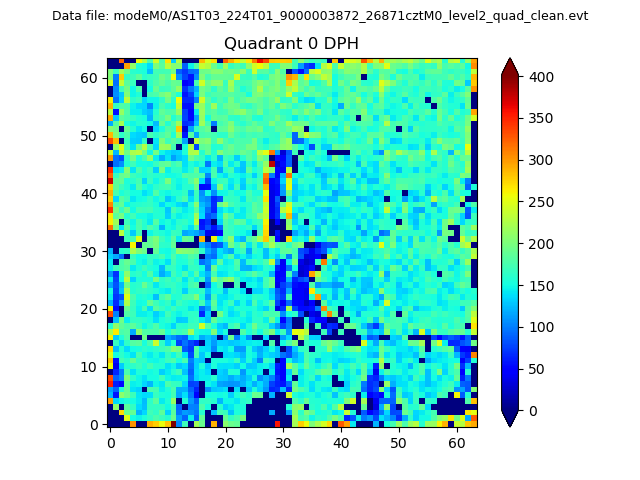 |
 |
Quadrant B |
|---|---|---|---|
| Quadrant D | 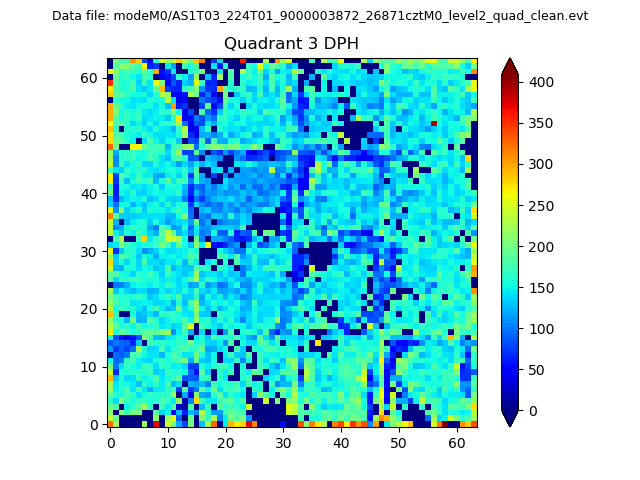 |
 |
Quadrant C |
| Plot type | Count rate plots | Images |
|---|---|---|
| Comparison with Poisson distribution Blue bars denote a histogram of data divided into 1 sec bins. Red curve is a Poisson curve with rate = median count rate of data. |
 |
 |
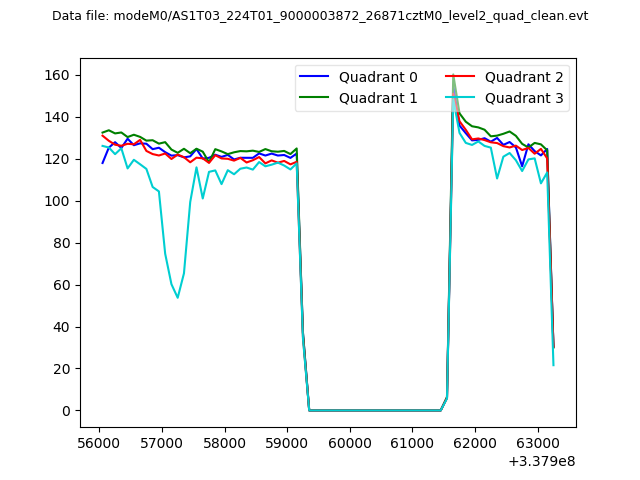
| Quadrant-wise count rates Data is divided into 100 sec bins |
 |
|
| Module-wise count rates for Quadrant A Data is divided into 100 sec bins |
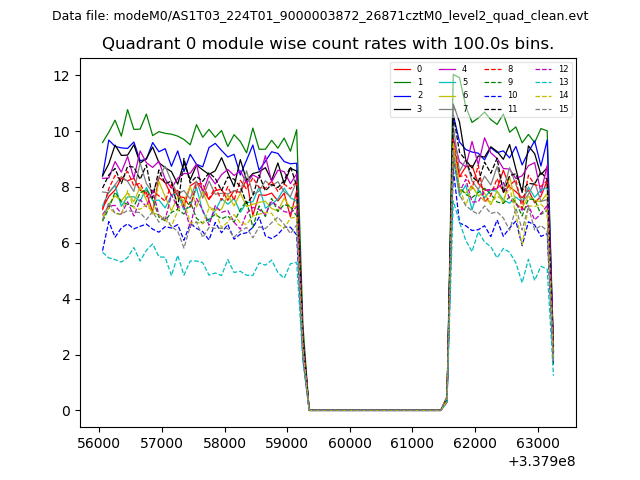 |
 |
| Module-wise count rates for Quadrant B Data is divided into 100 sec bins |
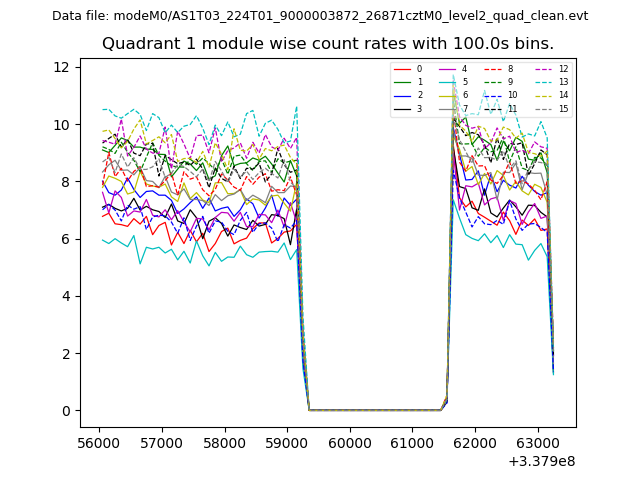 |
 |
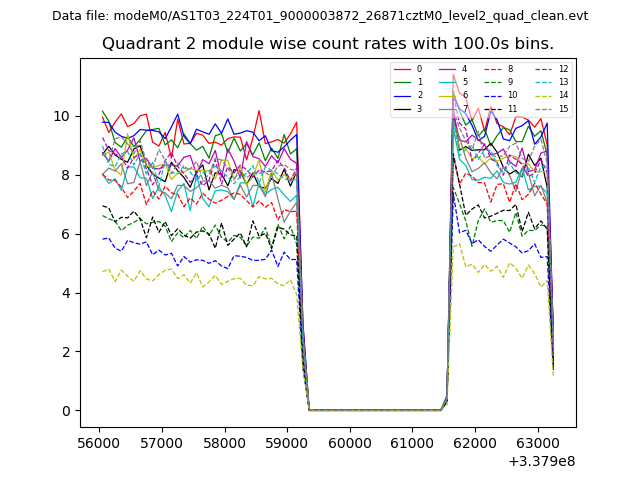
| Module-wise count rates for Quadrant C Data is divided into 100 sec bins |
 |
 |
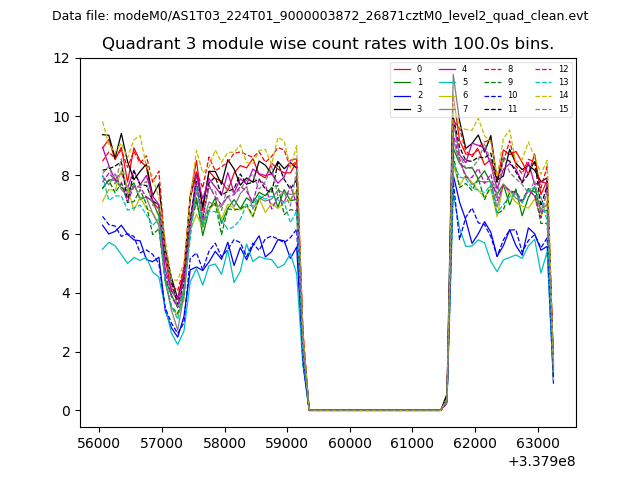
| Module-wise count rates for Quadrant D Data is divided into 100 sec bins |
 |
 |
| Parameter | Plot |
|---|---|
| CZT HV Monitor | 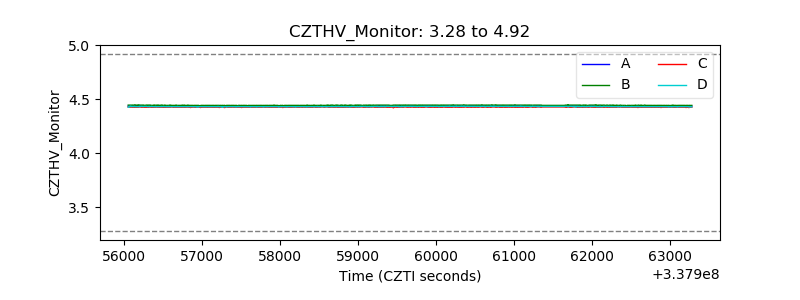 |
| D_VDD | 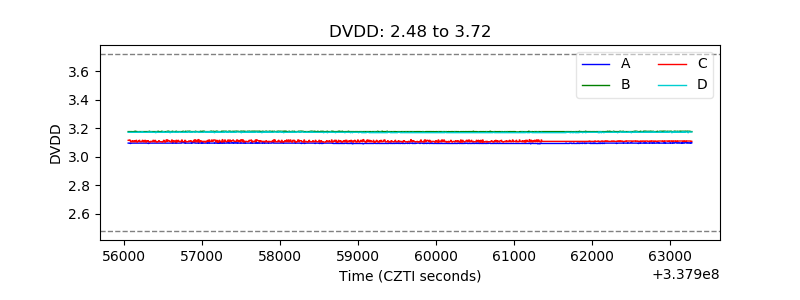 |
| Temperature 1 | 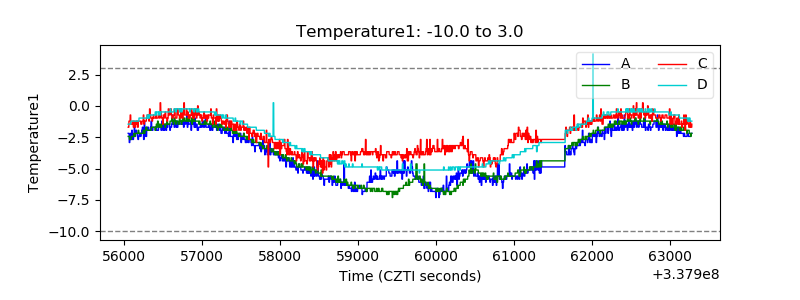 |
| Veto HV Monitor | 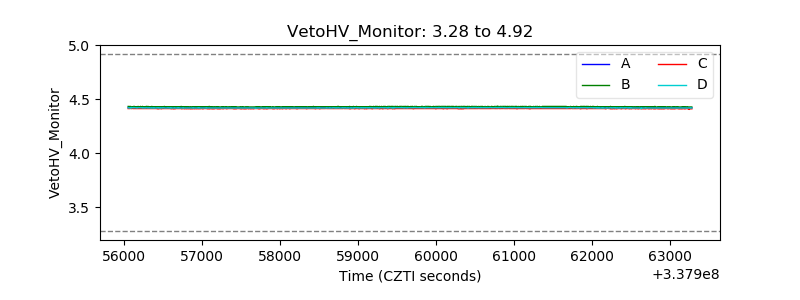 |
| Veto LLD | 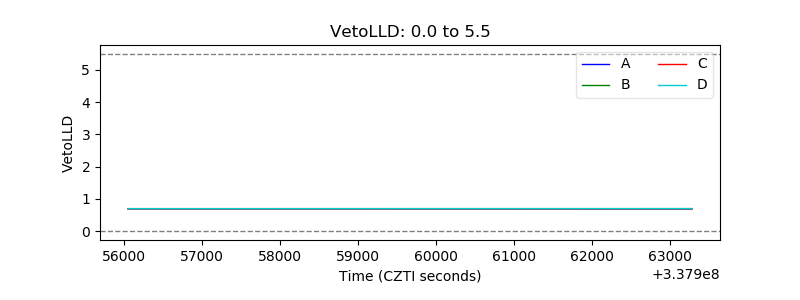 |
| Alpha Counter | 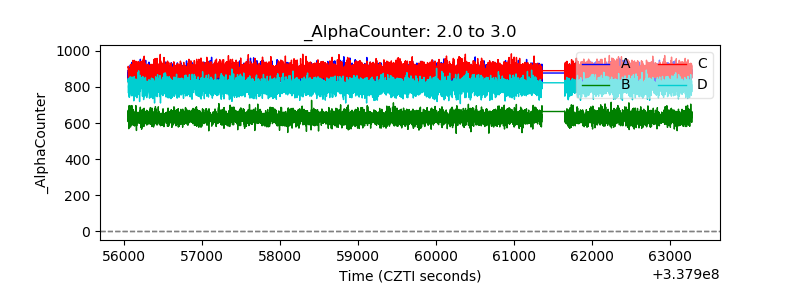 |
| _CPM_Rate | 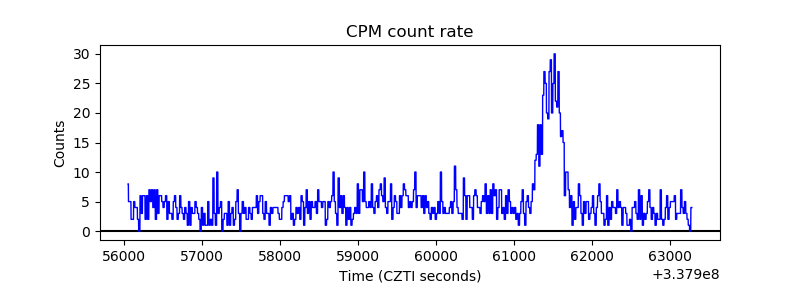 |
| CZT Counter |  |
| +2.5 Volts monitor |  |
| +5 Volts monitor |  |
| _ROLL_ROT |  |
| _Roll_DEC | 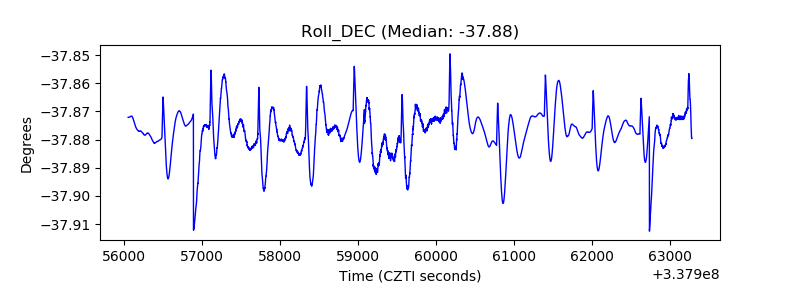 |
| _Roll_RA |  |
| Veto Counter | 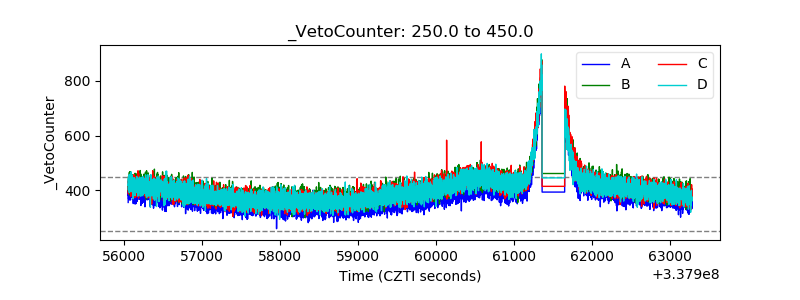 |