| Param | Original file | Final file |
|---|---|---|
| Filename | modeM0/AS1T03_224T01_9000003872_26873cztM0_level2.evt | modeM0/AS1T03_224T01_9000003872_26873cztM0_level2_quad_clean.evt |
| Size (bytes) | 1,177,905,600 | 164,839,680 |
| Size | 1.1 GB | 157.2 MB |
| Events in quadrant A | 7,425,566 | 1,061,092 |
| Events in quadrant B | 7,800,264 | 1,064,912 |
| Events in quadrant C | 6,058,005 | 1,056,538 |
| Events in quadrant D | 13,523,892 | 922,805 |
| Mode M0 | |||
|---|---|---|---|
| Quadrant | BADHDUFLAG | Total packets | Discarded packets |
| A | 0 | 30434 | 0 |
| B | 0 | 31301 | 0 |
| C | 0 | 26349 | 0 |
| D | 0 | 49042 | 0 |
| Mode M9 | |||
|---|---|---|---|
| Quadrant | BADHDUFLAG | Total packets | Discarded packets |
| A | 0 | 13 | 0 |
| B | 0 | 13 | 0 |
| C | 0 | 13 | 0 |
| D | 0 | 13 | 0 |
| Quadrant | Total seconds | Saturated seconds | Saturation percentage |
|---|---|---|---|
| A | 12827 | 278 | 2.167303% |
| B | 12828 | 511 | 3.983474% |
| C | 12827 | 123 | 0.958915% |
| D | 12827 | 2477 | 19.310829% |
Noise dominated data is calculated using 1-second bins in cleaned event files. If a bin has >2000 counts, and if more than 50% of those come from <1% of pixels, then it is considered to be noise-dominated and hence unusable.
| Quadrant | # 1 sec bins | Bins with >0 counts | Bins with >2000 counts | High rate bins dominated by noise | Noise dominated (total time) | Noise dominated (detector-on time) | Marked lightcurve |
|---|---|---|---|---|---|---|---|
| A | 14052 | 12829 | 146 | 146 | 1.04% | 1.14% | 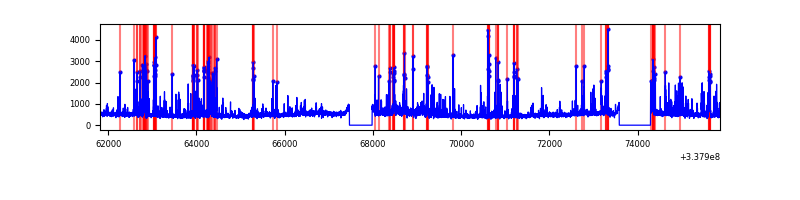 |
| B | 14053 | 12830 | 384 | 384 | 2.73% | 2.99% | 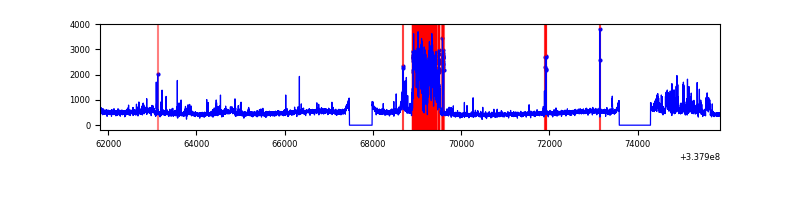 |
| C | 14052 | 12829 | 2 | 2 | 0.01% | 0.02% | 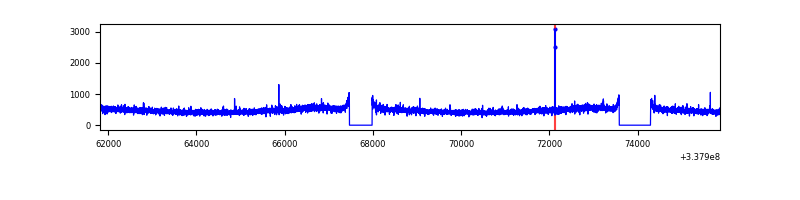 |
| D | 14052 | 12829 | 2134 | 2134 | 15.19% | 16.63% | 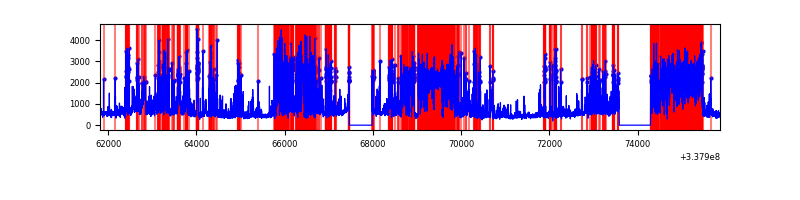 |
Top three noisy pixels from each quadrant. If the there are fewer than three noisy pixels in the level2.evt file, extra rows are filled as -1
| Pixel properties | Quadrant properties | ||||||
|---|---|---|---|---|---|---|---|
| Quadrant | DetID | PixID | Counts | Sigma | Mean | Median | Sigma |
| A | 0 | 13 | 1238435 | 3999.99 | 1540 | 1511 | 309.2 |
| A | 6 | 16 | 205395 | 659.32 | 1540 | 1511 | 309.2 |
| A | 12 | 96 | 41710 | 130.0 | 1540 | 1511 | 309.2 |
| B | 3 | 64 | 1264729 | 4358.33 | 1521 | 1479 | 289.8 |
| B | 0 | 190 | 239744 | 822.04 | 1521 | 1479 | 289.8 |
| B | 15 | 33 | 196327 | 672.24 | 1521 | 1479 | 289.8 |
| C | 14 | 238 | 237055 | 678.87 | 1482 | 1490 | 347.0 |
| C | 2 | 16 | 28711 | 78.45 | 1482 | 1490 | 347.0 |
| C | 3 | 233 | 20645 | 55.2 | 1482 | 1490 | 347.0 |
| D | 7 | 80 | 5741567 | 17870.83 | 1363 | 1330 | 321.2 |
| D | 1 | 52 | 772142 | 2399.74 | 1363 | 1330 | 321.2 |
| D | 2 | 250 | 675623 | 2099.25 | 1363 | 1330 | 321.2 |
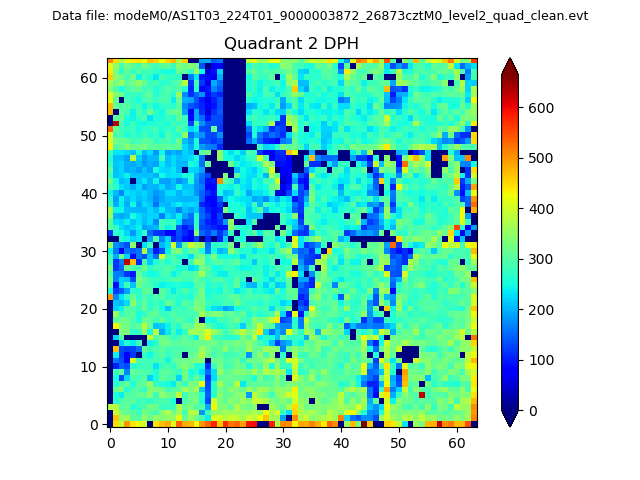
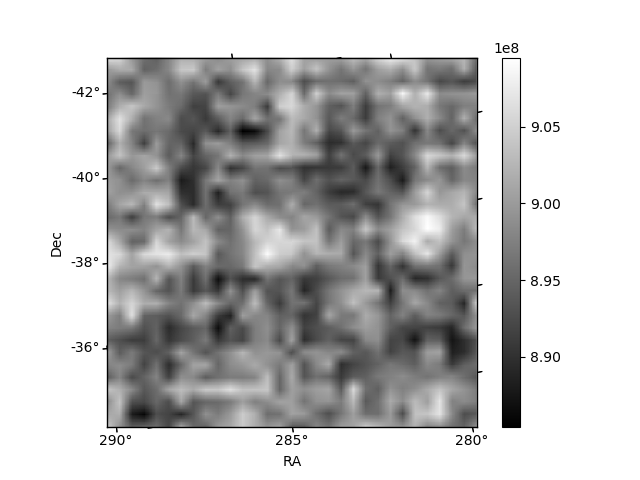
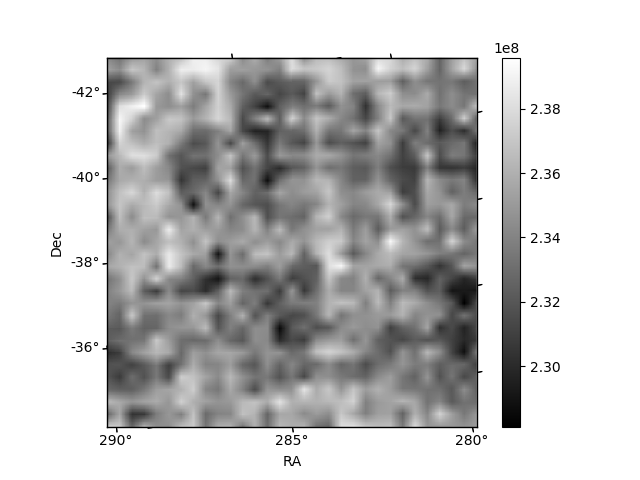
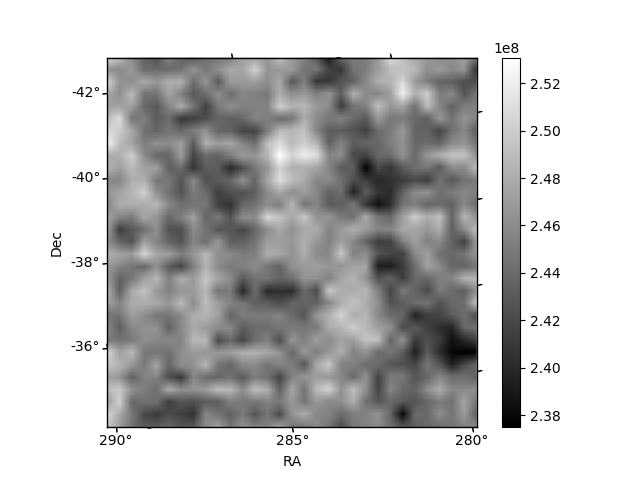
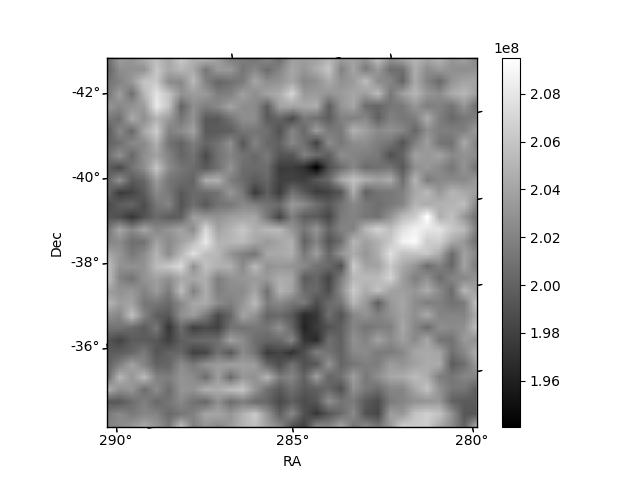
Histogram calculated using DETX and DETY for each event in the final _common_clean file
| Quadrant A | 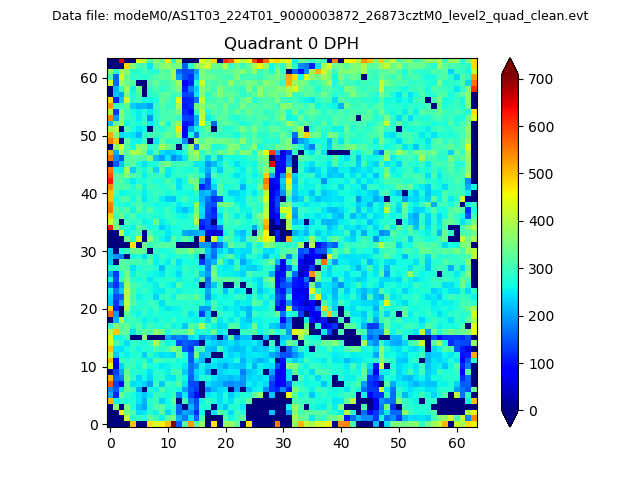 |
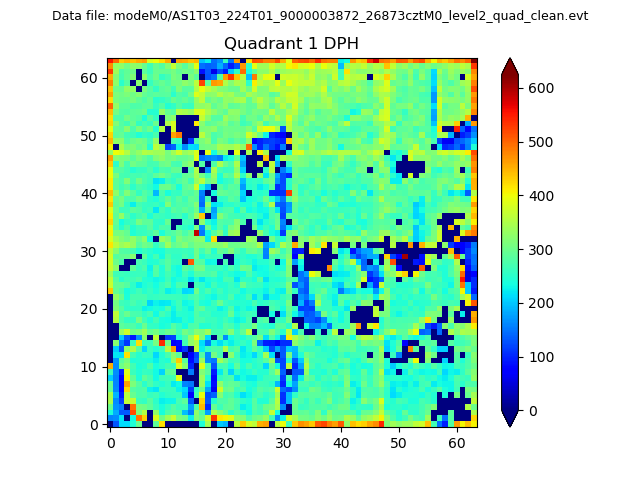 |
Quadrant B |
|---|---|---|---|
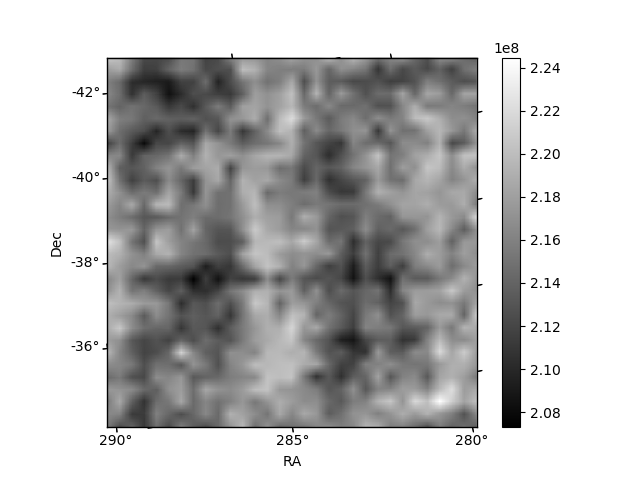
| Quadrant D | 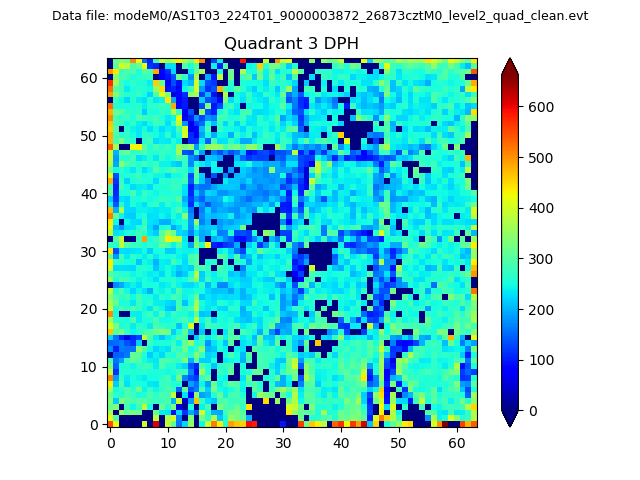 |
 |
Quadrant C |
| Plot type | Count rate plots | Images |
|---|---|---|
| Comparison with Poisson distribution Blue bars denote a histogram of data divided into 1 sec bins. Red curve is a Poisson curve with rate = median count rate of data. |
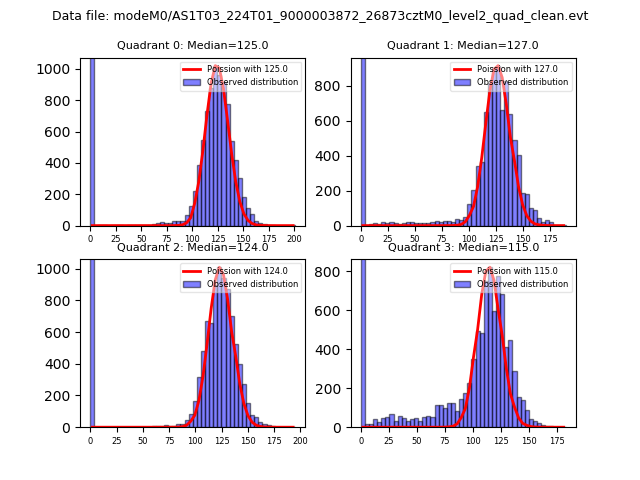 |
 |
| Quadrant-wise count rates Data is divided into 100 sec bins |
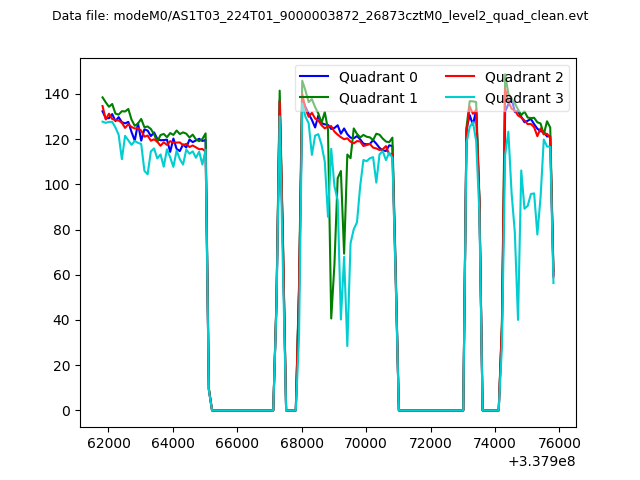 |
|
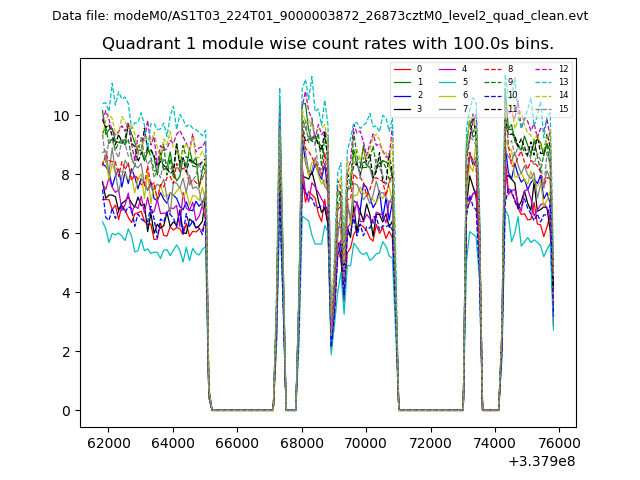
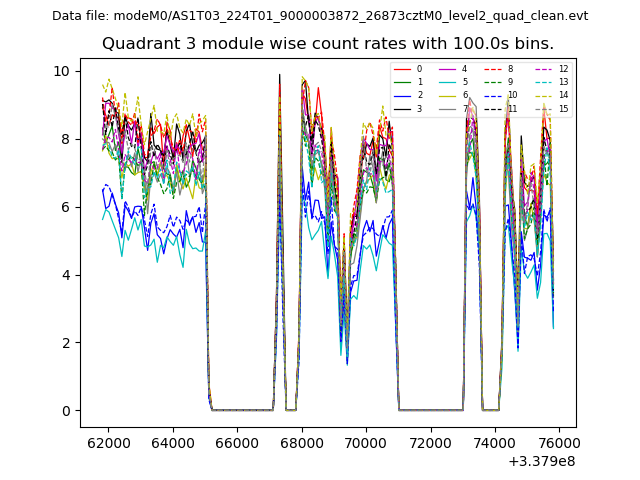
| Module-wise count rates for Quadrant A Data is divided into 100 sec bins |
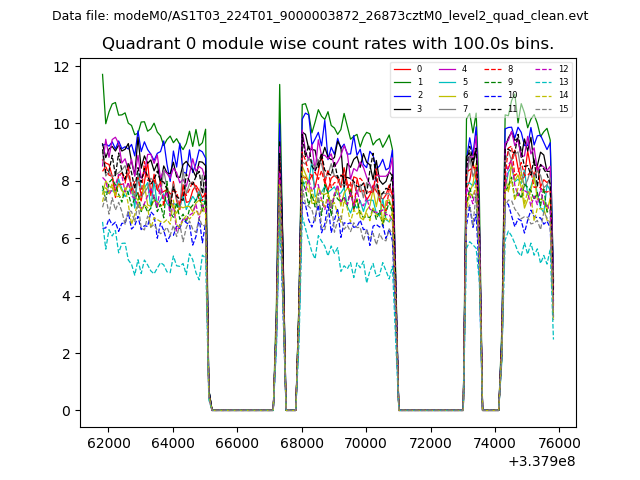 |
 |
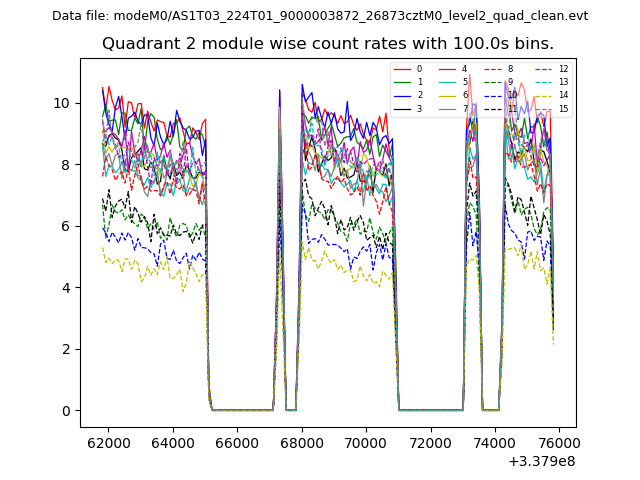
| Module-wise count rates for Quadrant B Data is divided into 100 sec bins |
 |
 |
| Module-wise count rates for Quadrant C Data is divided into 100 sec bins |
 |
 |
| Module-wise count rates for Quadrant D Data is divided into 100 sec bins |
 |
 |
| Parameter | Plot |
|---|---|
| CZT HV Monitor | 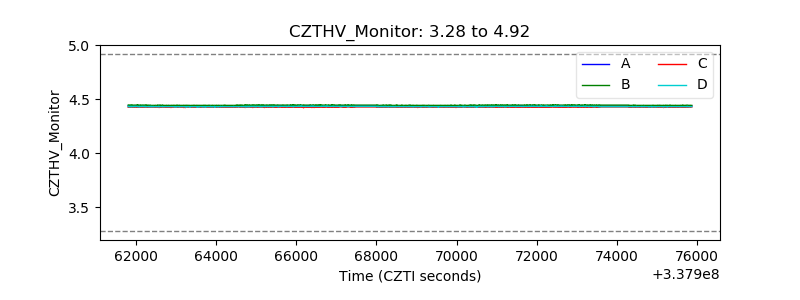 |
| D_VDD | 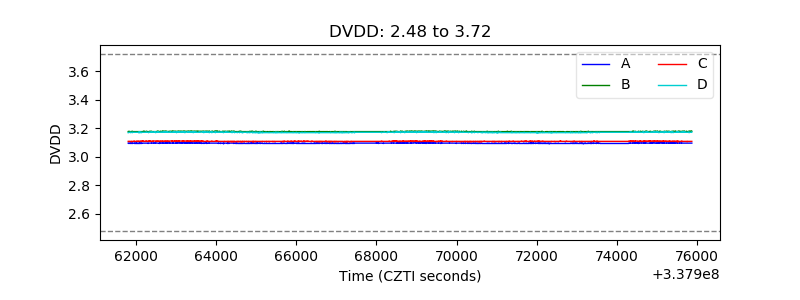 |
| Temperature 1 | 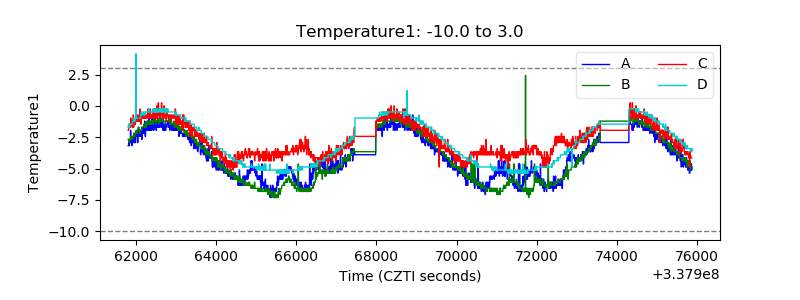 |
| Veto HV Monitor | 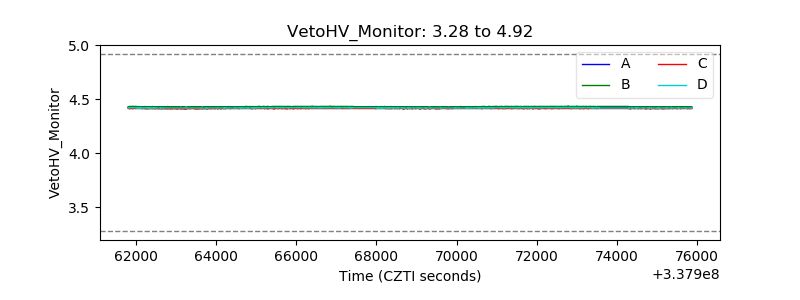 |
| Veto LLD | 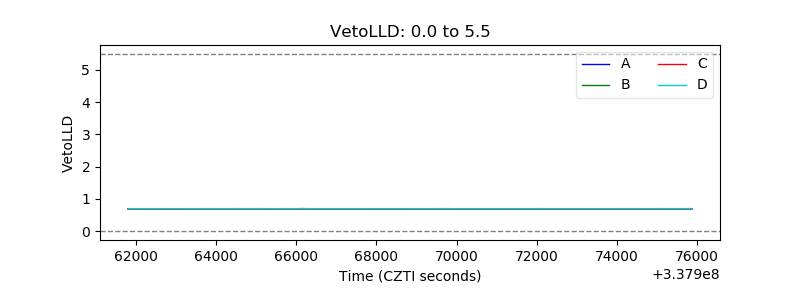 |
| Alpha Counter | 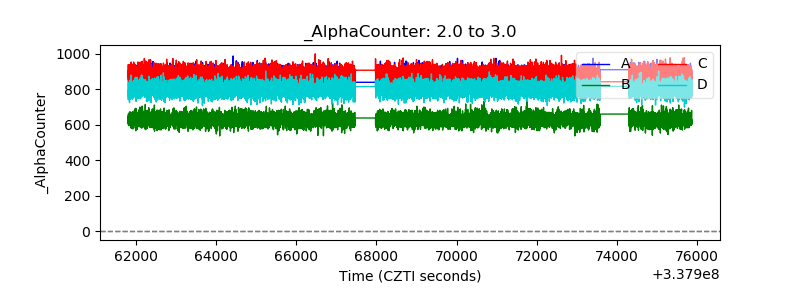 |
| _CPM_Rate | 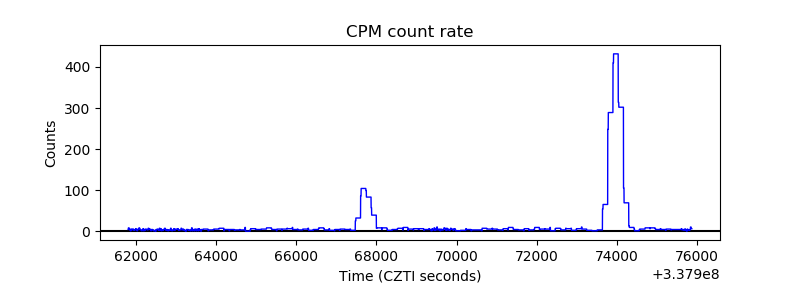 |
| CZT Counter | 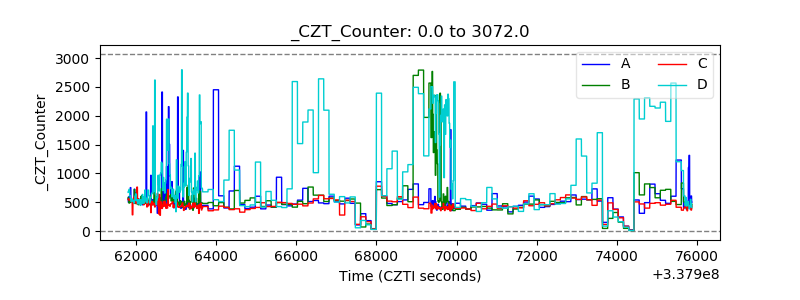 |
| +2.5 Volts monitor |  |
| +5 Volts monitor |  |
| _ROLL_ROT | 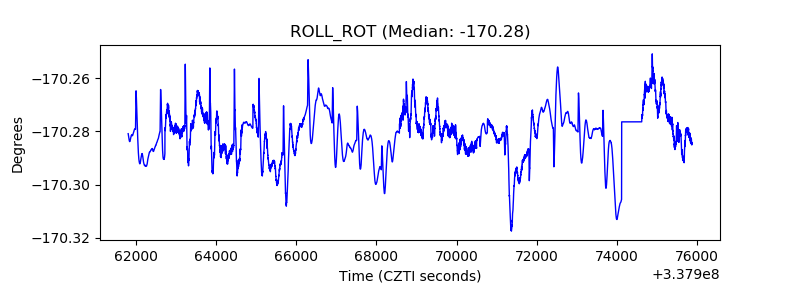 |
| _Roll_DEC | 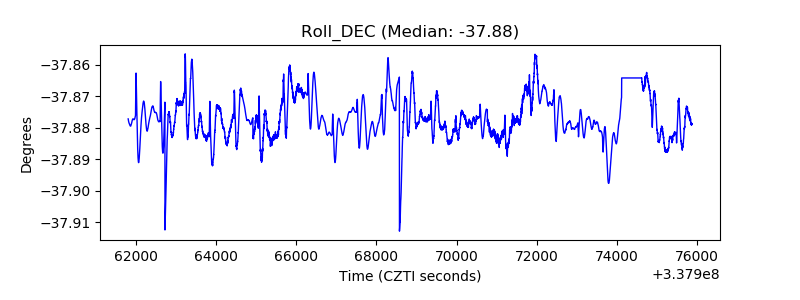 |
| _Roll_RA | 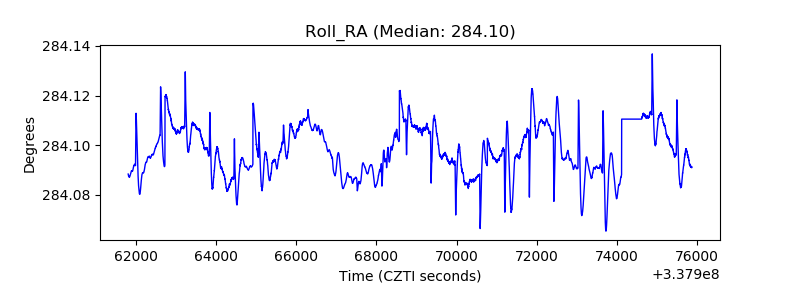 |
| Veto Counter | 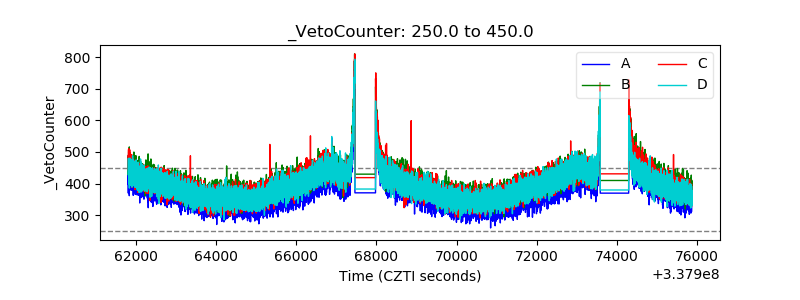 |