| Param | Original file | Final file |
|---|---|---|
| Filename | modeM0/AS1T03_224T01_9000003872_26874cztM0_level2.evt | modeM0/AS1T03_224T01_9000003872_26874cztM0_level2_quad_clean.evt |
| Size (bytes) | 706,697,280 | 87,503,040 |
| Size | 674.0 MB | 83.4 MB |
| Events in quadrant A | 4,233,109 | 601,907 |
| Events in quadrant B | 3,907,327 | 619,991 |
| Events in quadrant C | 3,235,682 | 598,247 |
| Events in quadrant D | 9,563,021 | 352,229 |
| Mode M0 | |||
|---|---|---|---|
| Quadrant | BADHDUFLAG | Total packets | Discarded packets |
| A | 0 | 17019 | 0 |
| B | 0 | 16165 | 0 |
| C | 0 | 14032 | 0 |
| D | 0 | 33156 | 0 |
| Mode M9 | |||
|---|---|---|---|
| Quadrant | BADHDUFLAG | Total packets | Discarded packets |
| A | 0 | 13 | 0 |
| B | 0 | 14 | 0 |
| C | 0 | 14 | 0 |
| D | 0 | 14 | 0 |
| Quadrant | Total seconds | Saturated seconds | Saturation percentage |
|---|---|---|---|
| A | 6839 | 175 | 2.558854% |
| B | 6839 | 95 | 1.389092% |
| C | 6839 | 62 | 0.906565% |
| D | 6839 | 3100 | 45.328264% |
Noise dominated data is calculated using 1-second bins in cleaned event files. If a bin has >2000 counts, and if more than 50% of those come from <1% of pixels, then it is considered to be noise-dominated and hence unusable.
| Quadrant | # 1 sec bins | Bins with >0 counts | Bins with >2000 counts | High rate bins dominated by noise | Noise dominated (total time) | Noise dominated (detector-on time) | Marked lightcurve |
|---|---|---|---|---|---|---|---|
| A | 7744 | 6840 | 114 | 114 | 1.47% | 1.67% | 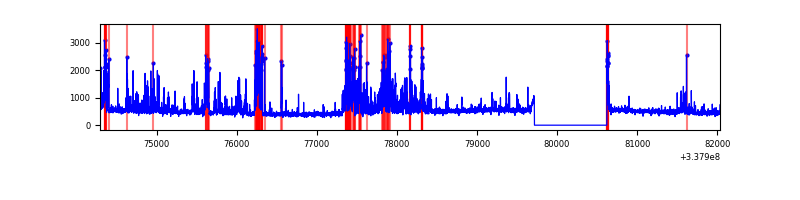 |
| B | 7744 | 6839 | 32 | 32 | 0.41% | 0.47% | 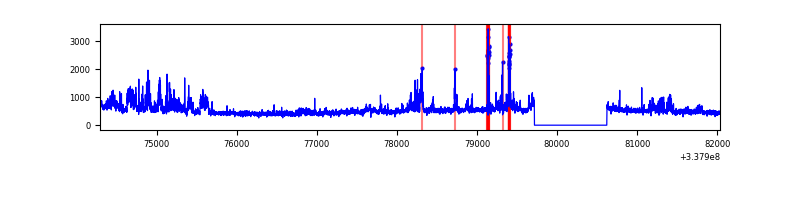 |
| C | 7744 | 6840 | 1 | 1 | 0.01% | 0.01% | 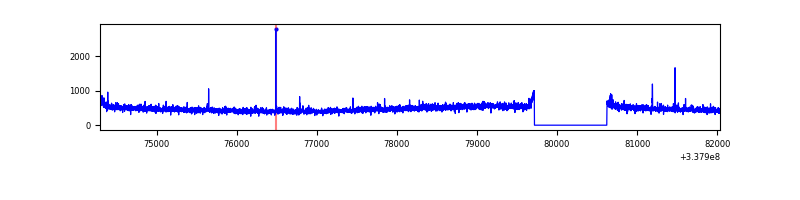 |
| D | 7744 | 6839 | 2012 | 2012 | 25.98% | 29.42% | 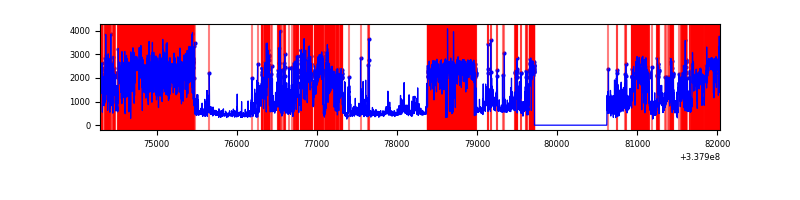 |
Top three noisy pixels from each quadrant. If the there are fewer than three noisy pixels in the level2.evt file, extra rows are filled as -1
| Pixel properties | Quadrant properties | ||||||
|---|---|---|---|---|---|---|---|
| Quadrant | DetID | PixID | Counts | Sigma | Mean | Median | Sigma |
| A | 0 | 13 | 1051341 | 6265.4 | 823 | 807 | 167.7 |
| A | 13 | 254 | 12005 | 66.79 | 823 | 807 | 167.7 |
| A | 3 | 137 | 7925 | 42.45 | 823 | 807 | 167.7 |
| B | 0 | 189 | 225944 | 1426.91 | 824 | 805 | 157.8 |
| B | 0 | 190 | 145767 | 918.75 | 824 | 805 | 157.8 |
| B | 3 | 64 | 114896 | 723.1 | 824 | 805 | 157.8 |
| C | 14 | 238 | 125296 | 666.25 | 790 | 795 | 186.9 |
| C | 2 | 16 | 17678 | 90.35 | 790 | 795 | 186.9 |
| C | 3 | 233 | 11803 | 58.91 | 790 | 795 | 186.9 |
| D | 7 | 80 | 6526240 | 52423.76 | 522 | 511 | 124.5 |
| D | 1 | 52 | 540874 | 4340.95 | 522 | 511 | 124.5 |
| D | 2 | 250 | 325221 | 2608.52 | 522 | 511 | 124.5 |
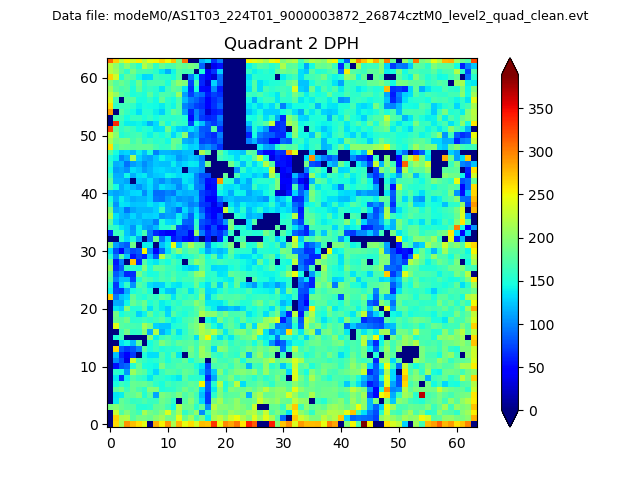
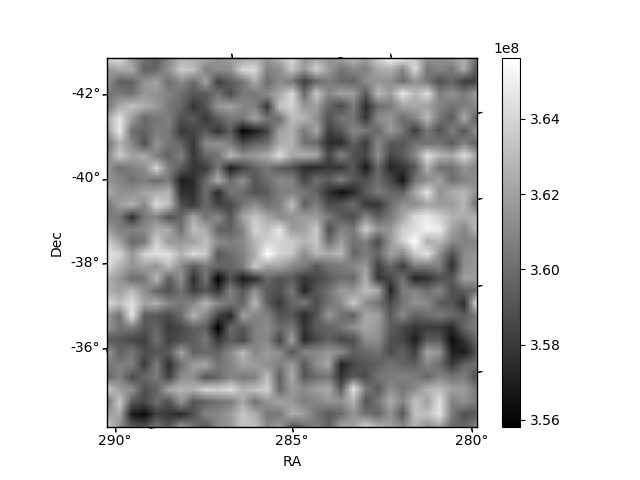
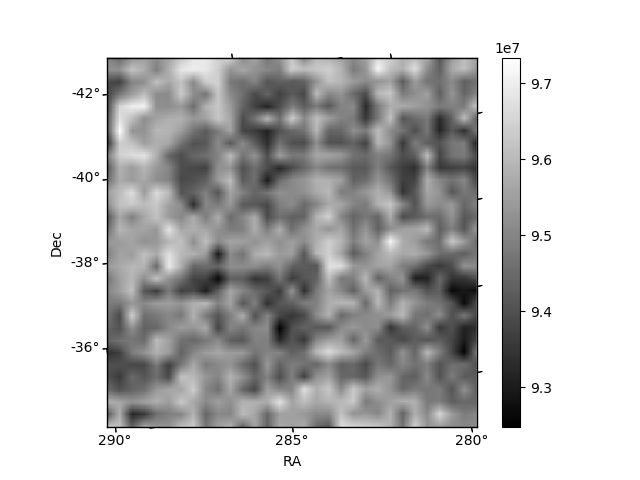
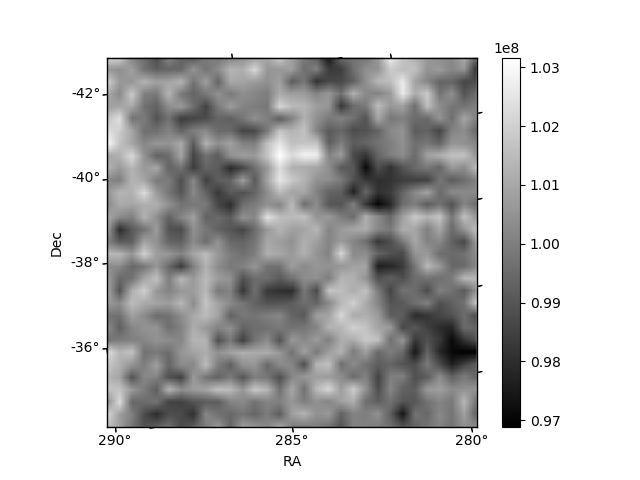
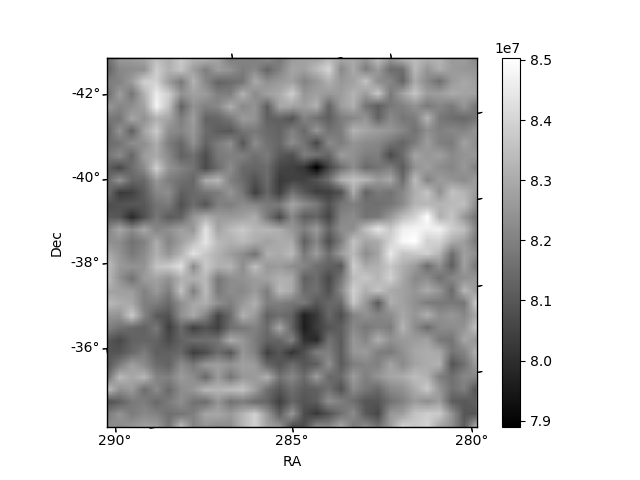
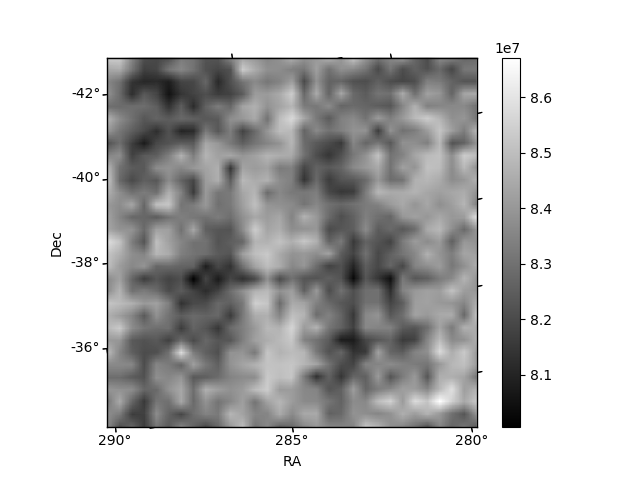
Histogram calculated using DETX and DETY for each event in the final _common_clean file
| Quadrant A | 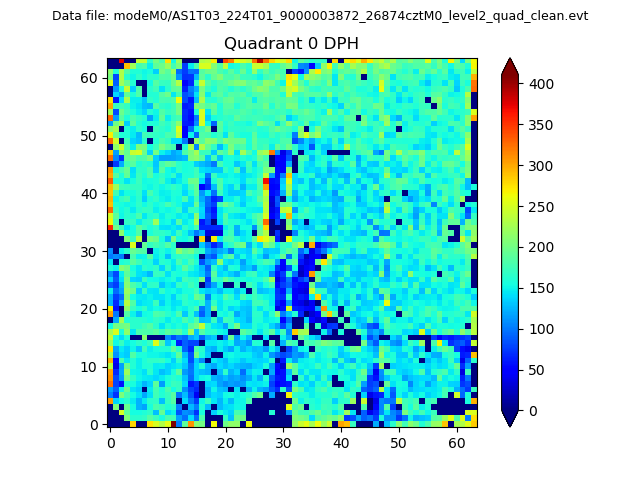 |
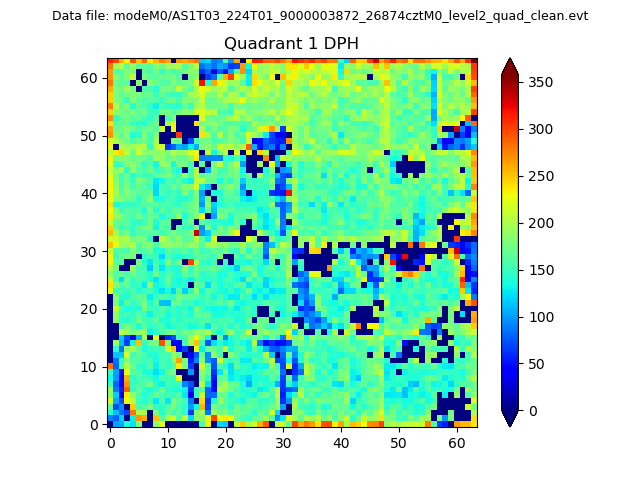 |
Quadrant B |
|---|---|---|---|
| Quadrant D | 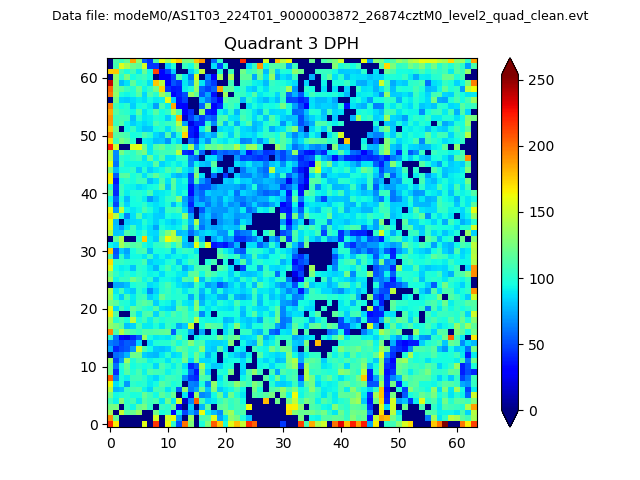 |
 |
Quadrant C |
| Plot type | Count rate plots | Images |
|---|---|---|
| Comparison with Poisson distribution Blue bars denote a histogram of data divided into 1 sec bins. Red curve is a Poisson curve with rate = median count rate of data. |
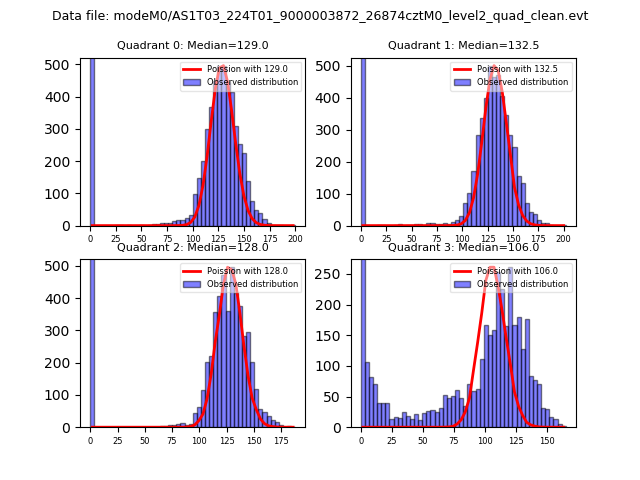 |
 |
| Quadrant-wise count rates Data is divided into 100 sec bins |
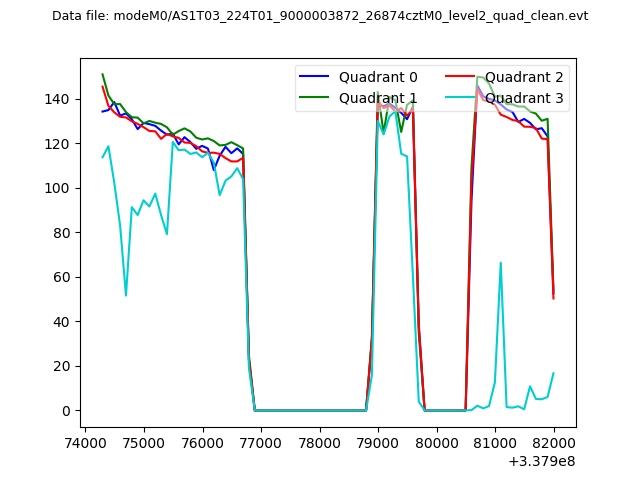 |
|
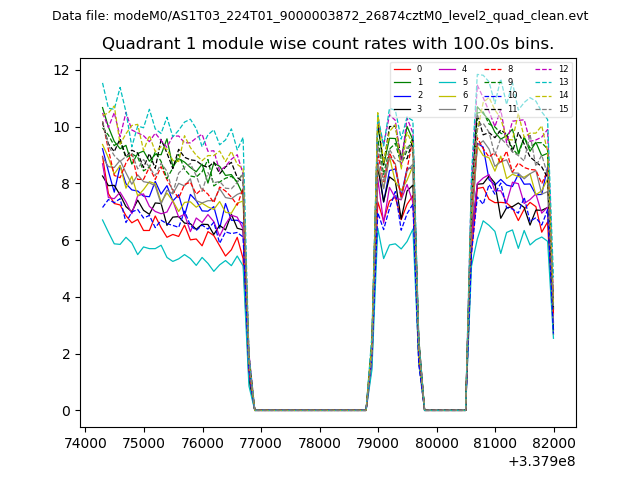
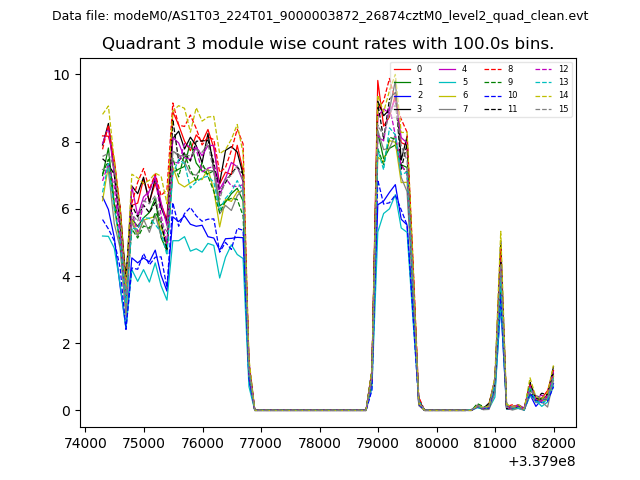
| Module-wise count rates for Quadrant A Data is divided into 100 sec bins |
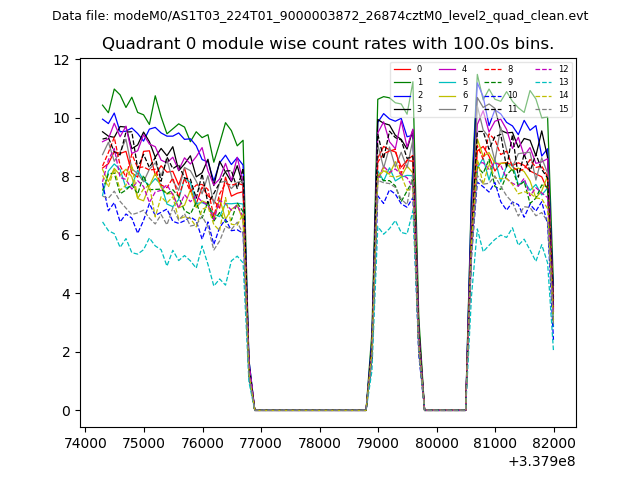 |
 |
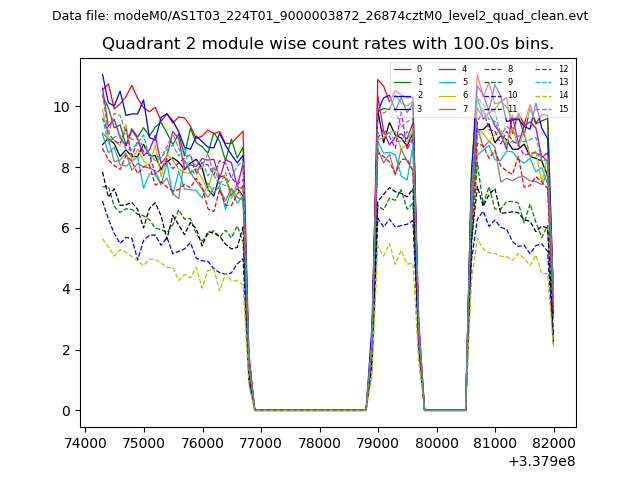
| Module-wise count rates for Quadrant B Data is divided into 100 sec bins |
 |
 |
| Module-wise count rates for Quadrant C Data is divided into 100 sec bins |
 |
 |
| Module-wise count rates for Quadrant D Data is divided into 100 sec bins |
 |
 |
| Parameter | Plot |
|---|---|
| CZT HV Monitor | 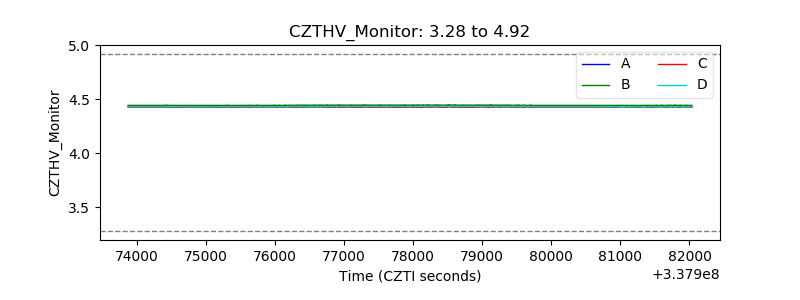 |
| D_VDD | 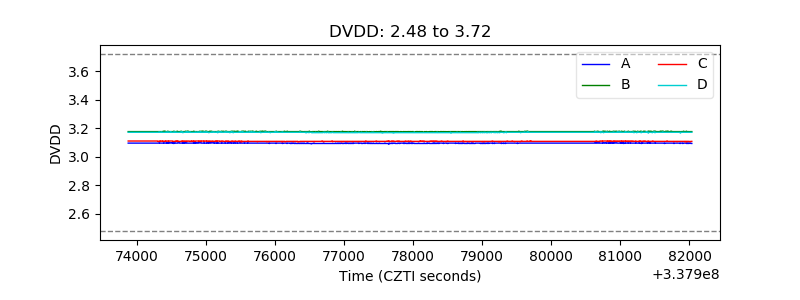 |
| Temperature 1 | 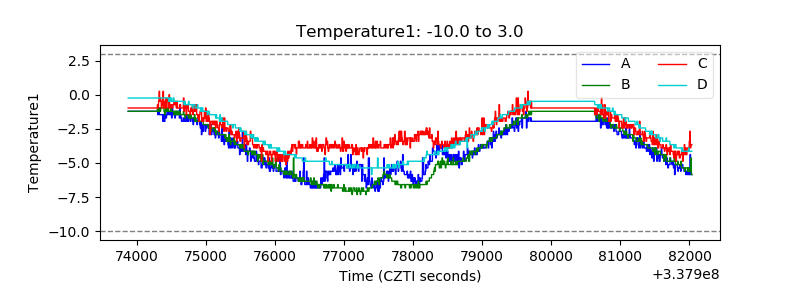 |
| Veto HV Monitor | 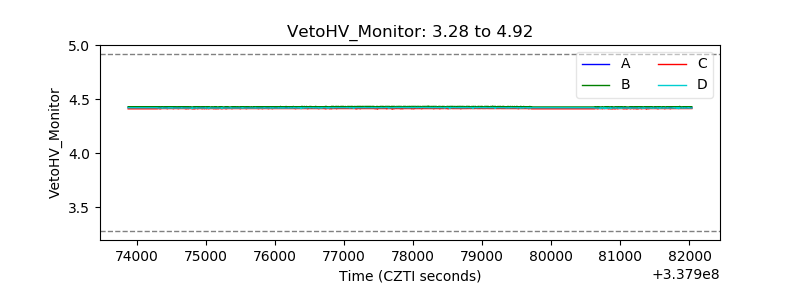 |
| Veto LLD | 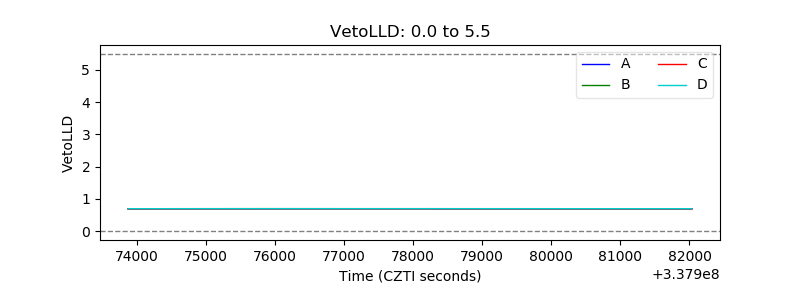 |
| Alpha Counter | 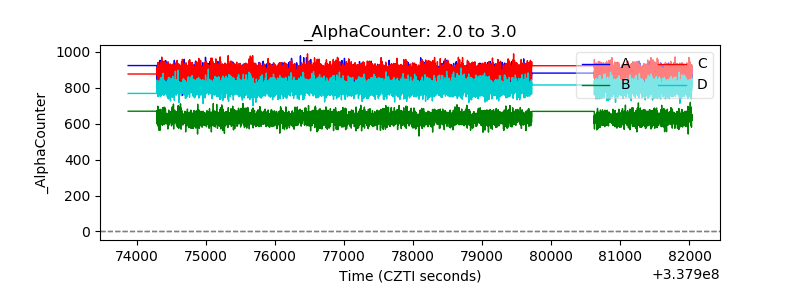 |
| _CPM_Rate | 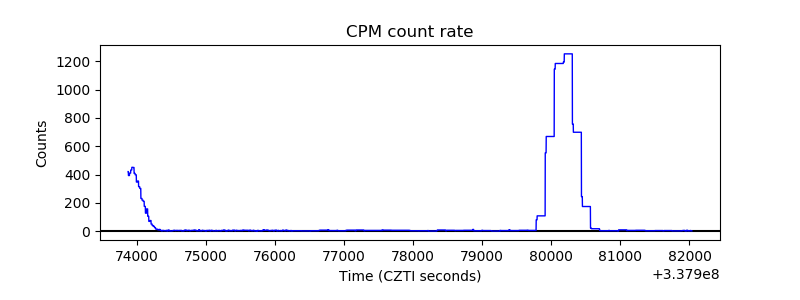 |
| CZT Counter | 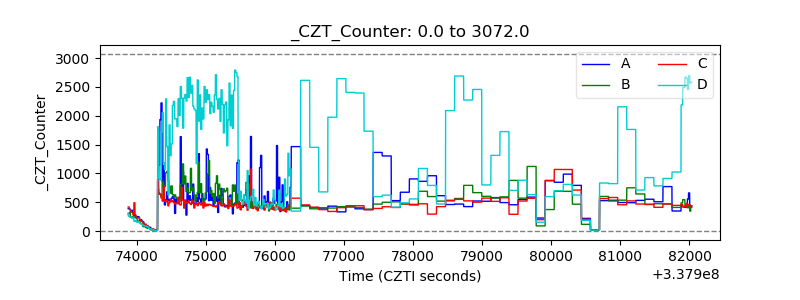 |
| +2.5 Volts monitor | 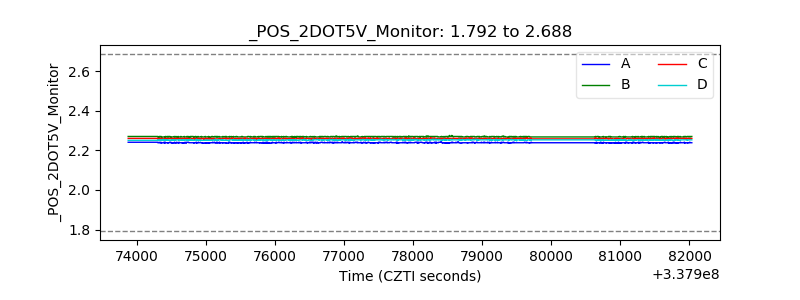 |
| +5 Volts monitor |  |
| _ROLL_ROT | 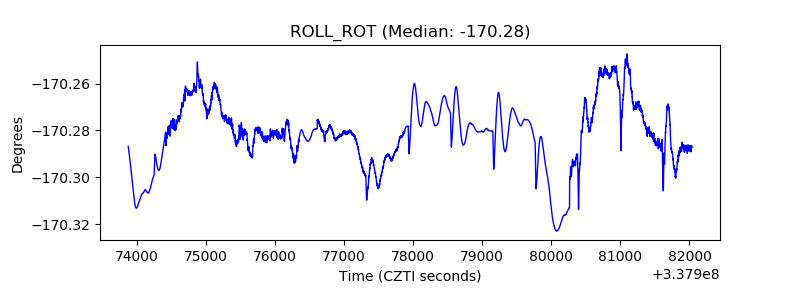 |
| _Roll_DEC | 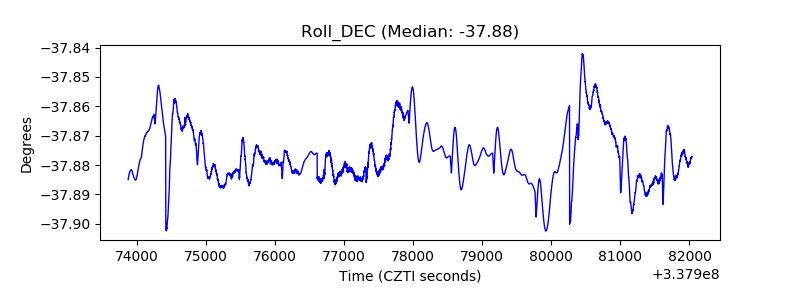 |
| _Roll_RA | 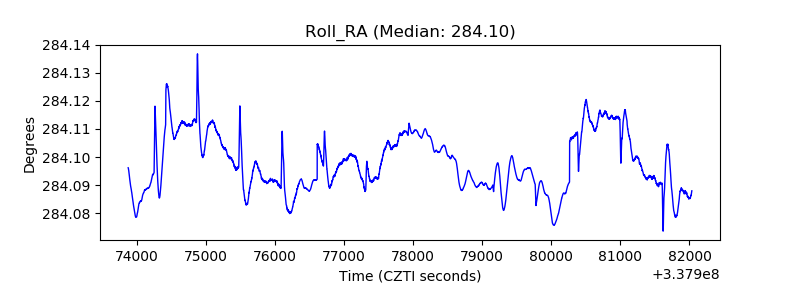 |
| Veto Counter | 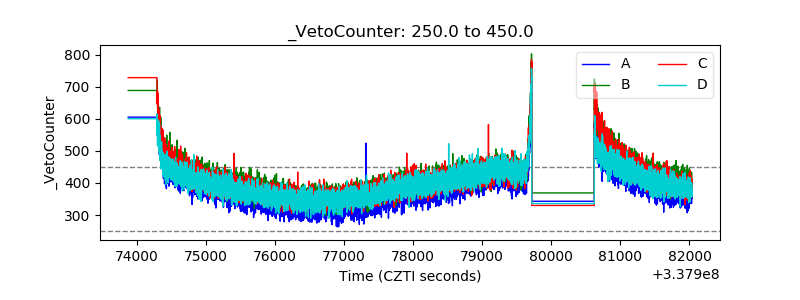 |