| Param | Original file | Final file |
|---|---|---|
| Filename | modeM0/AS1T03_224T01_9000003872_26875cztM0_level2.evt | modeM0/AS1T03_224T01_9000003872_26875cztM0_level2_quad_clean.evt |
| Size (bytes) | 766,854,720 | 82,422,720 |
| Size | 731.3 MB | 78.6 MB |
| Events in quadrant A | 3,750,341 | 594,741 |
| Events in quadrant B | 5,516,849 | 595,707 |
| Events in quadrant C | 3,158,411 | 591,864 |
| Events in quadrant D | 10,354,804 | 254,770 |
| Mode M0 | |||
|---|---|---|---|
| Quadrant | BADHDUFLAG | Total packets | Discarded packets |
| A | 0 | 15397 | 0 |
| B | 0 | 20881 | 0 |
| C | 0 | 13528 | 0 |
| D | 0 | 35314 | 0 |
| Mode M9 | |||
|---|---|---|---|
| Quadrant | BADHDUFLAG | Total packets | Discarded packets |
| A | 0 | 15 | 0 |
| B | 0 | 16 | 0 |
| C | 0 | 16 | 0 |
| D | 0 | 16 | 0 |
| Quadrant | Total seconds | Saturated seconds | Saturation percentage |
|---|---|---|---|
| A | 6563 | 82 | 1.249429% |
| B | 6563 | 472 | 7.191833% |
| C | 6562 | 58 | 0.883877% |
| D | 6562 | 3777 | 57.558671% |
Noise dominated data is calculated using 1-second bins in cleaned event files. If a bin has >2000 counts, and if more than 50% of those come from <1% of pixels, then it is considered to be noise-dominated and hence unusable.
| Quadrant | # 1 sec bins | Bins with >0 counts | Bins with >2000 counts | High rate bins dominated by noise | Noise dominated (total time) | Noise dominated (detector-on time) | Marked lightcurve |
|---|---|---|---|---|---|---|---|
| A | 7628 | 6564 | 43 | 43 | 0.56% | 0.66% | 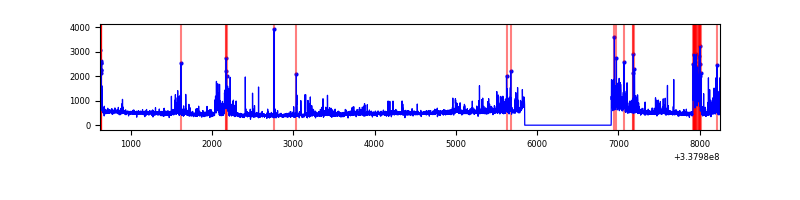 |
| B | 7628 | 6563 | 215 | 215 | 2.82% | 3.28% | 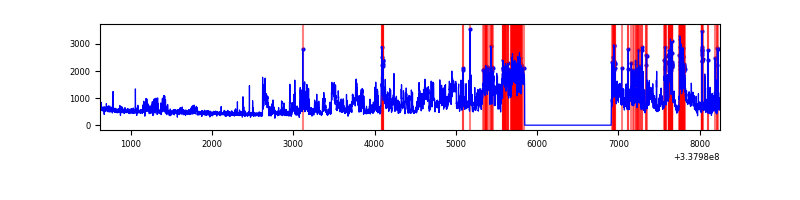 |
| C | 7627 | 6563 | 6 | 6 | 0.08% | 0.09% | 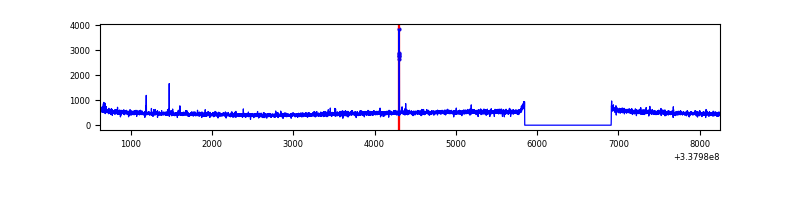 |
| D | 7627 | 6562 | 2513 | 2513 | 32.95% | 38.30% | 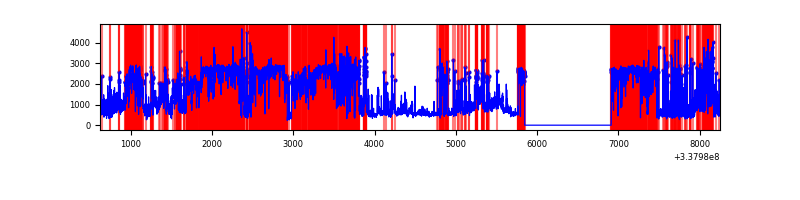 |
Top three noisy pixels from each quadrant. If the there are fewer than three noisy pixels in the level2.evt file, extra rows are filled as -1
| Pixel properties | Quadrant properties | ||||||
|---|---|---|---|---|---|---|---|
| Quadrant | DetID | PixID | Counts | Sigma | Mean | Median | Sigma |
| A | 0 | 13 | 666010 | 4145.48 | 799 | 784 | 160.5 |
| A | 13 | 254 | 11262 | 65.3 | 799 | 784 | 160.5 |
| A | 3 | 137 | 7539 | 42.1 | 799 | 784 | 160.5 |
| B | 0 | 189 | 1855904 | 12403.42 | 790 | 772 | 149.6 |
| B | 3 | 112 | 169947 | 1131.1 | 790 | 772 | 149.6 |
| B | 3 | 64 | 161696 | 1075.94 | 790 | 772 | 149.6 |
| C | 14 | 238 | 121808 | 668.25 | 769 | 774 | 181.1 |
| C | 15 | 208 | 23570 | 125.86 | 769 | 774 | 181.1 |
| C | 2 | 16 | 14730 | 77.05 | 769 | 774 | 181.1 |
| D | 7 | 80 | 8410013 | 86150.37 | 412 | 402 | 97.6 |
| D | 1 | 52 | 130551 | 1333.28 | 412 | 402 | 97.6 |
| D | 11 | 176 | 130220 | 1329.89 | 412 | 402 | 97.6 |
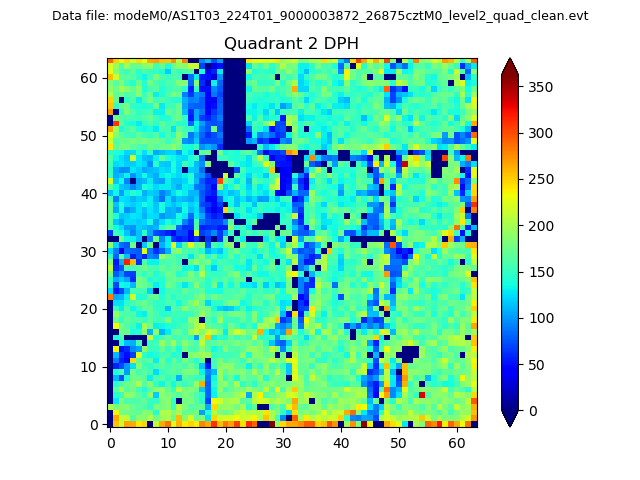
Histogram calculated using DETX and DETY for each event in the final _common_clean file
| Quadrant A | 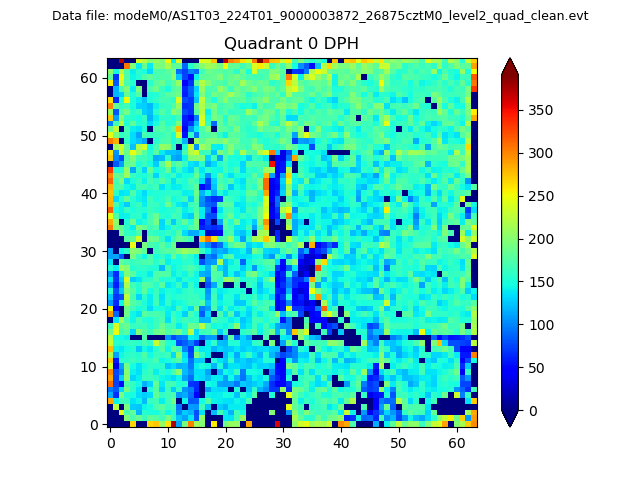 |
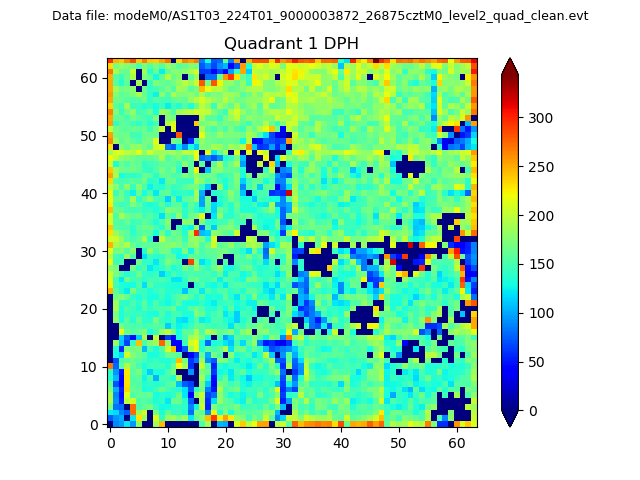 |
Quadrant B |
|---|---|---|---|
| Quadrant D | 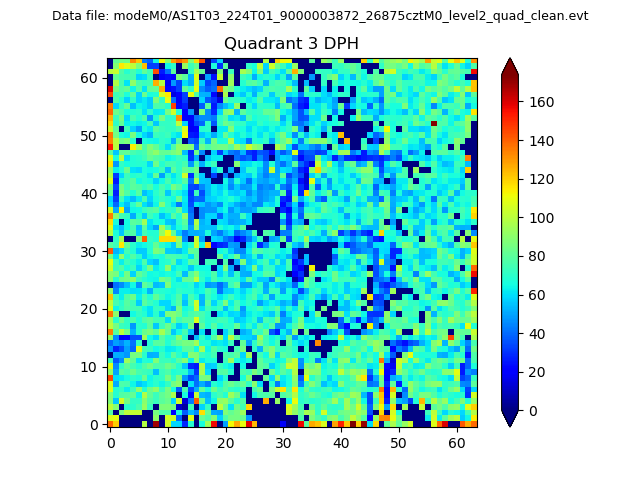 |
 |
Quadrant C |
| Plot type | Count rate plots | Images |
|---|---|---|
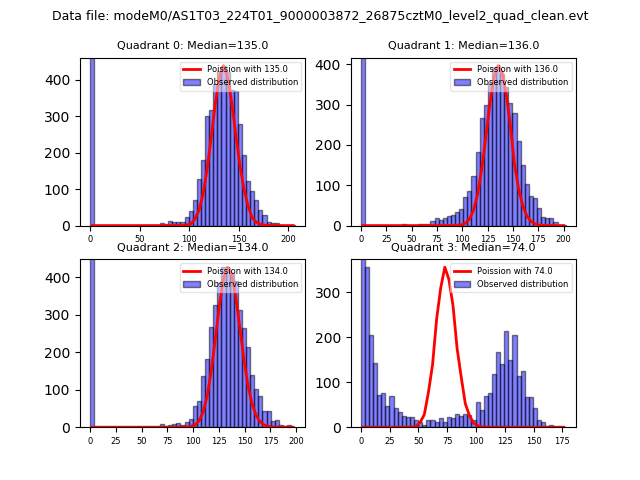
| Comparison with Poisson distribution Blue bars denote a histogram of data divided into 1 sec bins. Red curve is a Poisson curve with rate = median count rate of data. |
 |
 |
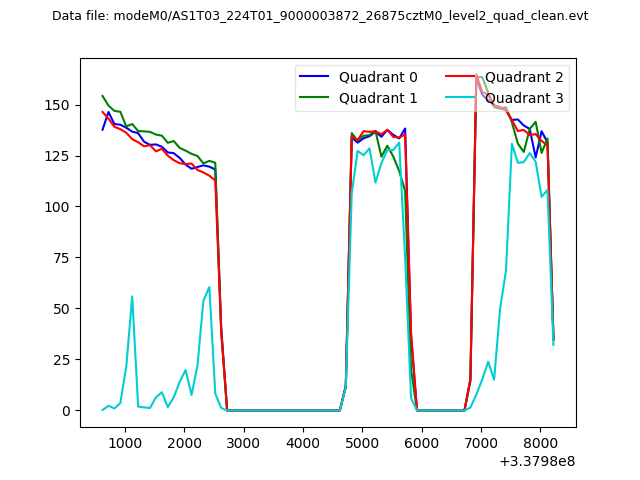
| Quadrant-wise count rates Data is divided into 100 sec bins |
 |
|
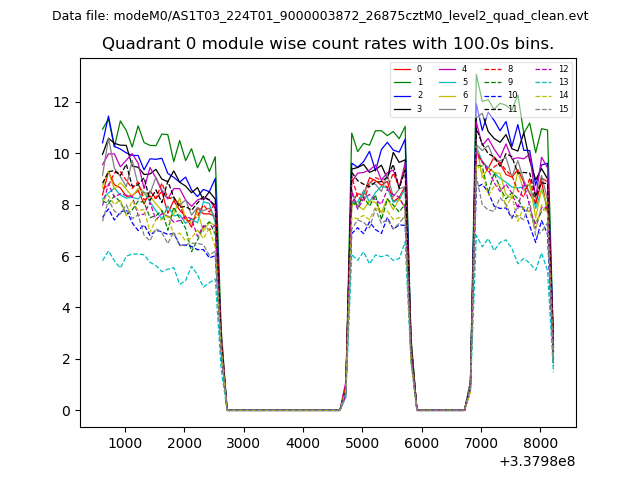
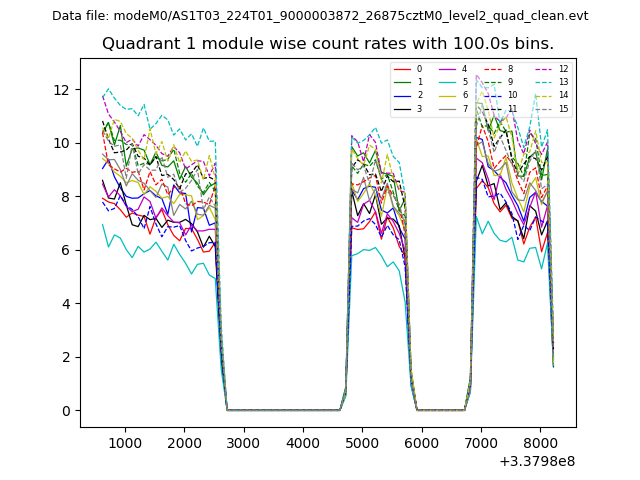
| Module-wise count rates for Quadrant A Data is divided into 100 sec bins |
 |
 |
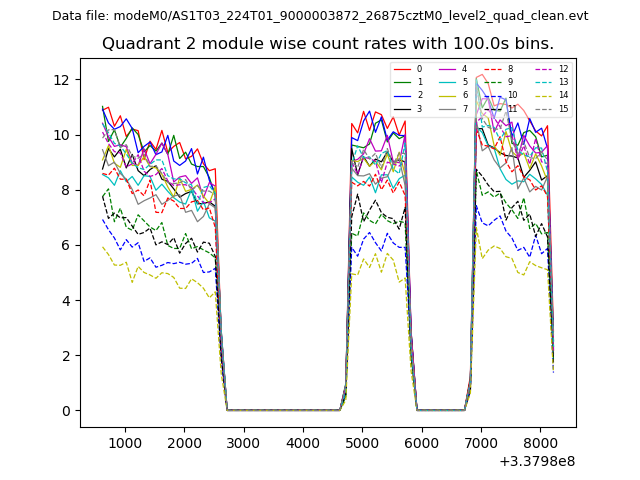
| Module-wise count rates for Quadrant B Data is divided into 100 sec bins |
 |
 |
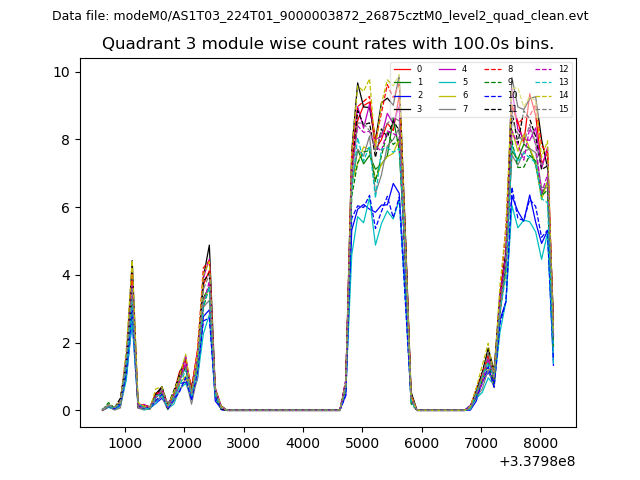
| Module-wise count rates for Quadrant C Data is divided into 100 sec bins |
 |
 |
| Module-wise count rates for Quadrant D Data is divided into 100 sec bins |
 |
 |
| Parameter | Plot |
|---|---|
| CZT HV Monitor | 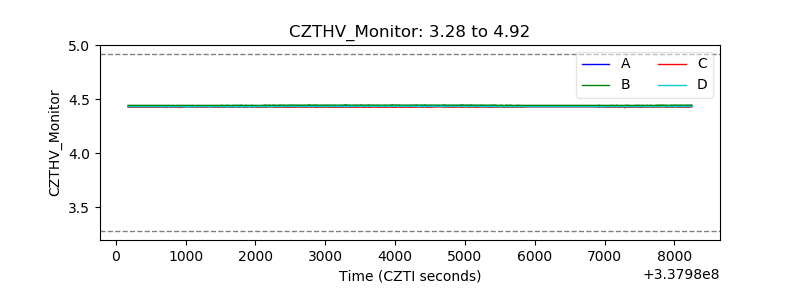 |
| D_VDD | 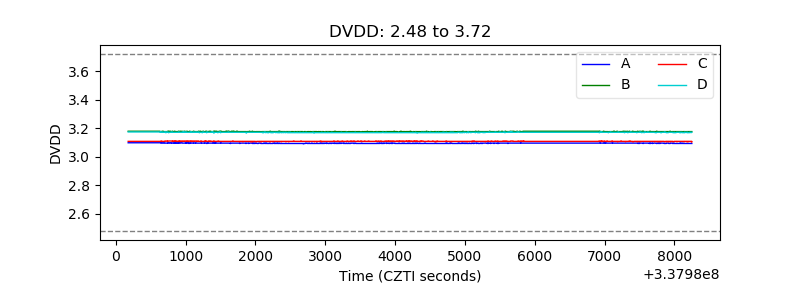 |
| Temperature 1 | 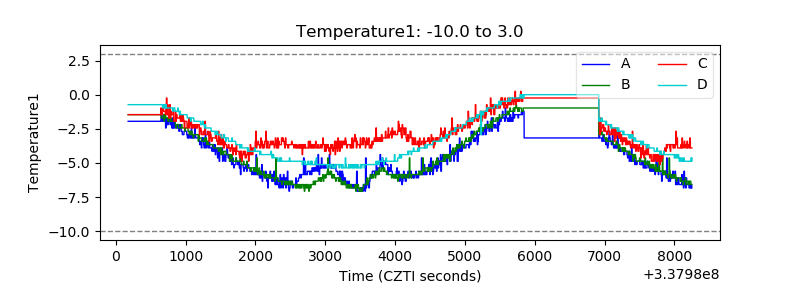 |
| Veto HV Monitor | 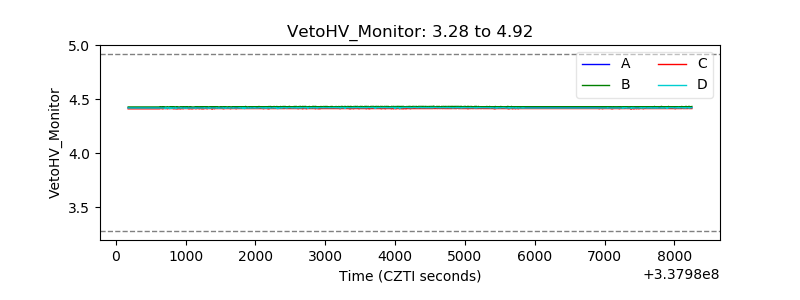 |
| Veto LLD | 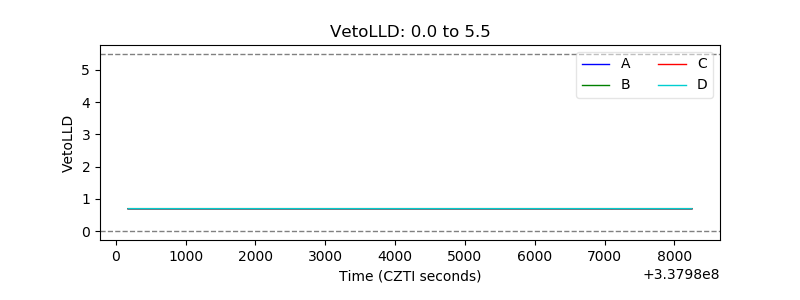 |
| Alpha Counter | 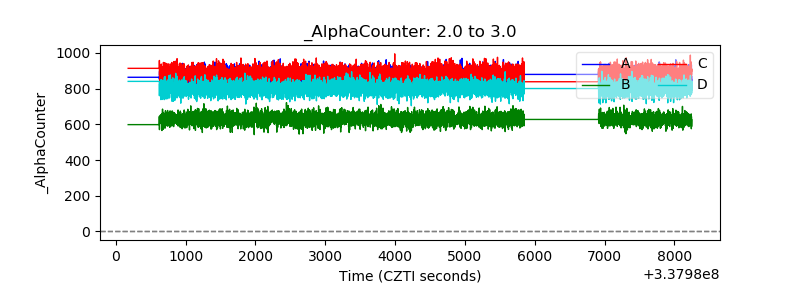 |
| _CPM_Rate | 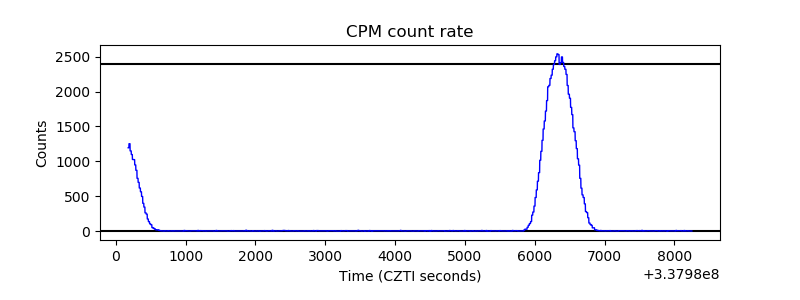 |
| CZT Counter | 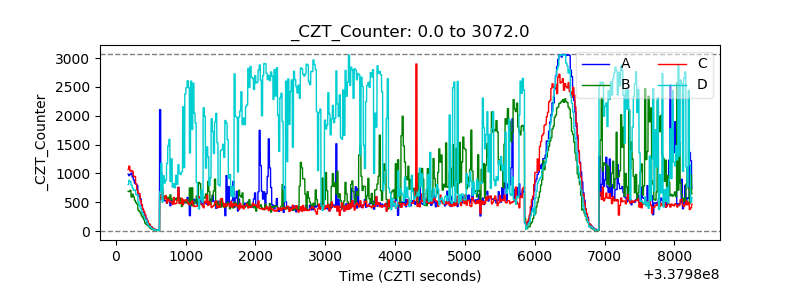 |
| +2.5 Volts monitor |  |
| +5 Volts monitor | 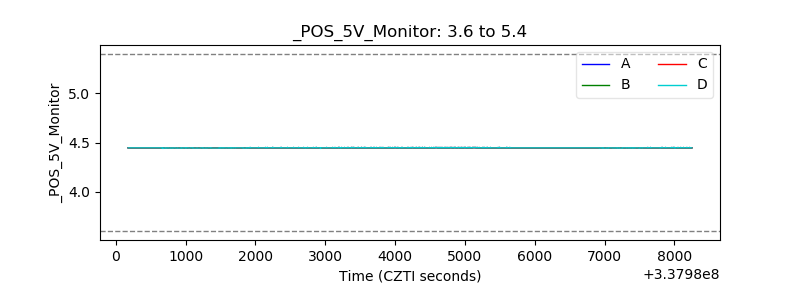 |
| _ROLL_ROT | 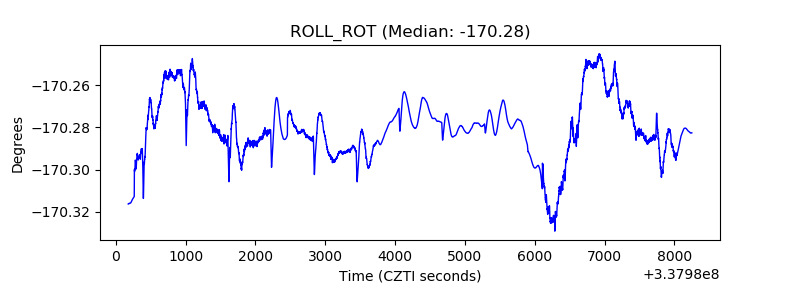 |
| _Roll_DEC | 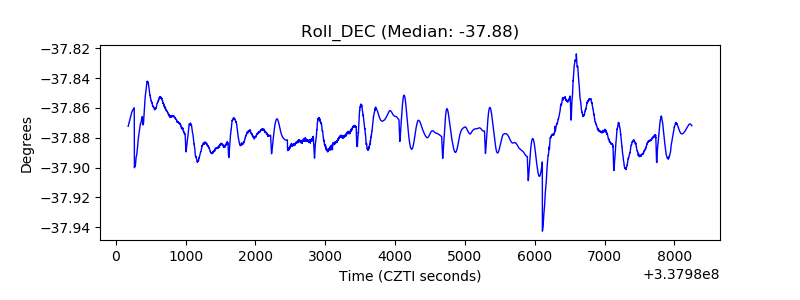 |
| _Roll_RA | 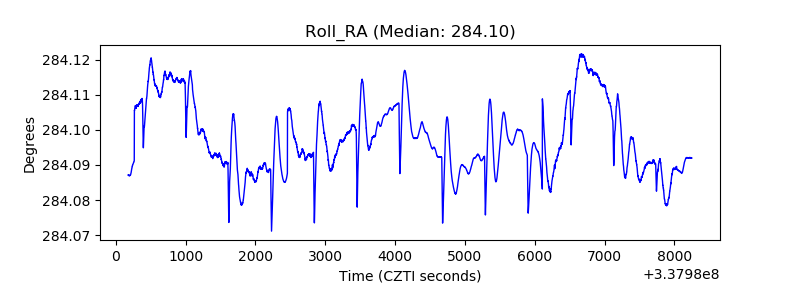 |
| Veto Counter | 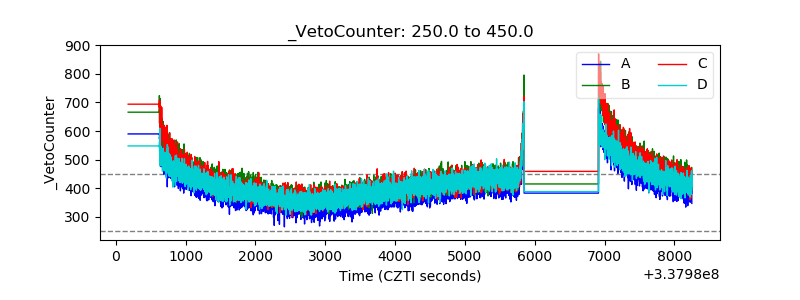 |