| Param | Original file | Final file |
|---|---|---|
| Filename | modeM0/AS1T03_224T01_9000003872_26877cztM0_level2.evt | modeM0/AS1T03_224T01_9000003872_26877cztM0_level2_quad_clean.evt |
| Size (bytes) | 636,739,200 | 87,886,080 |
| Size | 607.2 MB | 83.8 MB |
| Events in quadrant A | 3,708,950 | 596,502 |
| Events in quadrant B | 4,665,136 | 609,126 |
| Events in quadrant C | 3,167,629 | 593,225 |
| Events in quadrant D | 7,311,518 | 418,067 |
| Mode M0 | |||
|---|---|---|---|
| Quadrant | BADHDUFLAG | Total packets | Discarded packets |
| A | 0 | 14909 | 0 |
| B | 0 | 18026 | 0 |
| C | 0 | 13273 | 0 |
| D | 0 | 26075 | 0 |
| Mode M9 | |||
|---|---|---|---|
| Quadrant | BADHDUFLAG | Total packets | Discarded packets |
| A | 0 | 17 | 0 |
| B | 0 | 18 | 0 |
| C | 0 | 18 | 0 |
| D | 0 | 18 | 0 |
| Quadrant | Total seconds | Saturated seconds | Saturation percentage |
|---|---|---|---|
| A | 6365 | 60 | 0.942655% |
| B | 6365 | 293 | 4.603299% |
| C | 6365 | 57 | 0.895522% |
| D | 6365 | 1704 | 26.771406% |
Noise dominated data is calculated using 1-second bins in cleaned event files. If a bin has >2000 counts, and if more than 50% of those come from <1% of pixels, then it is considered to be noise-dominated and hence unusable.
| Quadrant | # 1 sec bins | Bins with >0 counts | Bins with >2000 counts | High rate bins dominated by noise | Noise dominated (total time) | Noise dominated (detector-on time) | Marked lightcurve |
|---|---|---|---|---|---|---|---|
| A | 7555 | 6366 | 34 | 34 | 0.45% | 0.53% | 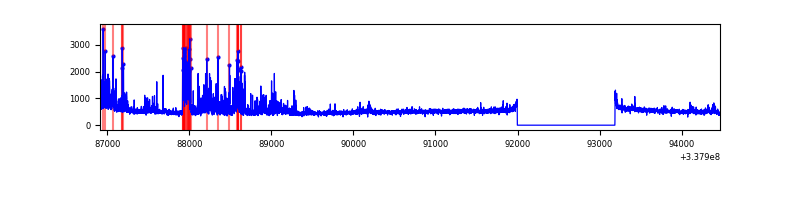 |
| B | 7555 | 6365 | 159 | 159 | 2.10% | 2.50% | 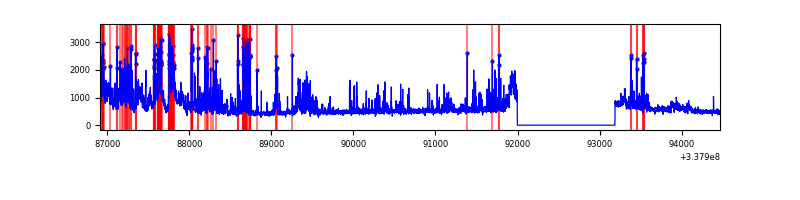 |
| C | 7555 | 6366 | 0 | 0 | 0.00% | 0.00% | 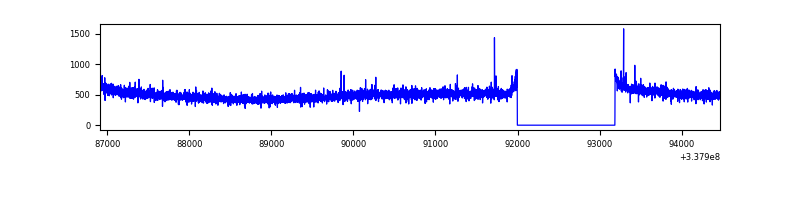 |
| D | 7555 | 6365 | 1185 | 1185 | 15.68% | 18.62% | 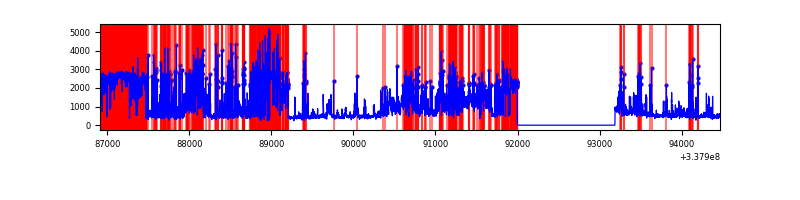 |
Top three noisy pixels from each quadrant. If the there are fewer than three noisy pixels in the level2.evt file, extra rows are filled as -1
| Pixel properties | Quadrant properties | ||||||
|---|---|---|---|---|---|---|---|
| Quadrant | DetID | PixID | Counts | Sigma | Mean | Median | Sigma |
| A | 0 | 13 | 615938 | 3819.52 | 802 | 788 | 161.1 |
| A | 13 | 254 | 10447 | 59.97 | 802 | 788 | 161.1 |
| A | 3 | 137 | 7351 | 40.75 | 802 | 788 | 161.1 |
| B | 0 | 189 | 554415 | 3640.39 | 801 | 783 | 152.1 |
| B | 3 | 112 | 510836 | 3353.84 | 801 | 783 | 152.1 |
| B | 3 | 64 | 219561 | 1438.57 | 801 | 783 | 152.1 |
| C | 14 | 238 | 124495 | 682.59 | 775 | 781 | 181.2 |
| C | 2 | 16 | 11272 | 57.88 | 775 | 781 | 181.2 |
| C | 13 | 61 | 5283 | 24.84 | 775 | 781 | 181.2 |
| D | 7 | 80 | 4258806 | 29372.92 | 619 | 606 | 145.0 |
| D | 1 | 52 | 388996 | 2679.1 | 619 | 606 | 145.0 |
| D | 2 | 250 | 155674 | 1069.65 | 619 | 606 | 145.0 |
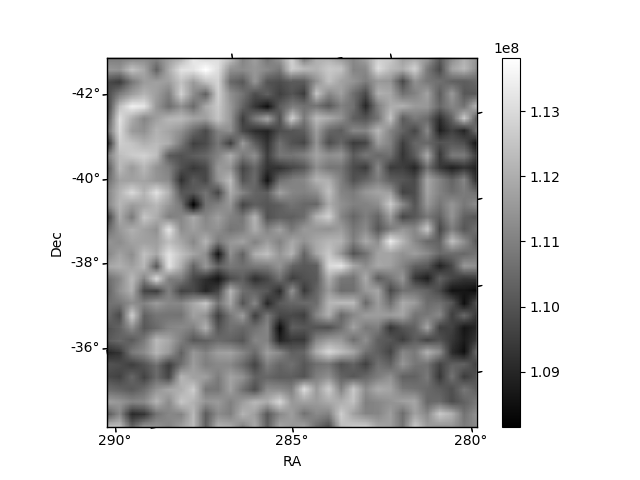
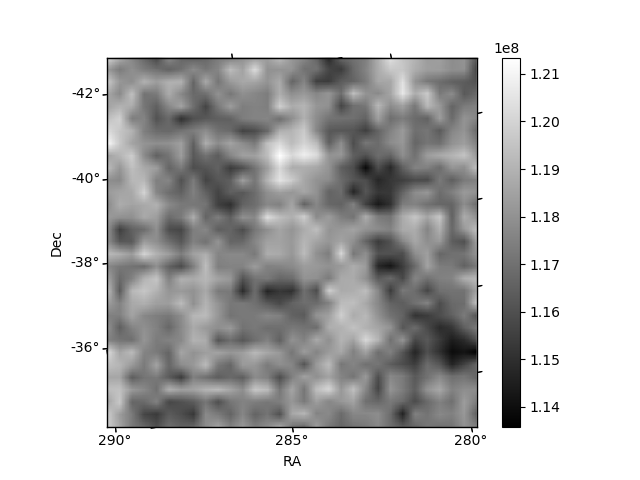
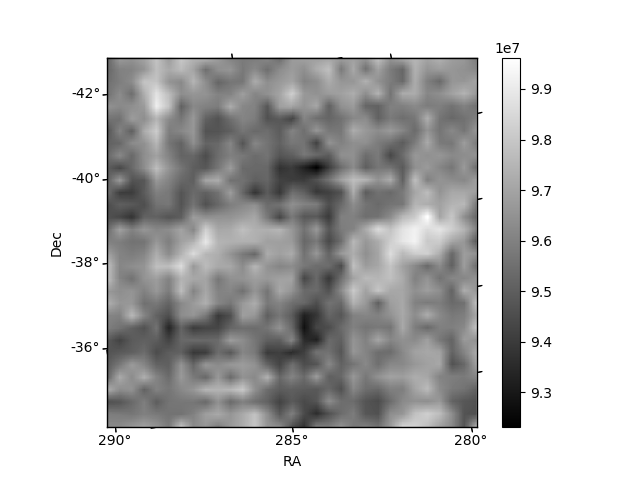
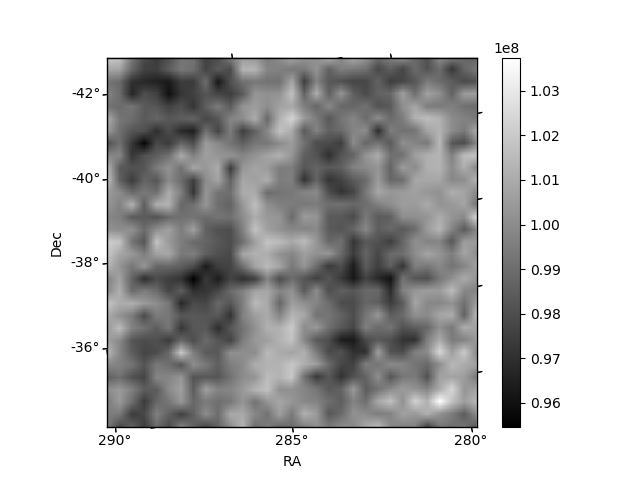
Histogram calculated using DETX and DETY for each event in the final _common_clean file
| Quadrant A | 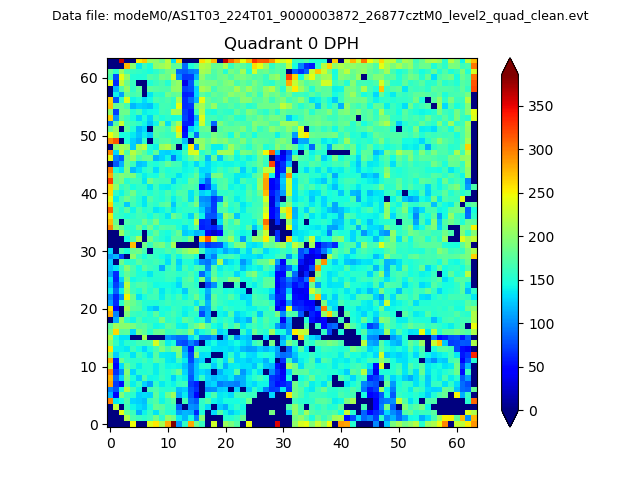 |
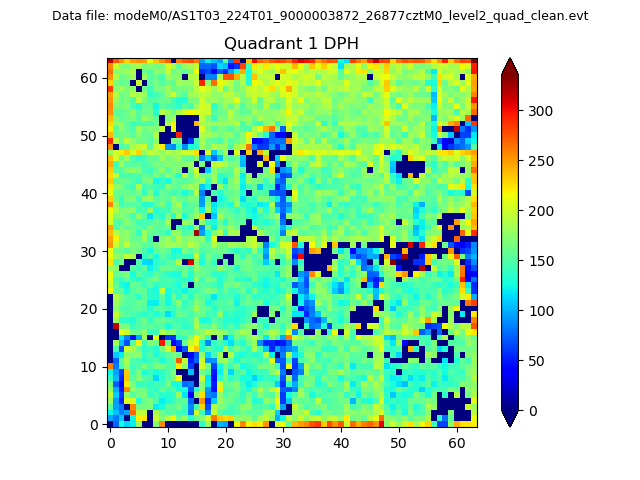 |
Quadrant B |
|---|---|---|---|
| Quadrant D | 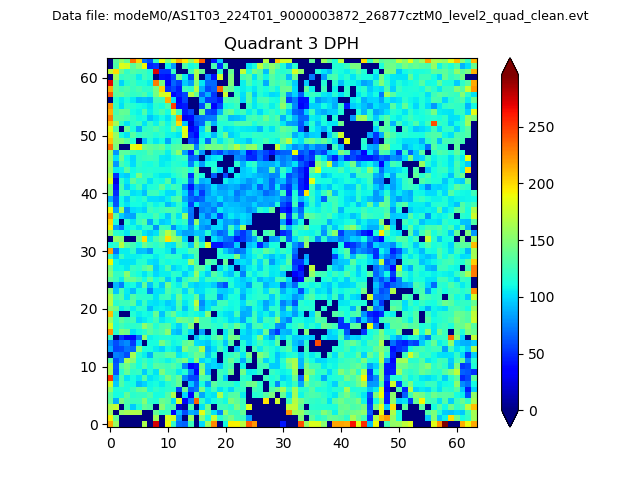 |
 |
Quadrant C |
| Plot type | Count rate plots | Images |
|---|---|---|
| Comparison with Poisson distribution Blue bars denote a histogram of data divided into 1 sec bins. Red curve is a Poisson curve with rate = median count rate of data. |
 |
 |
| Quadrant-wise count rates Data is divided into 100 sec bins |
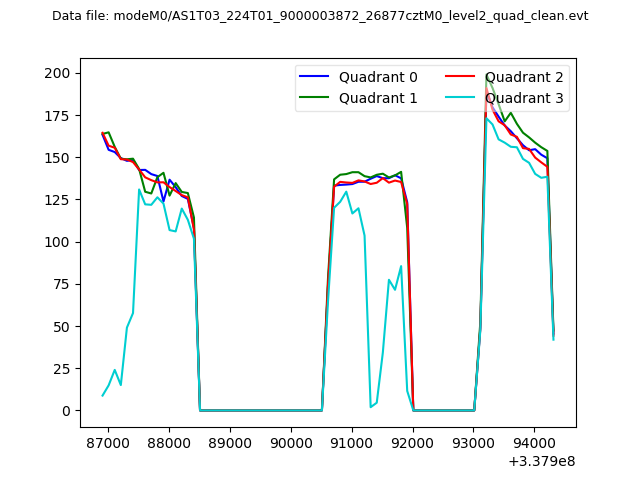 |
|
| Module-wise count rates for Quadrant A Data is divided into 100 sec bins |
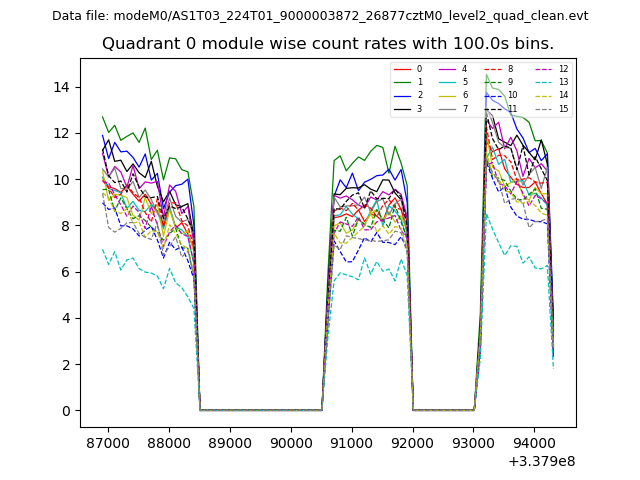 |
 |
| Module-wise count rates for Quadrant B Data is divided into 100 sec bins |
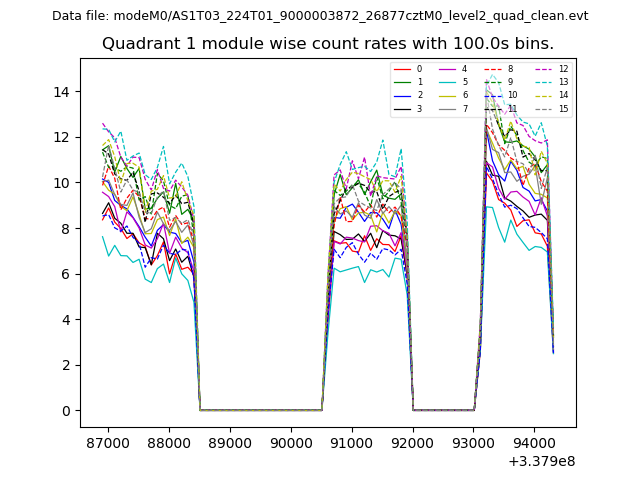 |
 |
| Module-wise count rates for Quadrant C Data is divided into 100 sec bins |
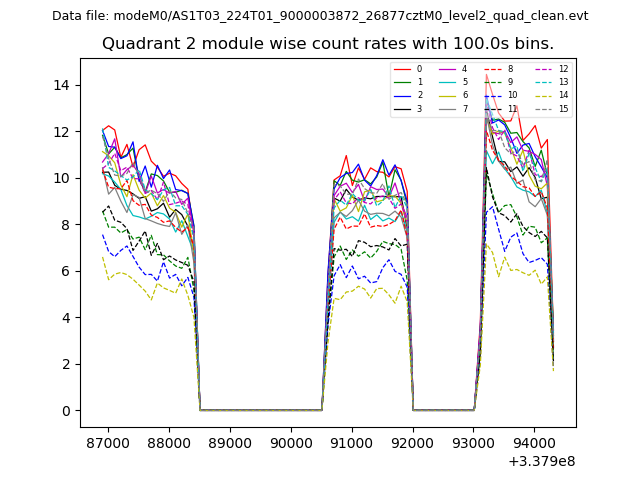 |
 |
| Module-wise count rates for Quadrant D Data is divided into 100 sec bins |
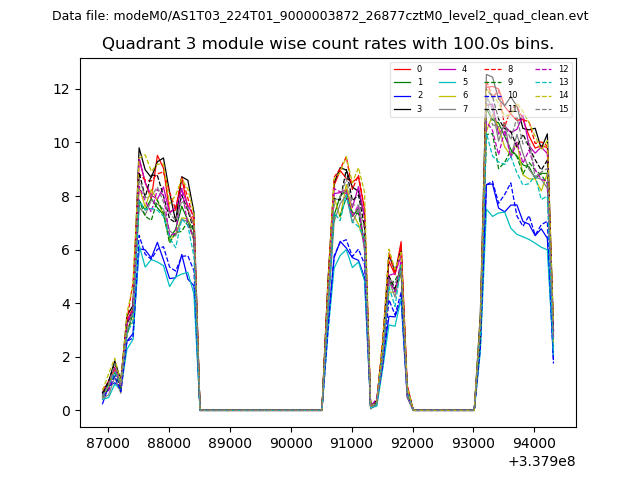 |
 |
| Parameter | Plot |
|---|---|
| CZT HV Monitor | 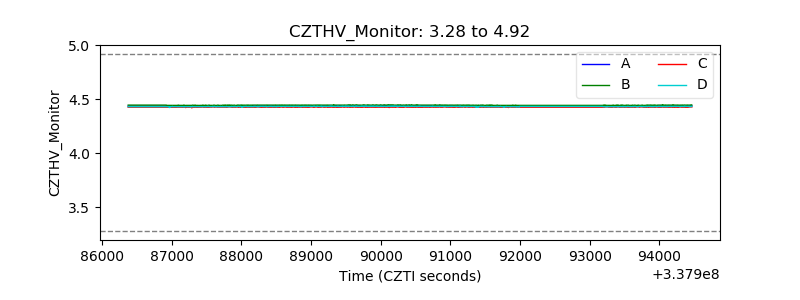 |
| D_VDD | 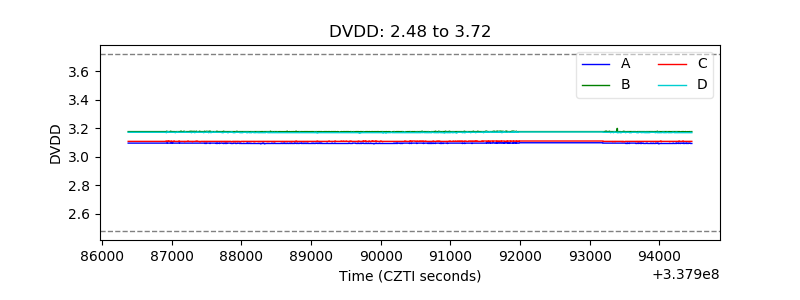 |
| Temperature 1 | 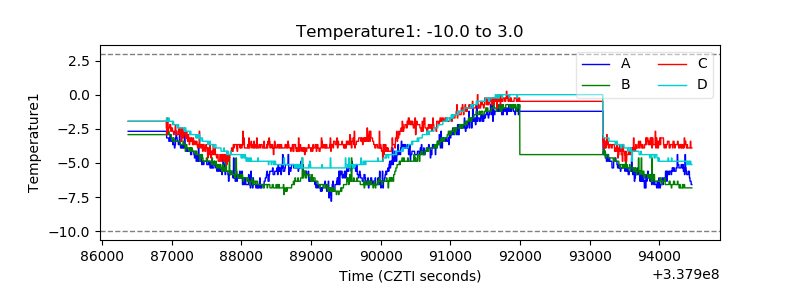 |
| Veto HV Monitor | 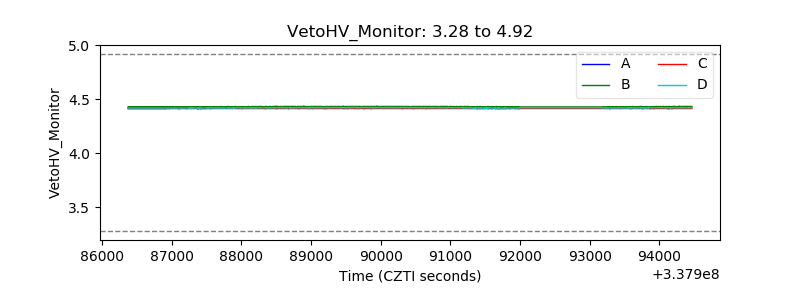 |
| Veto LLD | 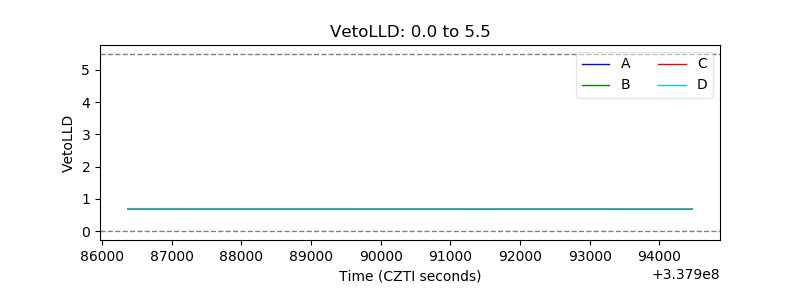 |
| Alpha Counter | 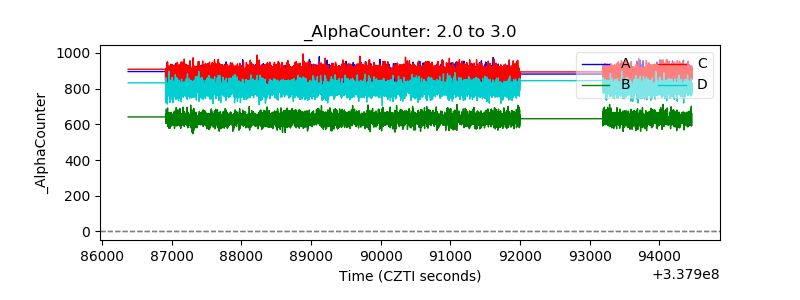 |
| _CPM_Rate | 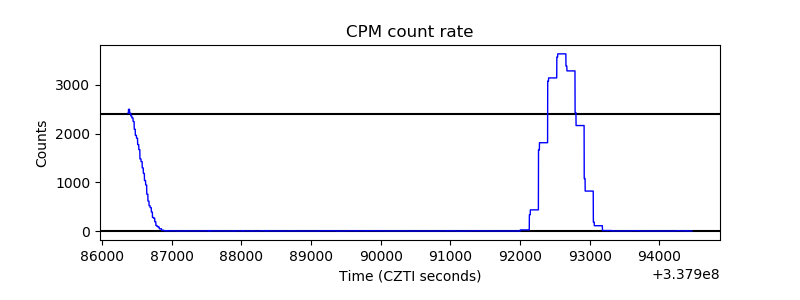 |
| CZT Counter |  |
| +2.5 Volts monitor |  |
| +5 Volts monitor |  |
| _ROLL_ROT |  |
| _Roll_DEC | 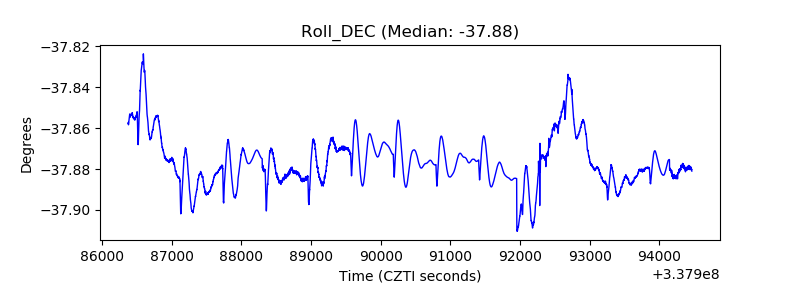 |
| _Roll_RA |  |
| Veto Counter | 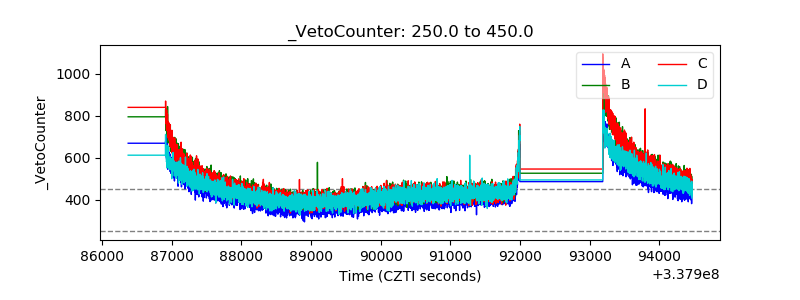 |