| Param | Original file | Final file |
|---|---|---|
| Filename | modeM0/AS1T03_224T01_9000003872_26878cztM0_level2.evt | modeM0/AS1T03_224T01_9000003872_26878cztM0_level2_quad_clean.evt |
| Size (bytes) | 543,026,880 | 89,205,120 |
| Size | 517.9 MB | 85.1 MB |
| Events in quadrant A | 3,489,689 | 565,695 |
| Events in quadrant B | 3,702,467 | 588,342 |
| Events in quadrant C | 3,422,709 | 563,061 |
| Events in quadrant D | 5,392,350 | 533,195 |
| Mode M0 | |||
|---|---|---|---|
| Quadrant | BADHDUFLAG | Total packets | Discarded packets |
| A | 0 | 14257 | 0 |
| B | 0 | 15045 | 0 |
| C | 0 | 13979 | 0 |
| D | 0 | 20230 | 0 |
| Mode M9 | |||
|---|---|---|---|
| Quadrant | BADHDUFLAG | Total packets | Discarded packets |
| A | 0 | 20 | 0 |
| B | 0 | 21 | 0 |
| C | 0 | 21 | 0 |
| D | 0 | 21 | 0 |
| Quadrant | Total seconds | Saturated seconds | Saturation percentage |
|---|---|---|---|
| A | 6473 | 23 | 0.355322% |
| B | 6473 | 75 | 1.158659% |
| C | 6473 | 65 | 1.004171% |
| D | 6473 | 529 | 8.172408% |
Noise dominated data is calculated using 1-second bins in cleaned event files. If a bin has >2000 counts, and if more than 50% of those come from <1% of pixels, then it is considered to be noise-dominated and hence unusable.
| Quadrant | # 1 sec bins | Bins with >0 counts | Bins with >2000 counts | High rate bins dominated by noise | Noise dominated (total time) | Noise dominated (detector-on time) | Marked lightcurve |
|---|---|---|---|---|---|---|---|
| A | 7753 | 6474 | 0 | 0 | 0.00% | 0.00% | 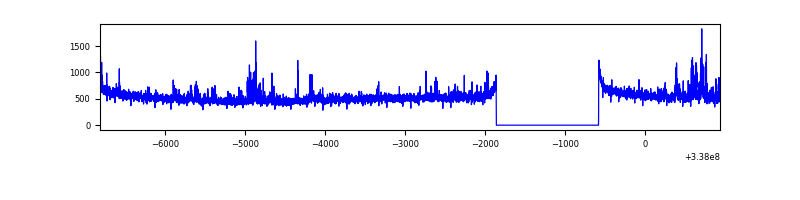 |
| B | 7753 | 6473 | 18 | 18 | 0.23% | 0.28% | 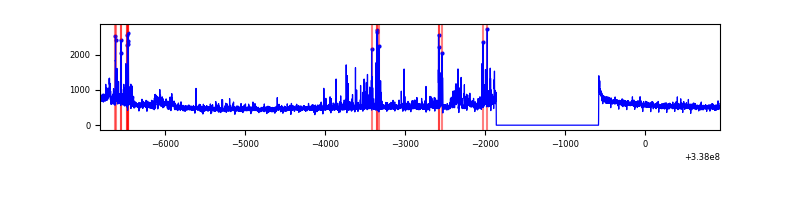 |
| C | 7753 | 6473 | 0 | 0 | 0.00% | 0.00% | 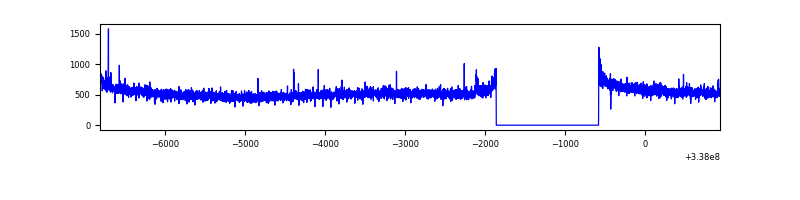 |
| D | 7753 | 6473 | 525 | 525 | 6.77% | 8.11% | 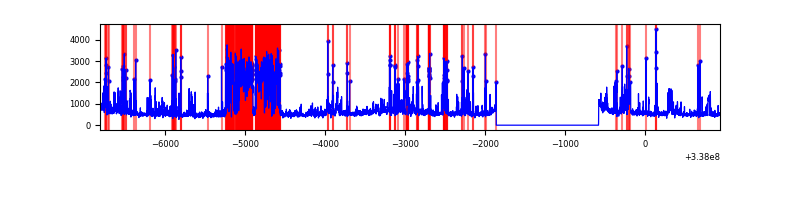 |
Top three noisy pixels from each quadrant. If the there are fewer than three noisy pixels in the level2.evt file, extra rows are filled as -1
| Pixel properties | Quadrant properties | ||||||
|---|---|---|---|---|---|---|---|
| Quadrant | DetID | PixID | Counts | Sigma | Mean | Median | Sigma |
| A | 0 | 13 | 184760 | 1088.87 | 857 | 843 | 168.9 |
| A | 13 | 254 | 10536 | 57.38 | 857 | 843 | 168.9 |
| A | 3 | 137 | 7610 | 40.06 | 857 | 843 | 168.9 |
| B | 0 | 189 | 151932 | 945.75 | 866 | 848 | 159.8 |
| B | 0 | 190 | 65483 | 404.6 | 866 | 848 | 159.8 |
| B | 10 | 246 | 50970 | 313.75 | 866 | 848 | 159.8 |
| C | 14 | 238 | 136173 | 702.18 | 836 | 846 | 192.7 |
| C | 0 | 79 | 21630 | 107.84 | 836 | 846 | 192.7 |
| C | 13 | 61 | 5704 | 25.21 | 836 | 846 | 192.7 |
| D | 7 | 80 | 1642775 | 8706.81 | 810 | 792 | 188.6 |
| D | 2 | 250 | 234937 | 1241.58 | 810 | 792 | 188.6 |
| D | 1 | 52 | 232582 | 1229.09 | 810 | 792 | 188.6 |
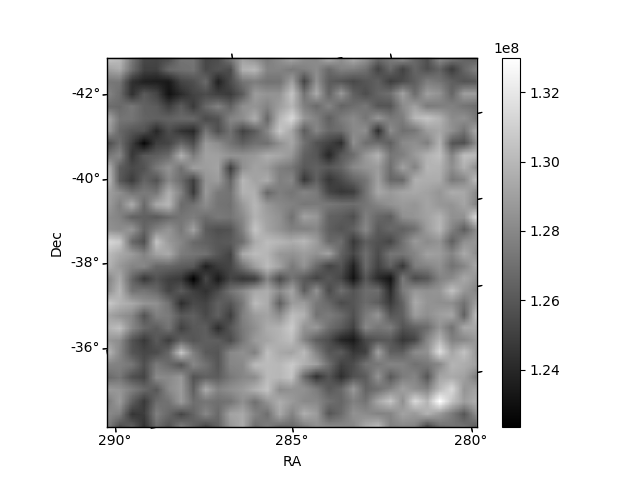
Histogram calculated using DETX and DETY for each event in the final _common_clean file
| Quadrant A | 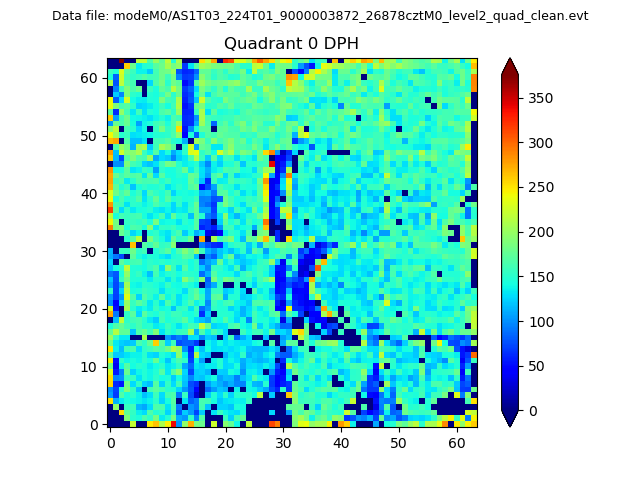 |
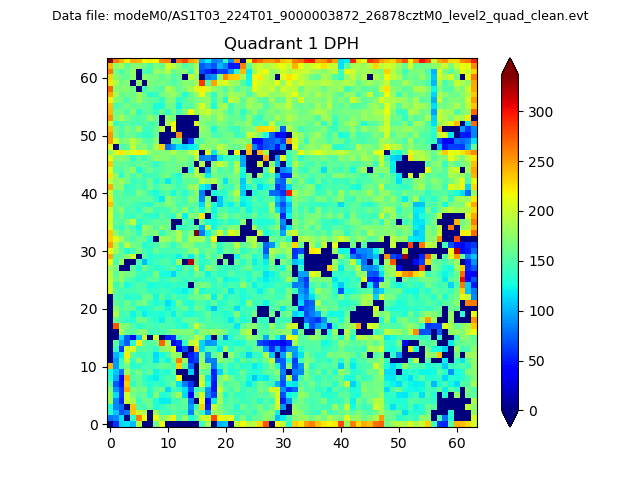 |
Quadrant B |
|---|---|---|---|
| Quadrant D | 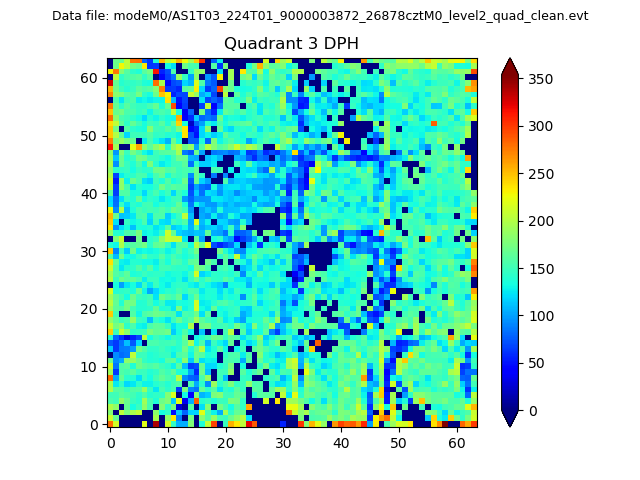 |
 |
Quadrant C |
| Plot type | Count rate plots | Images |
|---|---|---|
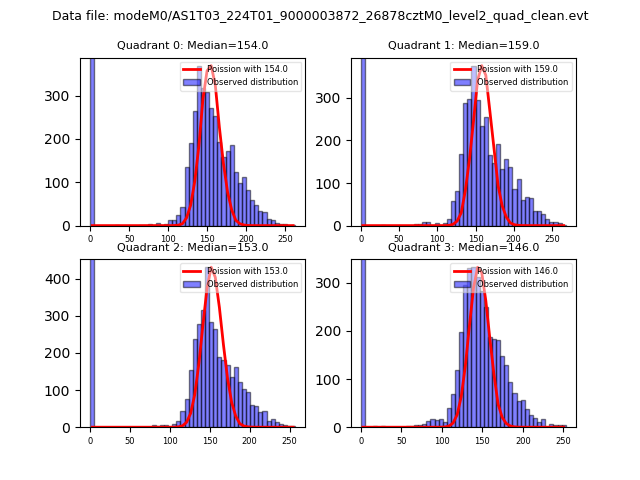
| Comparison with Poisson distribution Blue bars denote a histogram of data divided into 1 sec bins. Red curve is a Poisson curve with rate = median count rate of data. |
 |
 |
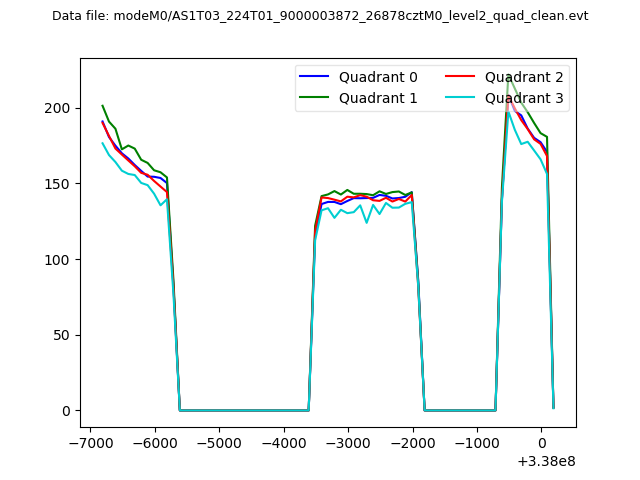
| Quadrant-wise count rates Data is divided into 100 sec bins |
 |
|
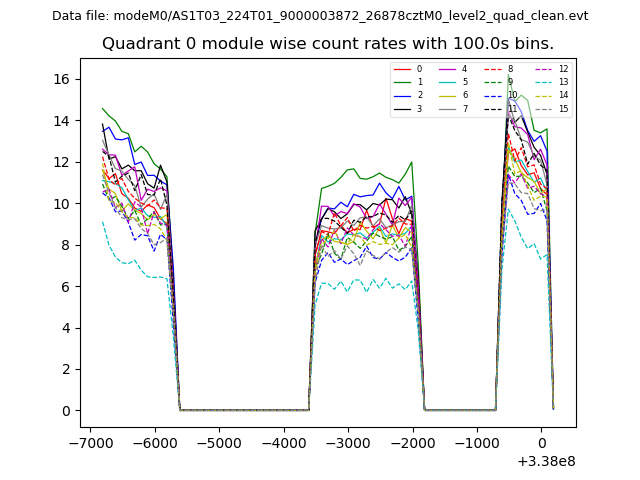
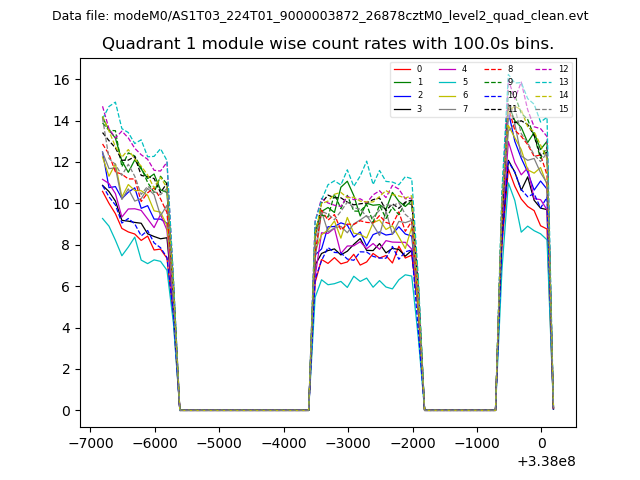
| Module-wise count rates for Quadrant A Data is divided into 100 sec bins |
 |
 |
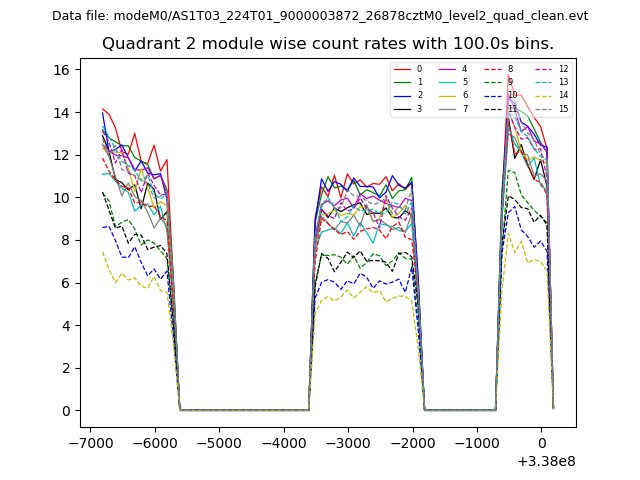
| Module-wise count rates for Quadrant B Data is divided into 100 sec bins |
 |
 |
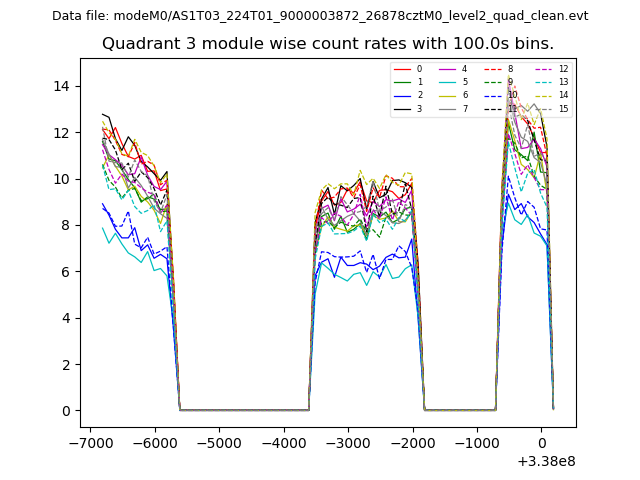
| Module-wise count rates for Quadrant C Data is divided into 100 sec bins |
 |
 |
| Module-wise count rates for Quadrant D Data is divided into 100 sec bins |
 |
 |
| Parameter | Plot |
|---|---|
| CZT HV Monitor | 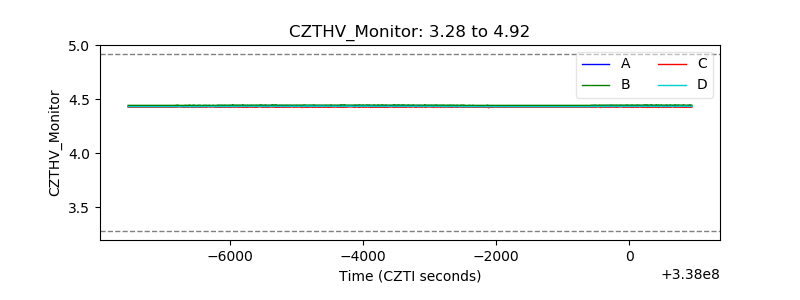 |
| D_VDD | 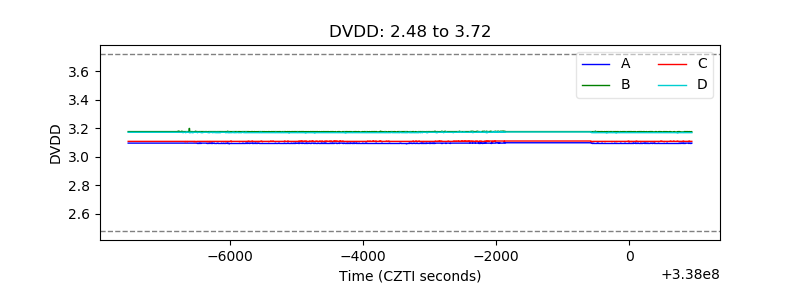 |
| Temperature 1 |  |
| Veto HV Monitor | 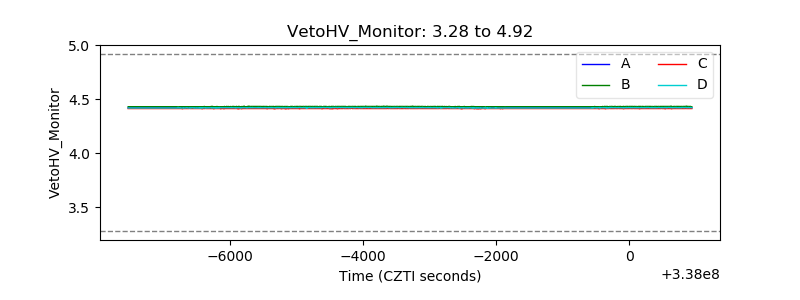 |
| Veto LLD | 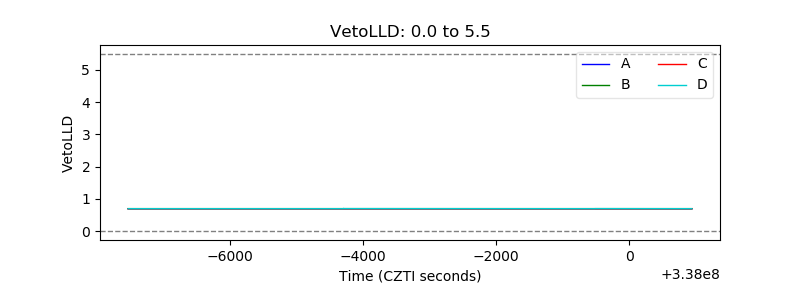 |
| Alpha Counter | 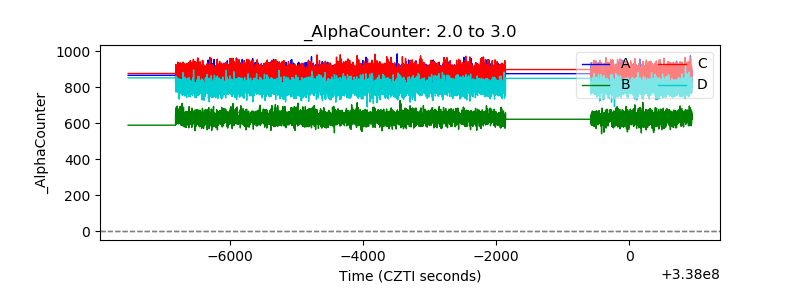 |
| _CPM_Rate | 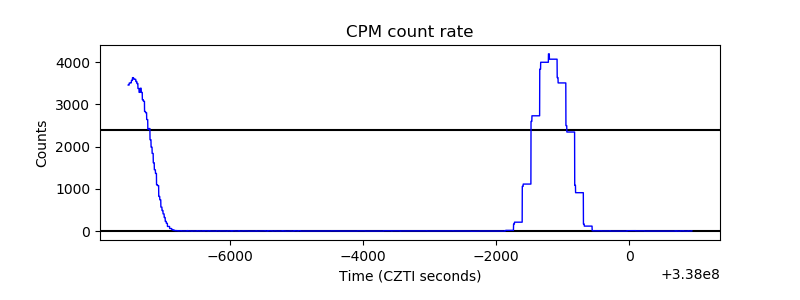 |
| CZT Counter | 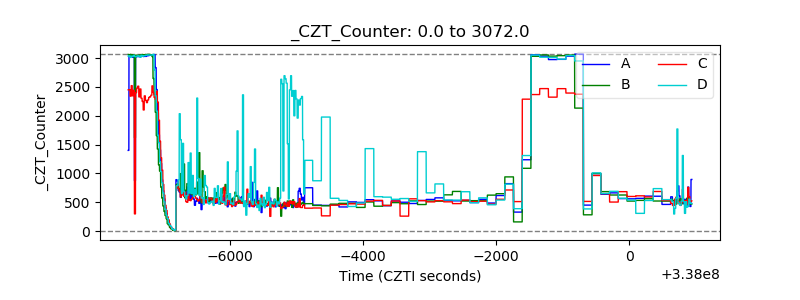 |
| +2.5 Volts monitor |  |
| +5 Volts monitor |  |
| _ROLL_ROT |  |
| _Roll_DEC |  |
| _Roll_RA | 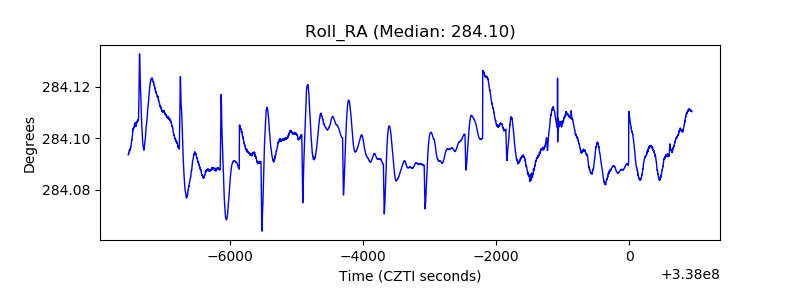 |
| Veto Counter | 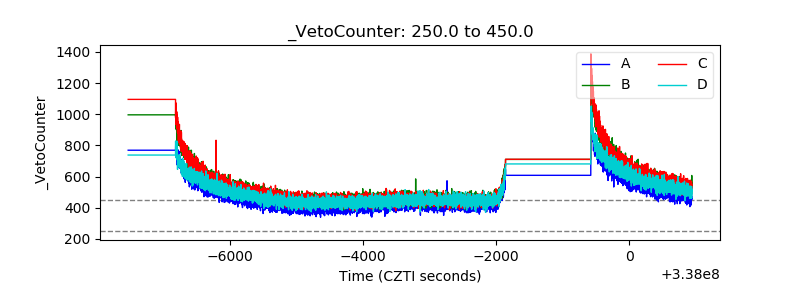 |