| Param | Original file | Final file |
|---|---|---|
| Filename | modeM0/AS1T03_224T01_9000003872_26879cztM0_level2.evt | modeM0/AS1T03_224T01_9000003872_26879cztM0_level2_quad_clean.evt |
| Size (bytes) | 517,452,480 | 81,619,200 |
| Size | 493.5 MB | 77.8 MB |
| Events in quadrant A | 3,644,325 | 507,693 |
| Events in quadrant B | 3,658,334 | 526,893 |
| Events in quadrant C | 3,722,737 | 505,590 |
| Events in quadrant D | 4,213,781 | 486,568 |
| Mode M0 | |||
|---|---|---|---|
| Quadrant | BADHDUFLAG | Total packets | Discarded packets |
| A | 0 | 14660 | 0 |
| B | 0 | 14686 | 0 |
| C | 0 | 15065 | 0 |
| D | 0 | 16534 | 0 |
| Mode M9 | |||
|---|---|---|---|
| Quadrant | BADHDUFLAG | Total packets | Discarded packets |
| A | 0 | 19 | 0 |
| B | 0 | 20 | 0 |
| C | 0 | 20 | 0 |
| D | 0 | 20 | 0 |
| Quadrant | Total seconds | Saturated seconds | Saturation percentage |
|---|---|---|---|
| A | 6372 | 31 | 0.486503% |
| B | 6371 | 82 | 1.287082% |
| C | 6371 | 93 | 1.459739% |
| D | 6371 | 137 | 2.150369% |
Noise dominated data is calculated using 1-second bins in cleaned event files. If a bin has >2000 counts, and if more than 50% of those come from <1% of pixels, then it is considered to be noise-dominated and hence unusable.
| Quadrant | # 1 sec bins | Bins with >0 counts | Bins with >2000 counts | High rate bins dominated by noise | Noise dominated (total time) | Noise dominated (detector-on time) | Marked lightcurve |
|---|---|---|---|---|---|---|---|
| A | 7737 | 6373 | 0 | 0 | 0.00% | 0.00% | 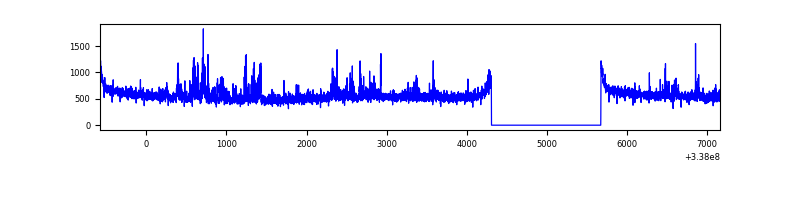 |
| B | 7736 | 6372 | 15 | 15 | 0.19% | 0.24% | 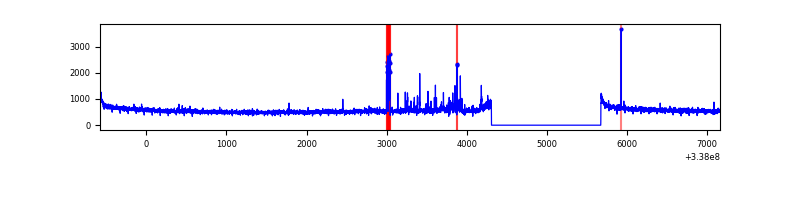 |
| C | 7736 | 6372 | 0 | 0 | 0.00% | 0.00% | 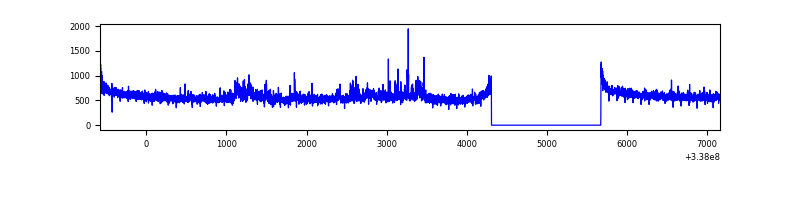 |
| D | 7736 | 6372 | 104 | 104 | 1.34% | 1.63% | 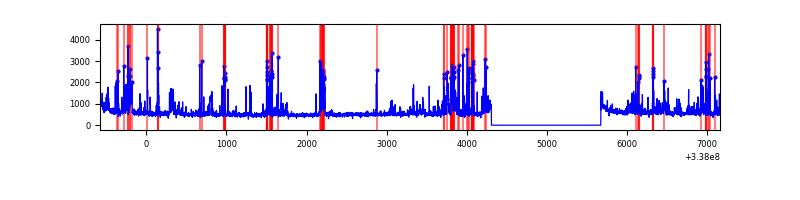 |
Top three noisy pixels from each quadrant. If the there are fewer than three noisy pixels in the level2.evt file, extra rows are filled as -1
| Pixel properties | Quadrant properties | ||||||
|---|---|---|---|---|---|---|---|
| Quadrant | DetID | PixID | Counts | Sigma | Mean | Median | Sigma |
| A | 0 | 13 | 240049 | 1379.33 | 883 | 871 | 173.4 |
| A | 13 | 254 | 10095 | 53.19 | 883 | 871 | 173.4 |
| A | 3 | 137 | 7879 | 40.41 | 883 | 871 | 173.4 |
| B | 10 | 246 | 73540 | 442.02 | 892 | 871 | 164.4 |
| B | 0 | 190 | 65319 | 392.01 | 892 | 871 | 164.4 |
| B | 12 | 111 | 19087 | 110.8 | 892 | 871 | 164.4 |
| C | 0 | 79 | 189556 | 952.95 | 868 | 877 | 198.0 |
| C | 14 | 238 | 144687 | 726.34 | 868 | 877 | 198.0 |
| C | 13 | 61 | 6068 | 26.22 | 868 | 877 | 198.0 |
| D | 7 | 80 | 555569 | 2776.93 | 856 | 839 | 199.8 |
| D | 11 | 176 | 160749 | 800.5 | 856 | 839 | 199.8 |
| D | 1 | 52 | 126764 | 630.37 | 856 | 839 | 199.8 |
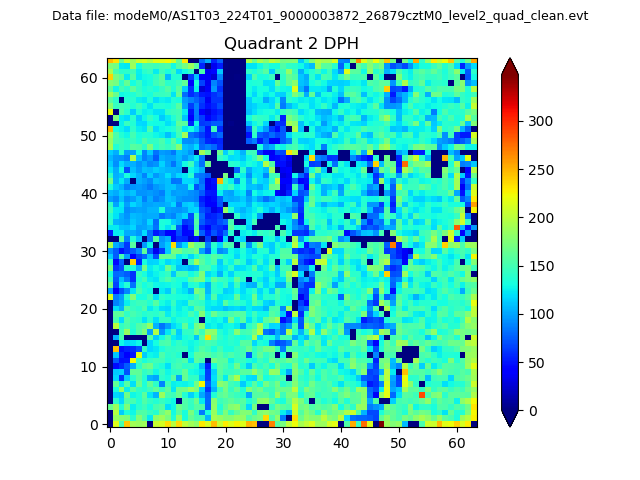
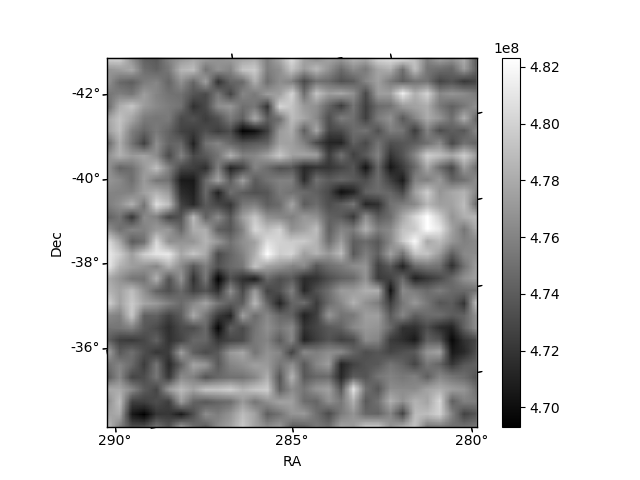
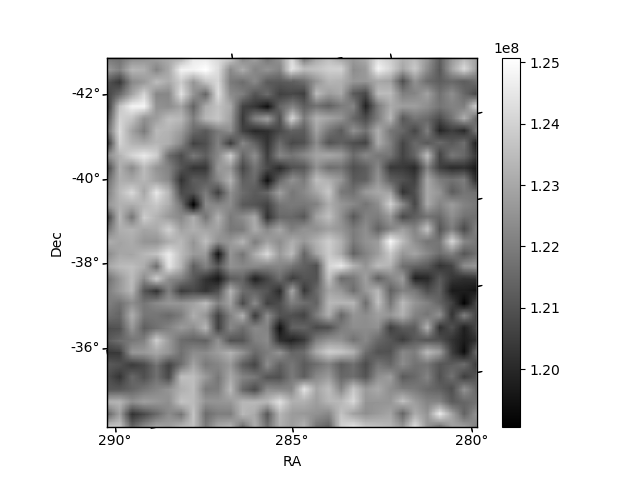
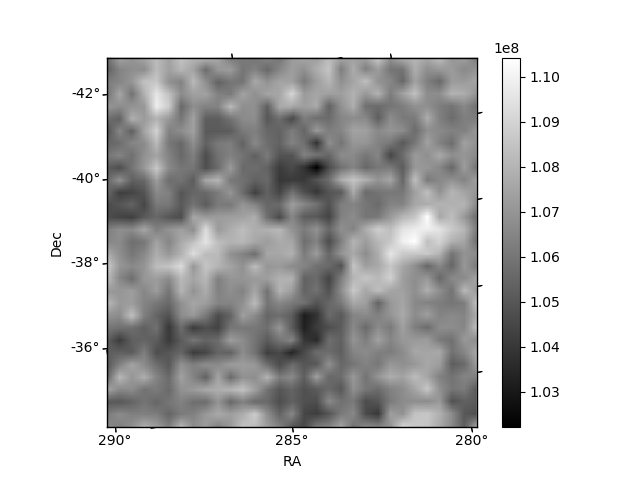
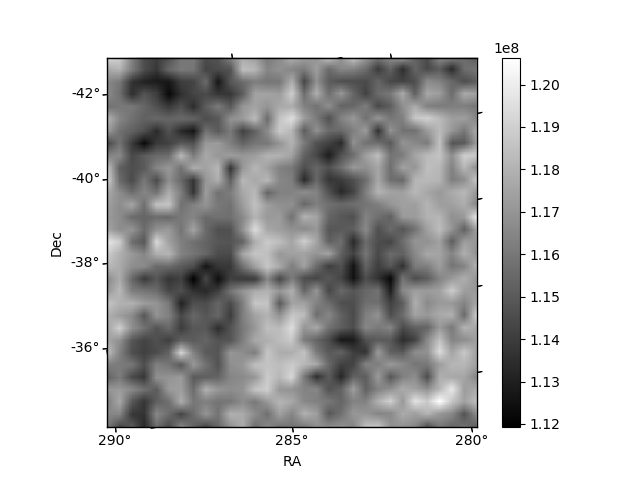
Histogram calculated using DETX and DETY for each event in the final _common_clean file
| Quadrant A | 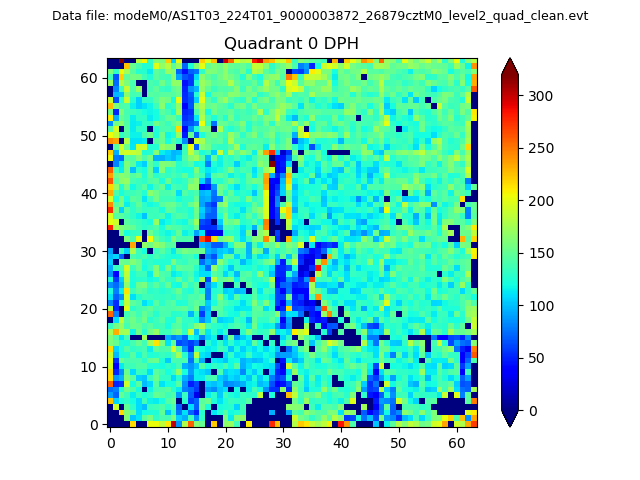 |
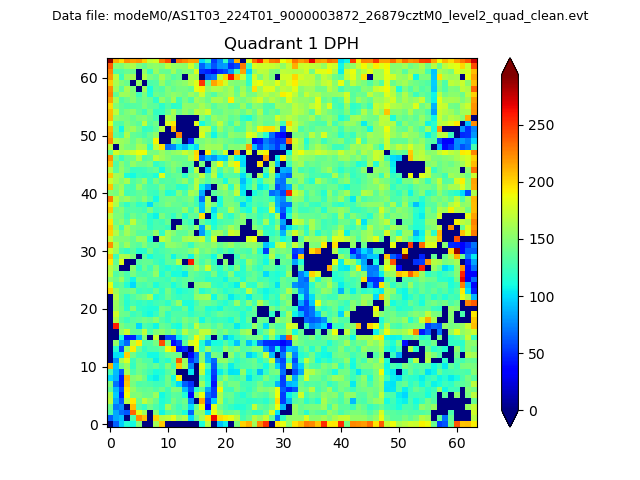 |
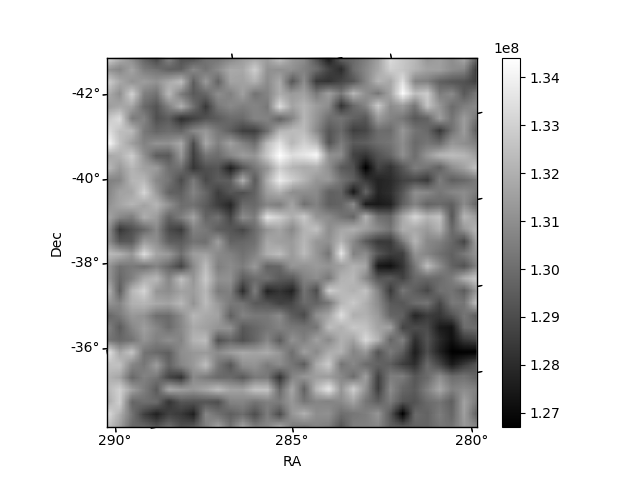
Quadrant B |
|---|---|---|---|
| Quadrant D | 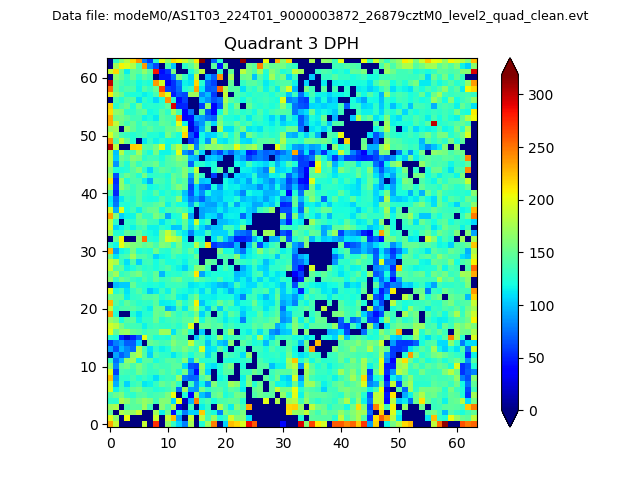 |
 |
Quadrant C |
| Plot type | Count rate plots | Images |
|---|---|---|
| Comparison with Poisson distribution Blue bars denote a histogram of data divided into 1 sec bins. Red curve is a Poisson curve with rate = median count rate of data. |
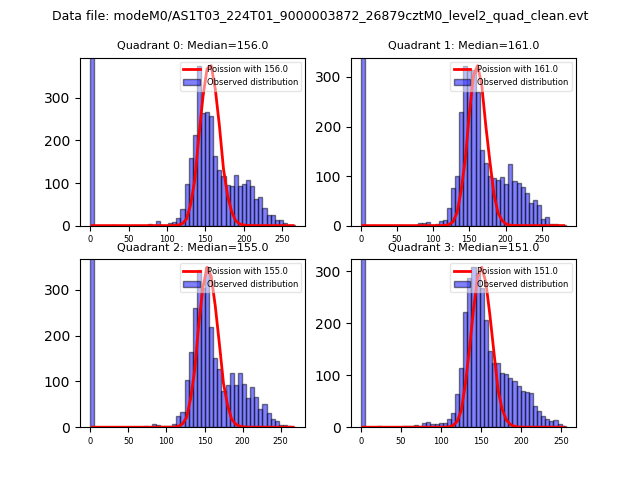 |
 |
| Quadrant-wise count rates Data is divided into 100 sec bins |
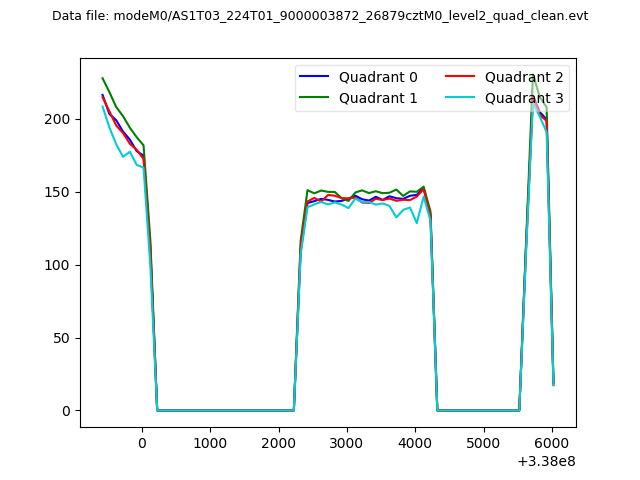 |
|
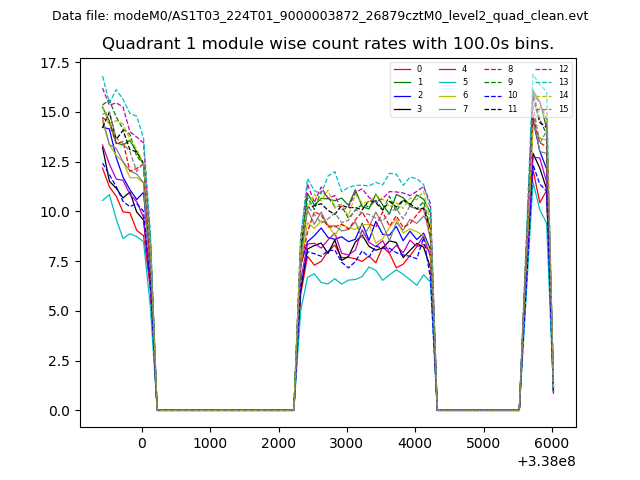
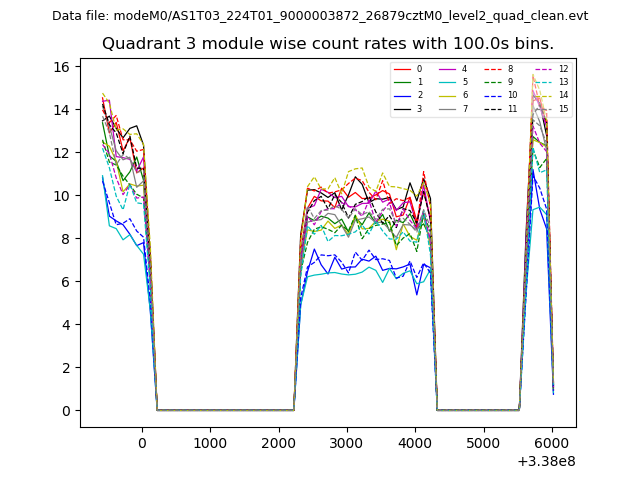
| Module-wise count rates for Quadrant A Data is divided into 100 sec bins |
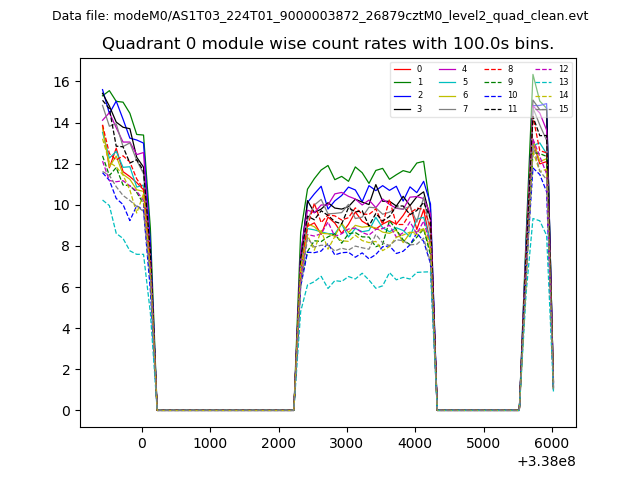 |
 |
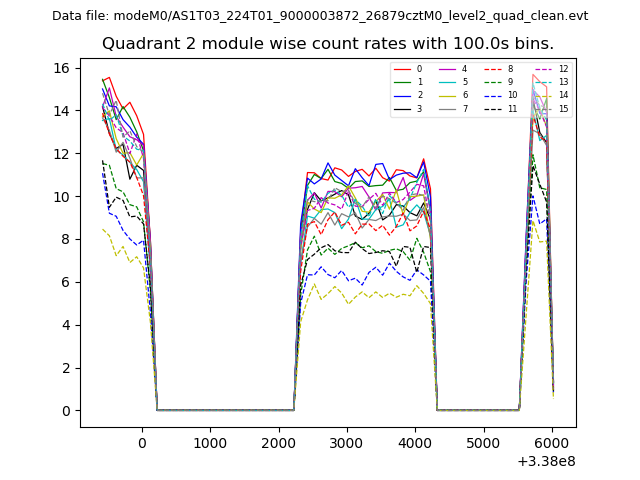
| Module-wise count rates for Quadrant B Data is divided into 100 sec bins |
 |
 |
| Module-wise count rates for Quadrant C Data is divided into 100 sec bins |
 |
 |
| Module-wise count rates for Quadrant D Data is divided into 100 sec bins |
 |
 |
| Parameter | Plot |
|---|---|
| CZT HV Monitor | 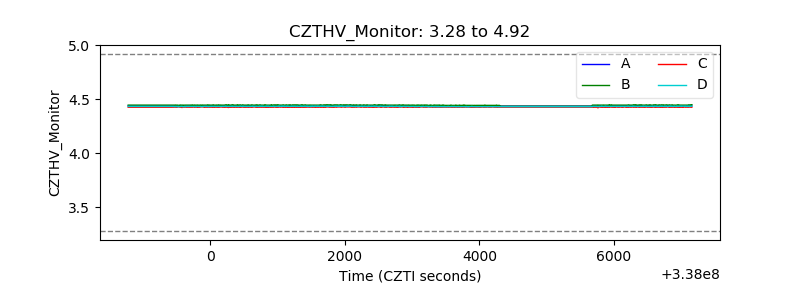 |
| D_VDD | 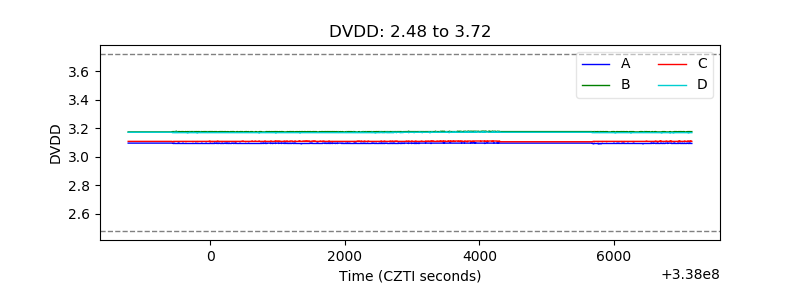 |
| Temperature 1 | 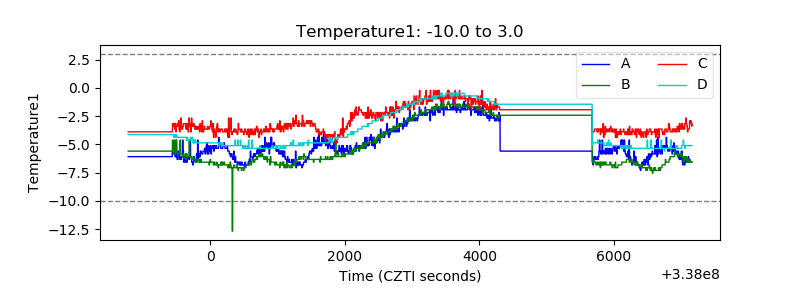 |
| Veto HV Monitor | 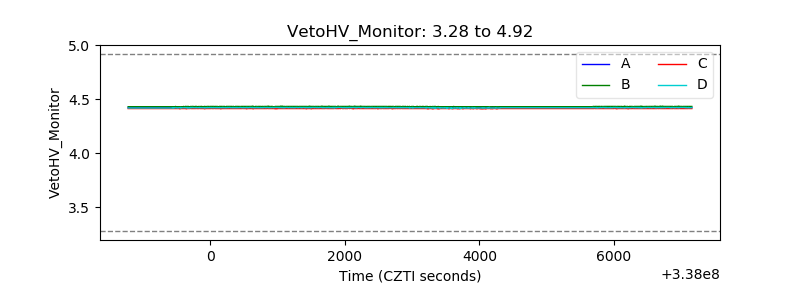 |
| Veto LLD | 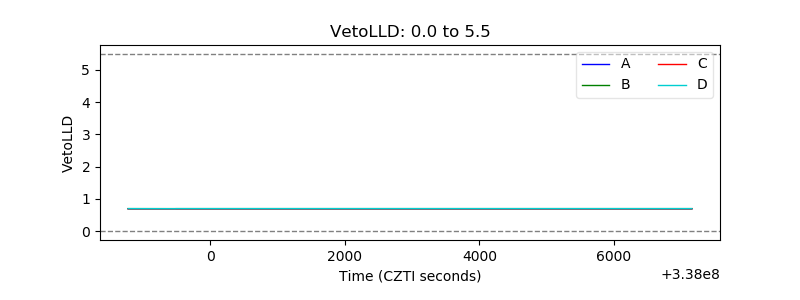 |
| Alpha Counter | 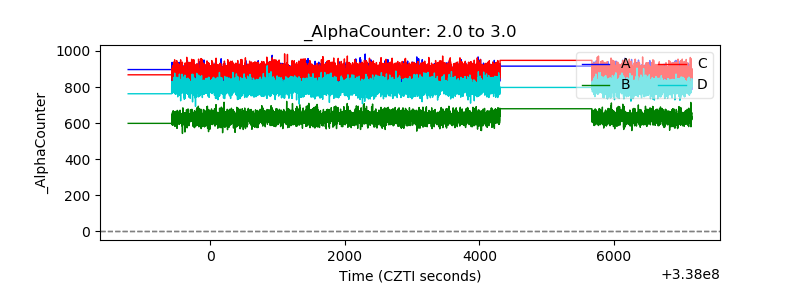 |
| _CPM_Rate | 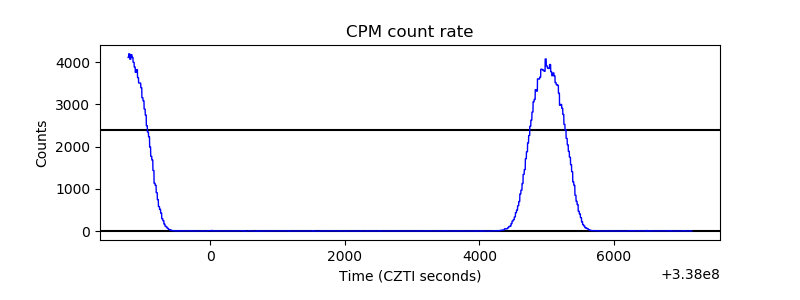 |
| CZT Counter | 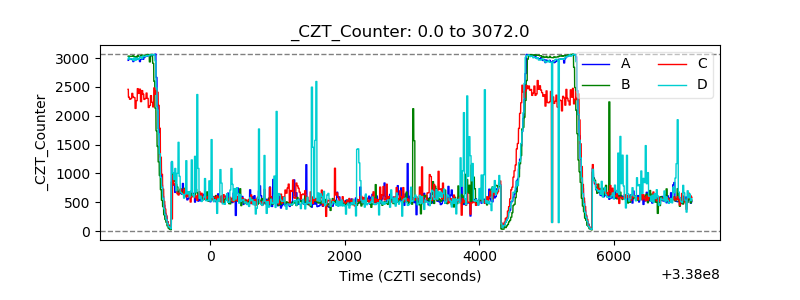 |
| +2.5 Volts monitor | 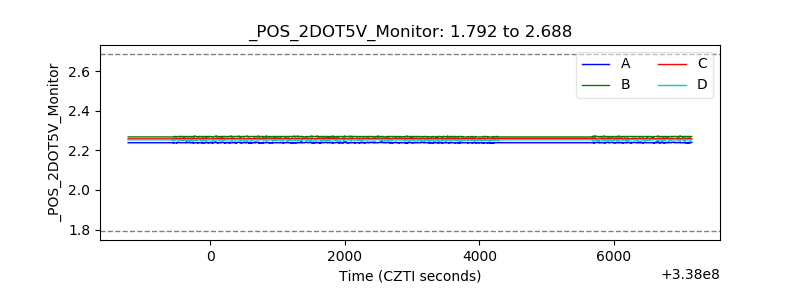 |
| +5 Volts monitor |  |
| _ROLL_ROT | 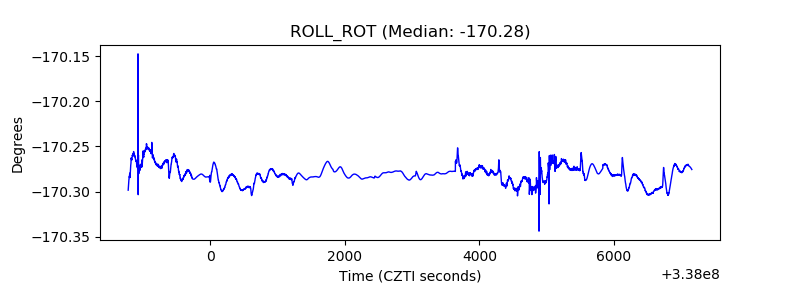 |
| _Roll_DEC | 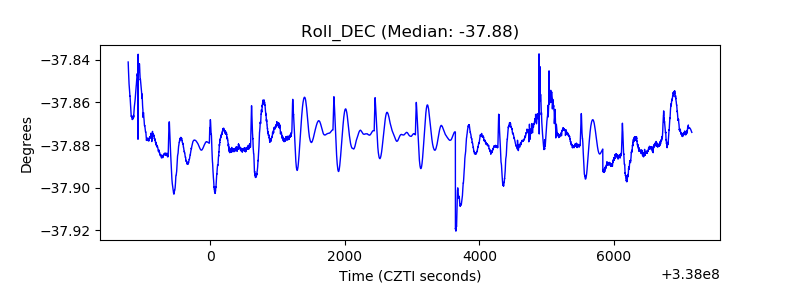 |
| _Roll_RA | 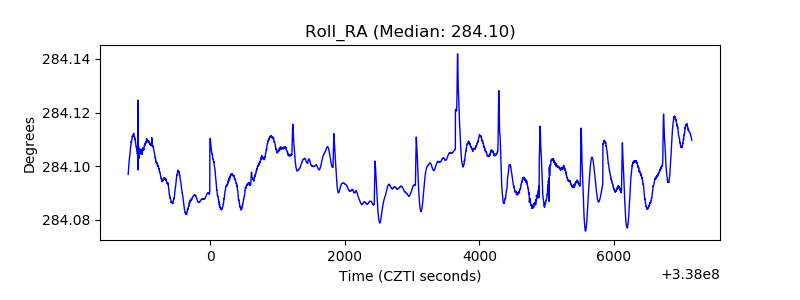 |
| Veto Counter | 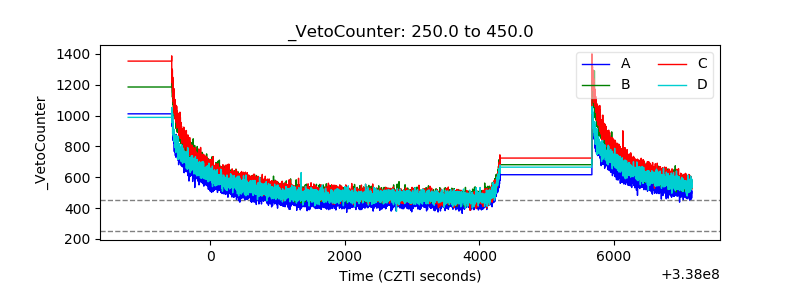 |