| Param | Original file | Final file |
|---|---|---|
| Filename | modeM0/AS1T03_224T01_9000003872_26880cztM0_level2.evt | modeM0/AS1T03_224T01_9000003872_26880cztM0_level2_quad_clean.evt |
| Size (bytes) | 555,963,840 | 69,877,440 |
| Size | 530.2 MB | 66.6 MB |
| Events in quadrant A | 3,991,172 | 420,110 |
| Events in quadrant B | 3,615,139 | 435,570 |
| Events in quadrant C | 3,543,184 | 420,910 |
| Events in quadrant D | 5,264,291 | 402,479 |
| Mode M0 | |||
|---|---|---|---|
| Quadrant | BADHDUFLAG | Total packets | Discarded packets |
| A | 0 | 15730 | 0 |
| B | 0 | 14376 | 0 |
| C | 0 | 14213 | 0 |
| D | 0 | 19822 | 0 |
| Mode M9 | |||
|---|---|---|---|
| Quadrant | BADHDUFLAG | Total packets | Discarded packets |
| A | 0 | 18 | 0 |
| B | 0 | 19 | 0 |
| C | 0 | 19 | 0 |
| D | 0 | 19 | 0 |
| Quadrant | Total seconds | Saturated seconds | Saturation percentage |
|---|---|---|---|
| A | 6255 | 70 | 1.119105% |
| B | 6255 | 93 | 1.486811% |
| C | 6255 | 97 | 1.550759% |
| D | 6255 | 409 | 6.538769% |
Noise dominated data is calculated using 1-second bins in cleaned event files. If a bin has >2000 counts, and if more than 50% of those come from <1% of pixels, then it is considered to be noise-dominated and hence unusable.
| Quadrant | # 1 sec bins | Bins with >0 counts | Bins with >2000 counts | High rate bins dominated by noise | Noise dominated (total time) | Noise dominated (detector-on time) | Marked lightcurve |
|---|---|---|---|---|---|---|---|
| A | 7690 | 6256 | 26 | 26 | 0.34% | 0.42% |  |
| B | 7690 | 6255 | 16 | 16 | 0.21% | 0.26% |  |
| C | 7690 | 6256 | 0 | 0 | 0.00% | 0.00% |  |
| D | 7690 | 6255 | 310 | 310 | 4.03% | 4.96% |  |
Top three noisy pixels from each quadrant. If the there are fewer than three noisy pixels in the level2.evt file, extra rows are filled as -1
| Pixel properties | Quadrant properties | ||||||
|---|---|---|---|---|---|---|---|
| Quadrant | DetID | PixID | Counts | Sigma | Mean | Median | Sigma |
| A | 0 | 13 | 610296 | 3564.28 | 877 | 865 | 171.0 |
| A | 13 | 254 | 10098 | 54.0 | 877 | 865 | 171.0 |
| A | 0 | 226 | 7739 | 40.2 | 877 | 865 | 171.0 |
| B | 0 | 190 | 74180 | 448.61 | 883 | 866 | 163.4 |
| B | 3 | 64 | 46755 | 280.79 | 883 | 866 | 163.4 |
| B | 10 | 246 | 38188 | 228.37 | 883 | 866 | 163.4 |
| C | 14 | 238 | 144182 | 719.39 | 866 | 873 | 199.2 |
| C | 0 | 79 | 17154 | 81.73 | 866 | 873 | 199.2 |
| C | 3 | 233 | 6192 | 26.7 | 866 | 873 | 199.2 |
| D | 7 | 80 | 1654533 | 8459.23 | 837 | 821 | 195.5 |
| D | 1 | 52 | 187374 | 954.27 | 837 | 821 | 195.5 |
| D | 2 | 250 | 173607 | 883.85 | 837 | 821 | 195.5 |
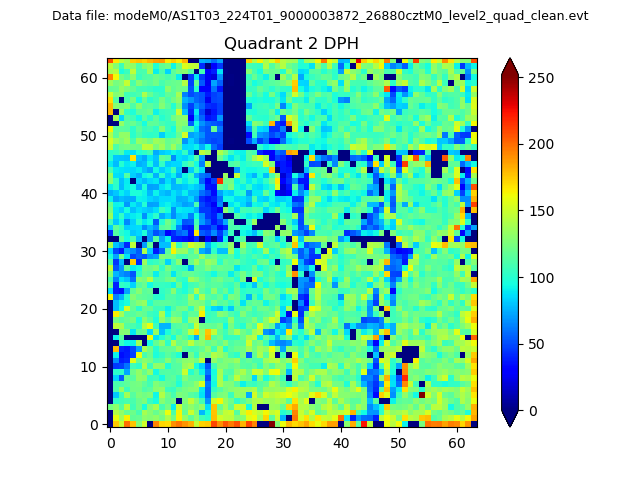
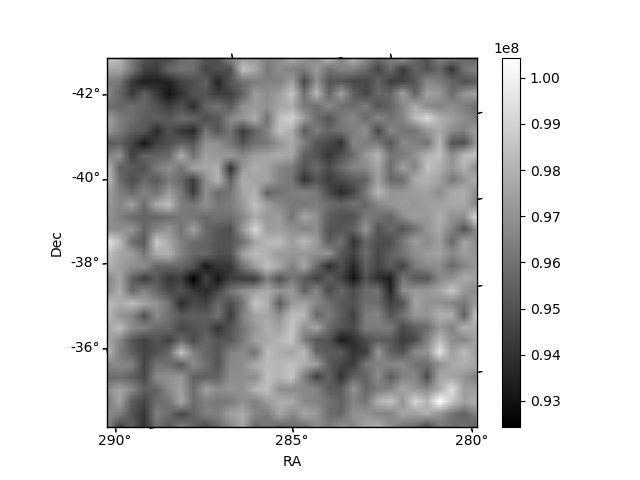
Histogram calculated using DETX and DETY for each event in the final _common_clean file
| Quadrant A | 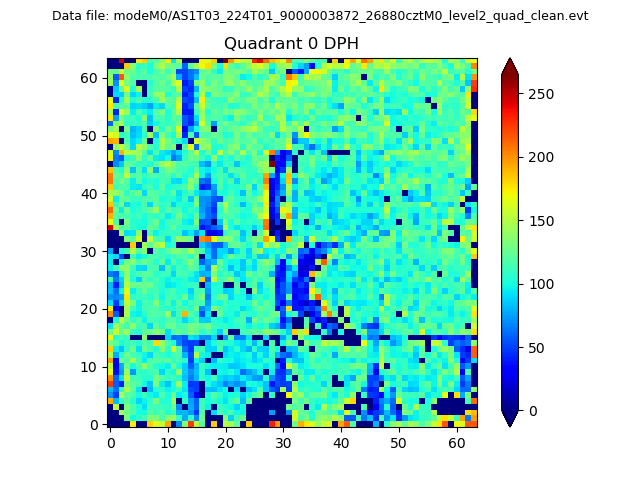 |
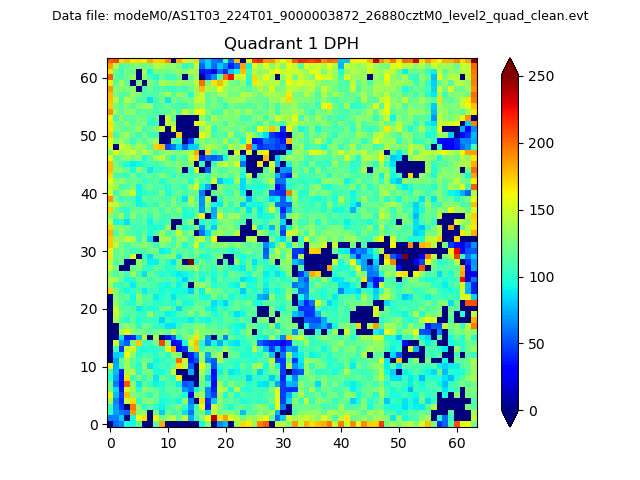 |
Quadrant B |
|---|---|---|---|
| Quadrant D | 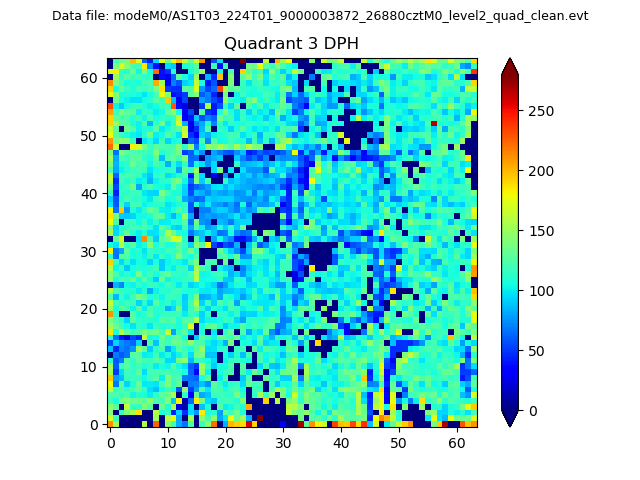 |
 |
Quadrant C |
| Plot type | Count rate plots | Images |
|---|---|---|
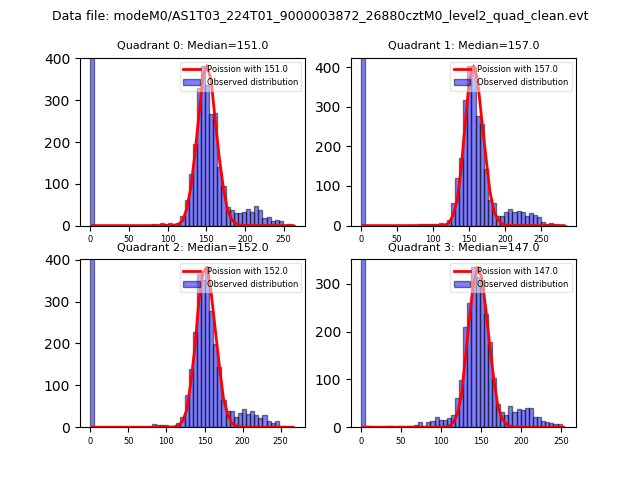
| Comparison with Poisson distribution Blue bars denote a histogram of data divided into 1 sec bins. Red curve is a Poisson curve with rate = median count rate of data. |
 |
 |
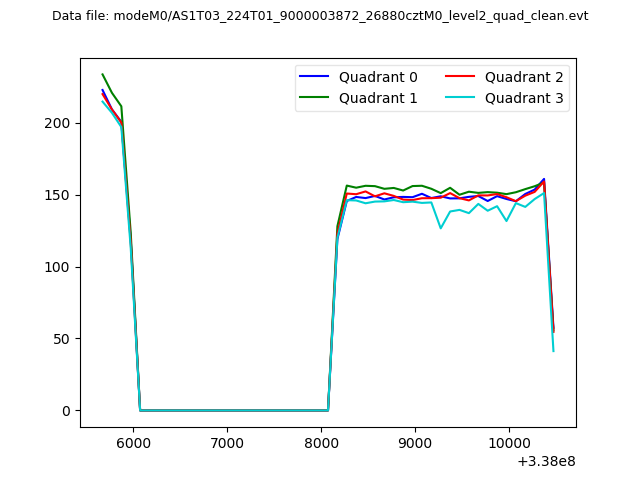
| Quadrant-wise count rates Data is divided into 100 sec bins |
 |
|
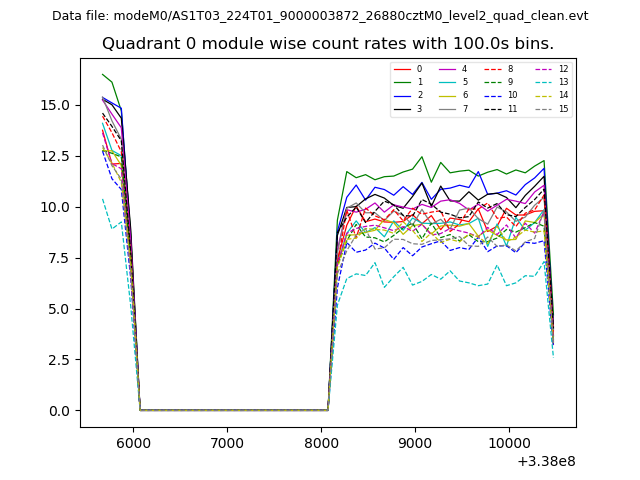
| Module-wise count rates for Quadrant A Data is divided into 100 sec bins |
 |
 |
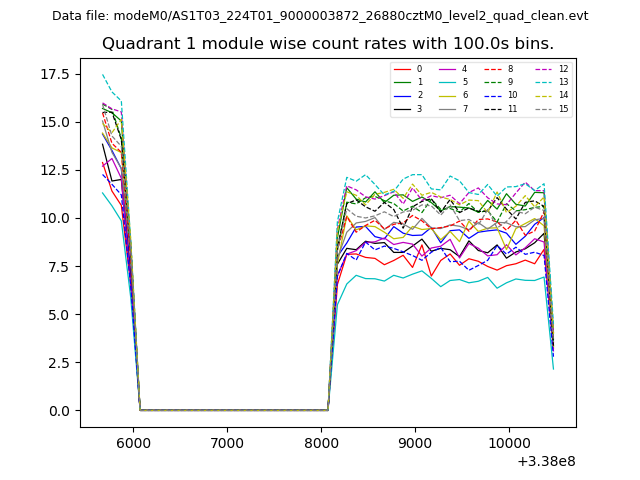
| Module-wise count rates for Quadrant B Data is divided into 100 sec bins |
 |
 |
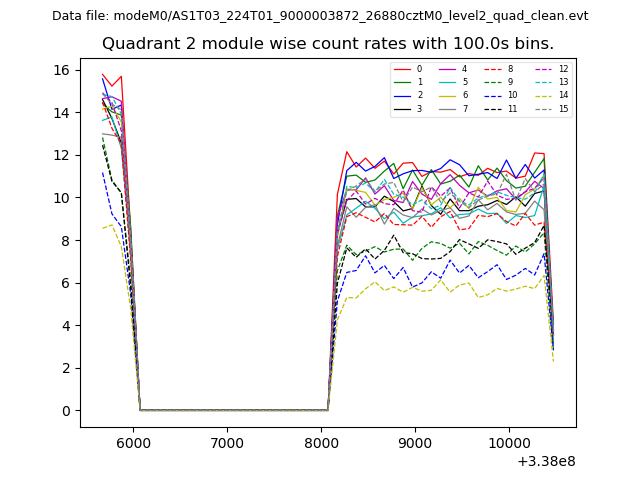
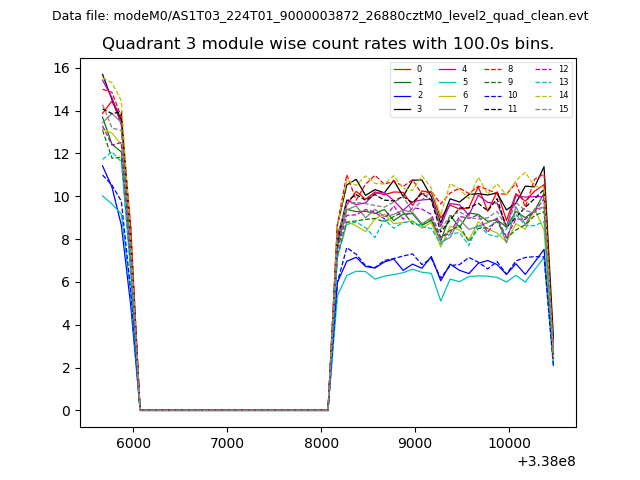
| Module-wise count rates for Quadrant C Data is divided into 100 sec bins |
 |
 |
| Module-wise count rates for Quadrant D Data is divided into 100 sec bins |
 |
 |
| Parameter | Plot |
|---|---|
| CZT HV Monitor | 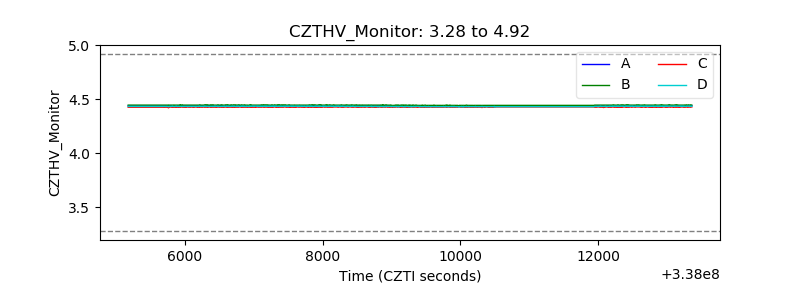 |
| D_VDD | 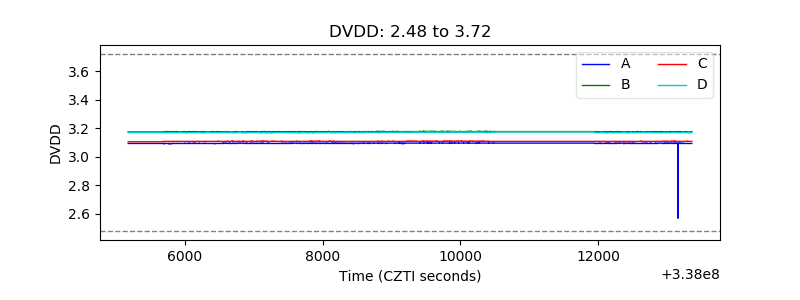 |
| Temperature 1 |  |
| Veto HV Monitor | 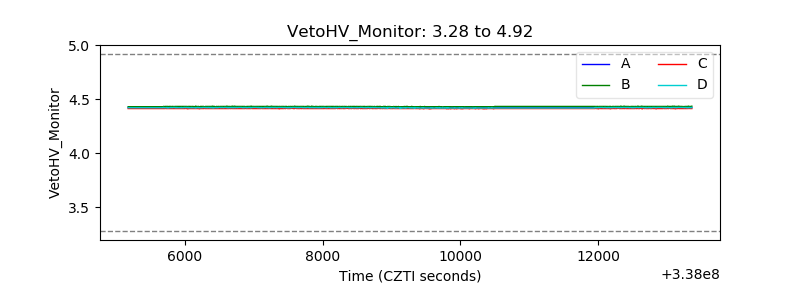 |
| Veto LLD | 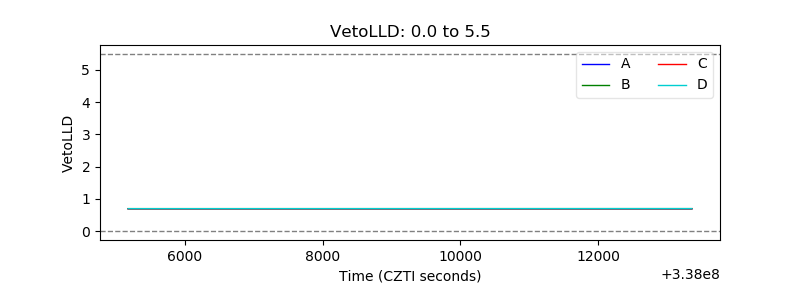 |
| Alpha Counter | 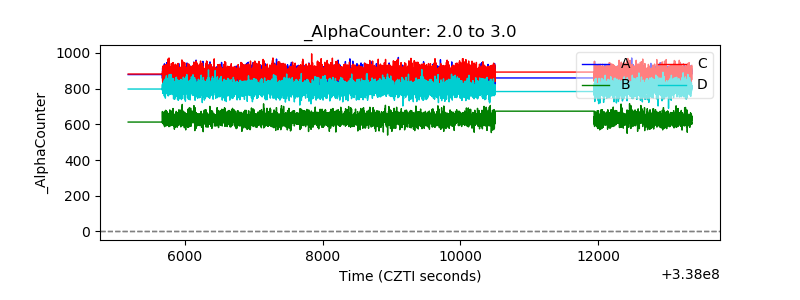 |
| _CPM_Rate | 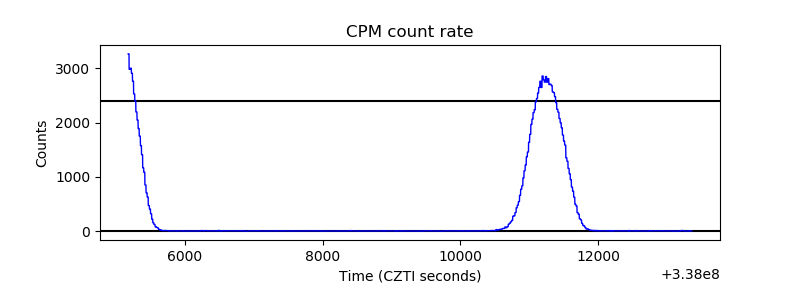 |
| CZT Counter | 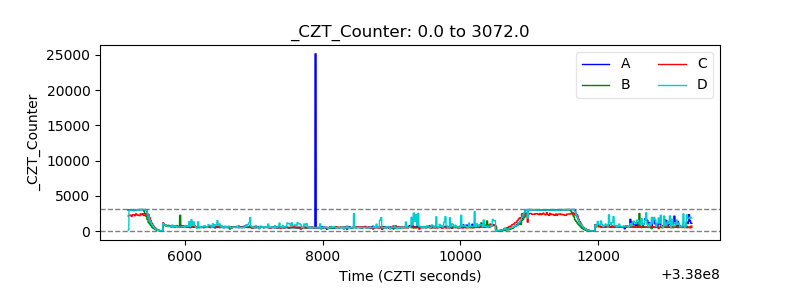 |
| +2.5 Volts monitor |  |
| +5 Volts monitor |  |
| _ROLL_ROT | 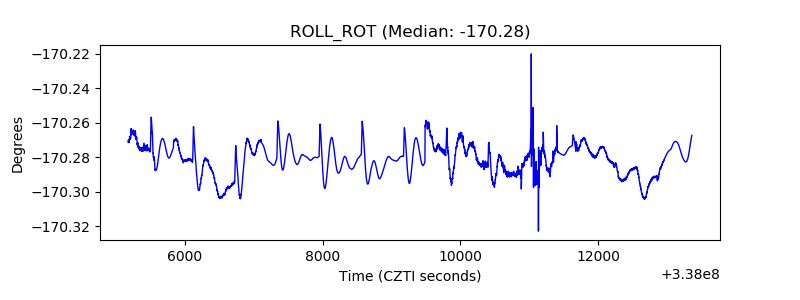 |
| _Roll_DEC | 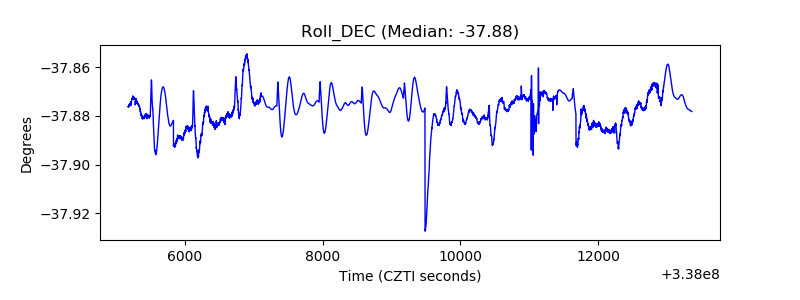 |
| _Roll_RA |  |
| Veto Counter | 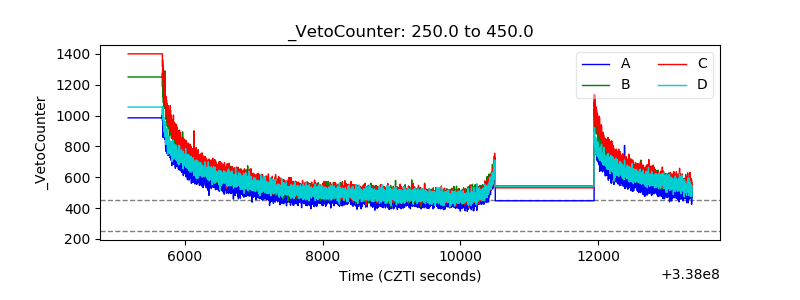 |