| Param | Original file | Final file |
|---|---|---|
| Filename | modeM0/AS1T03_224T01_9000003872_26881cztM0_level2.evt | modeM0/AS1T03_224T01_9000003872_26881cztM0_level2_quad_clean.evt |
| Size (bytes) | 601,139,520 | 67,317,120 |
| Size | 573.3 MB | 64.2 MB |
| Events in quadrant A | 4,653,393 | 401,841 |
| Events in quadrant B | 3,600,592 | 421,210 |
| Events in quadrant C | 3,404,109 | 408,461 |
| Events in quadrant D | 6,129,208 | 374,528 |
| Mode M0 | |||
|---|---|---|---|
| Quadrant | BADHDUFLAG | Total packets | Discarded packets |
| A | 0 | 17986 | 0 |
| B | 0 | 14488 | 0 |
| C | 0 | 13653 | 0 |
| D | 0 | 22268 | 0 |
| Mode M9 | |||
|---|---|---|---|
| Quadrant | BADHDUFLAG | Total packets | Discarded packets |
| A | 0 | 14 | 0 |
| B | 0 | 15 | 0 |
| C | 0 | 15 | 0 |
| D | 0 | 15 | 0 |
| Quadrant | Total seconds | Saturated seconds | Saturation percentage |
|---|---|---|---|
| A | 6179 | 116 | 1.877326% |
| B | 6179 | 78 | 1.262340% |
| C | 6178 | 83 | 1.343477% |
| D | 6178 | 700 | 11.330528% |
Noise dominated data is calculated using 1-second bins in cleaned event files. If a bin has >2000 counts, and if more than 50% of those come from <1% of pixels, then it is considered to be noise-dominated and hence unusable.
| Quadrant | # 1 sec bins | Bins with >0 counts | Bins with >2000 counts | High rate bins dominated by noise | Noise dominated (total time) | Noise dominated (detector-on time) | Marked lightcurve |
|---|---|---|---|---|---|---|---|
| A | 7539 | 6180 | 49 | 49 | 0.65% | 0.79% | 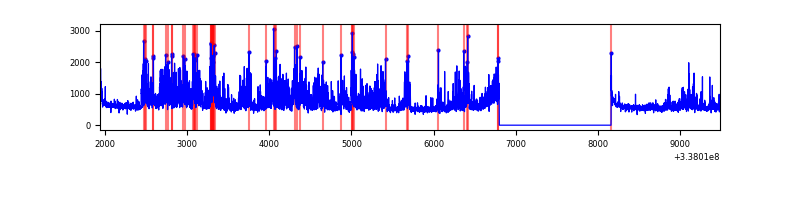 |
| B | 7539 | 6180 | 13 | 13 | 0.17% | 0.21% | 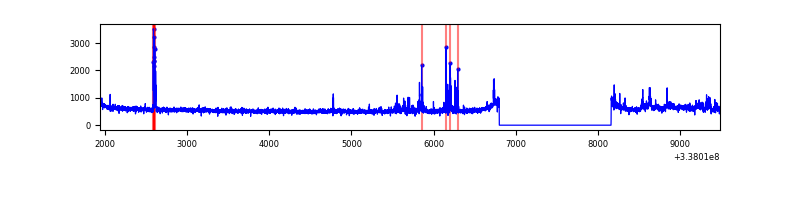 |
| C | 7538 | 6179 | 0 | 0 | 0.00% | 0.00% | 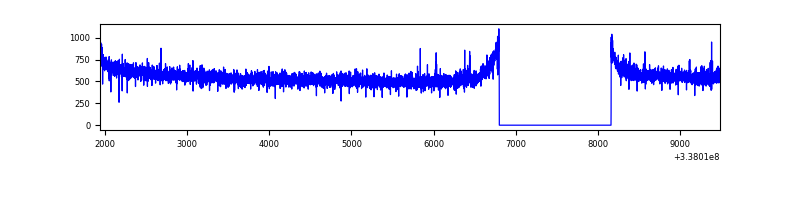 |
| D | 7538 | 6179 | 628 | 628 | 8.33% | 10.16% | 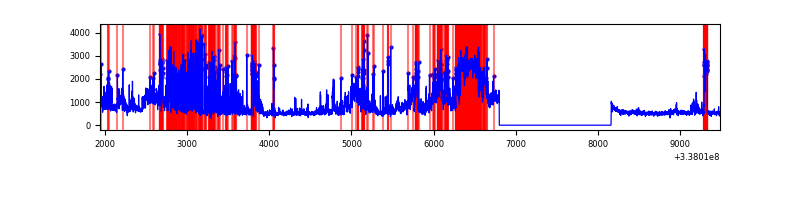 |
Top three noisy pixels from each quadrant. If the there are fewer than three noisy pixels in the level2.evt file, extra rows are filled as -1
| Pixel properties | Quadrant properties | ||||||
|---|---|---|---|---|---|---|---|
| Quadrant | DetID | PixID | Counts | Sigma | Mean | Median | Sigma |
| A | 0 | 13 | 1397850 | 8388.98 | 845 | 831 | 166.5 |
| A | 13 | 254 | 9749 | 53.55 | 845 | 831 | 166.5 |
| A | 3 | 137 | 7408 | 39.49 | 845 | 831 | 166.5 |
| B | 3 | 64 | 188795 | 1199.07 | 848 | 829 | 156.8 |
| B | 0 | 190 | 82405 | 520.39 | 848 | 829 | 156.8 |
| B | 12 | 111 | 18396 | 112.06 | 848 | 829 | 156.8 |
| C | 14 | 238 | 135896 | 708.51 | 831 | 842 | 190.6 |
| C | 3 | 233 | 16633 | 82.84 | 831 | 842 | 190.6 |
| C | 13 | 61 | 5906 | 26.57 | 831 | 842 | 190.6 |
| D | 7 | 80 | 2634480 | 14289.08 | 796 | 782 | 184.3 |
| D | 1 | 52 | 233218 | 1261.08 | 796 | 782 | 184.3 |
| D | 2 | 120 | 90462 | 486.56 | 796 | 782 | 184.3 |
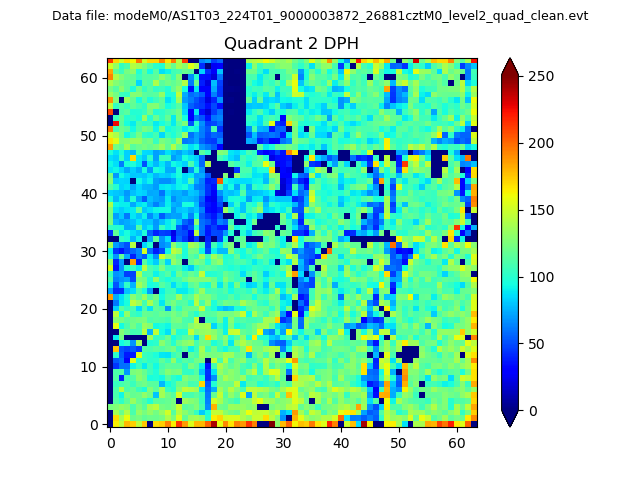
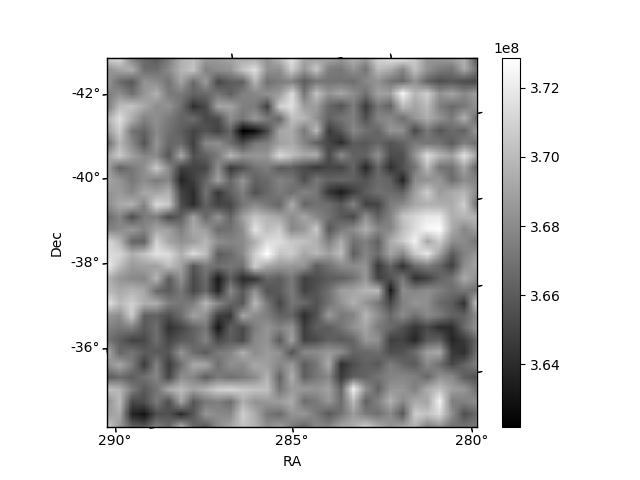
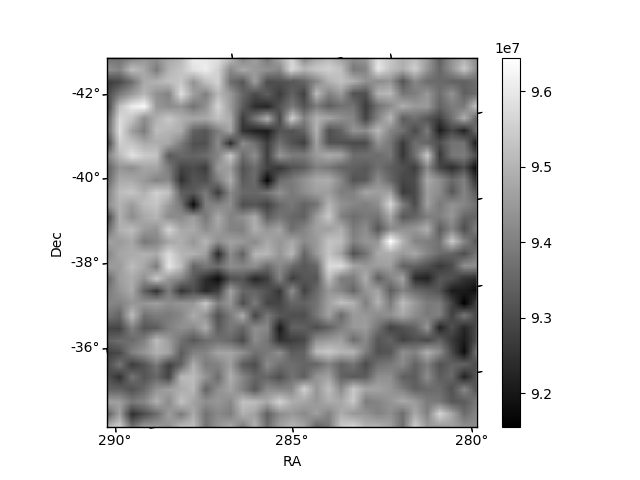
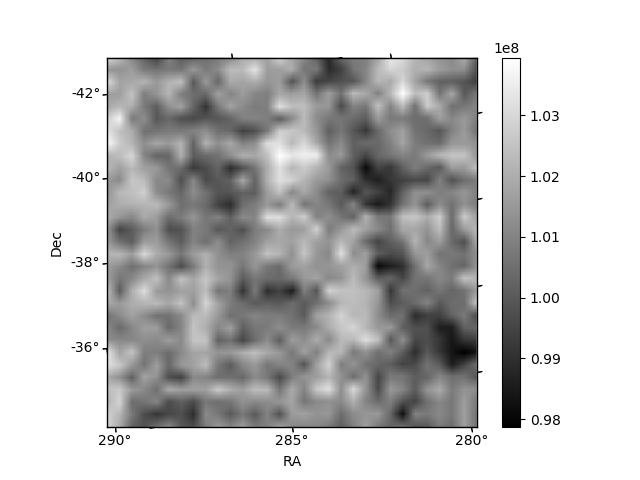
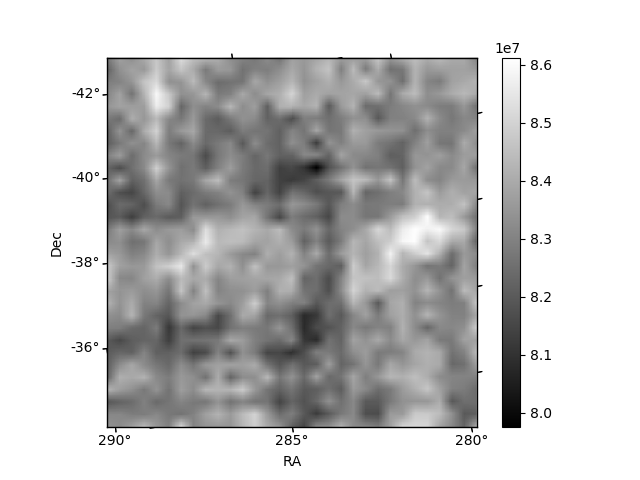
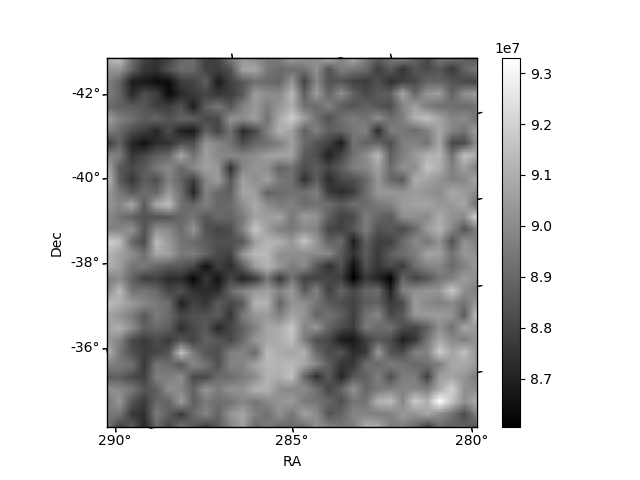
Histogram calculated using DETX and DETY for each event in the final _common_clean file
| Quadrant A | 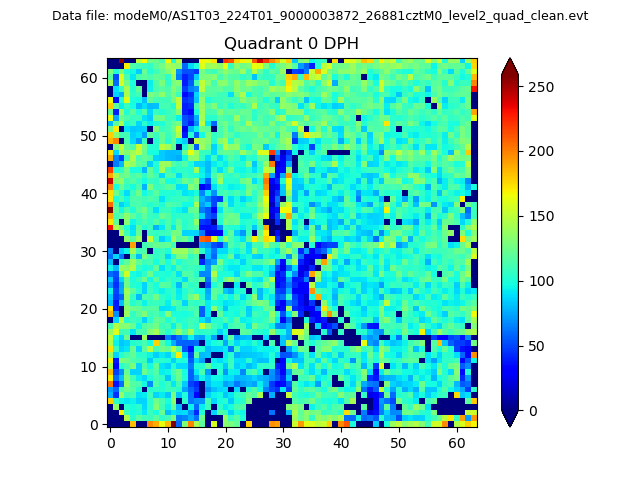 |
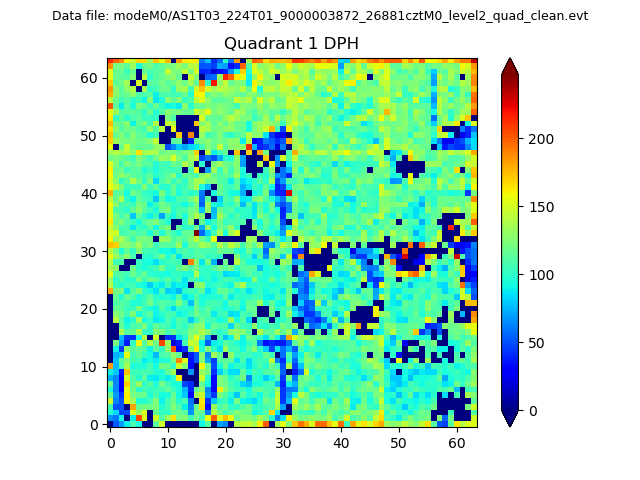 |
Quadrant B |
|---|---|---|---|
| Quadrant D | 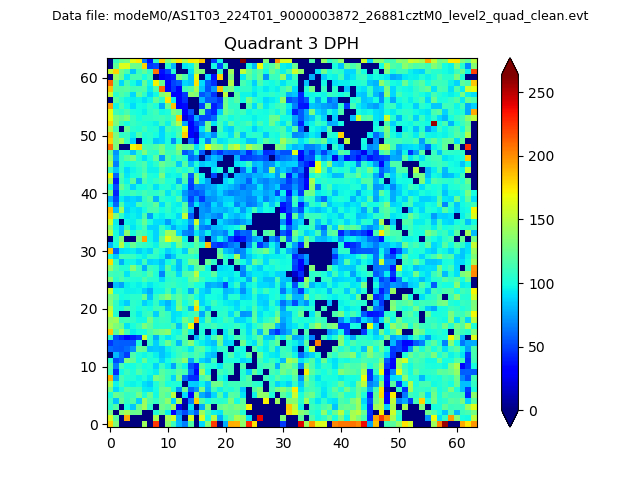 |
 |
Quadrant C |
| Plot type | Count rate plots | Images |
|---|---|---|
| Comparison with Poisson distribution Blue bars denote a histogram of data divided into 1 sec bins. Red curve is a Poisson curve with rate = median count rate of data. |
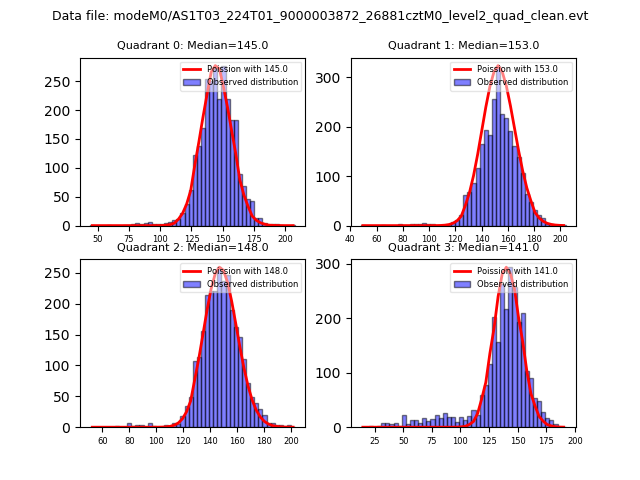 |
 |
| Quadrant-wise count rates Data is divided into 100 sec bins |
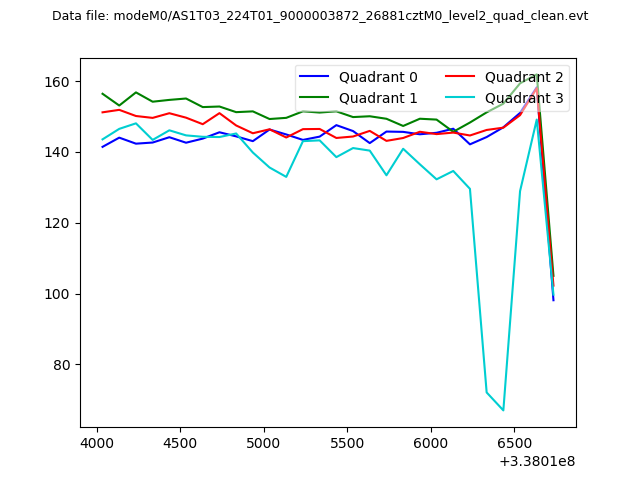 |
|
| Module-wise count rates for Quadrant A Data is divided into 100 sec bins |
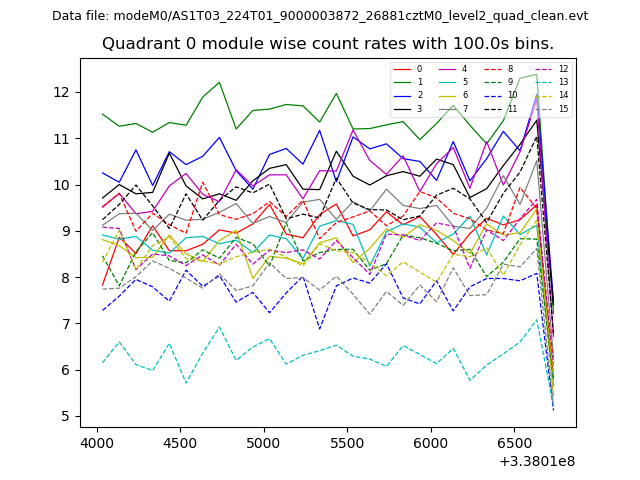 |
 |
| Module-wise count rates for Quadrant B Data is divided into 100 sec bins |
 |
 |
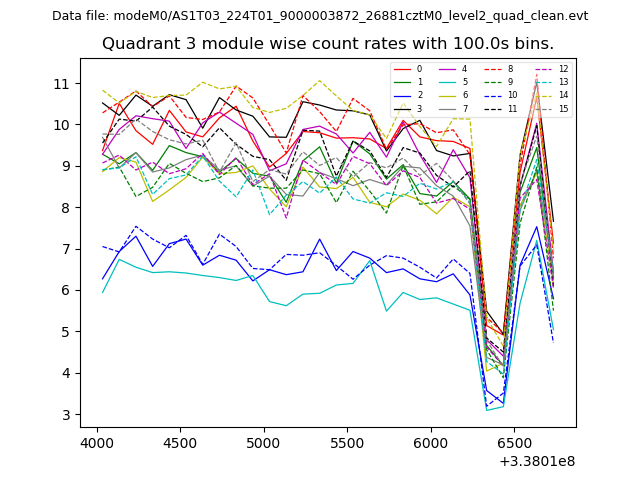
| Module-wise count rates for Quadrant C Data is divided into 100 sec bins |
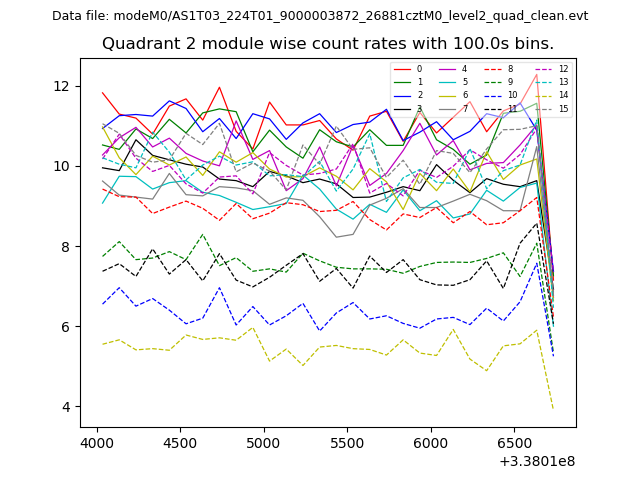 |
 |
| Module-wise count rates for Quadrant D Data is divided into 100 sec bins |
 |
 |
| Parameter | Plot |
|---|---|
| CZT HV Monitor | 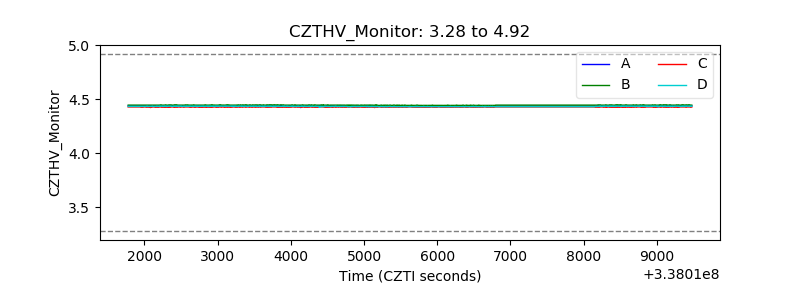 |
| D_VDD | 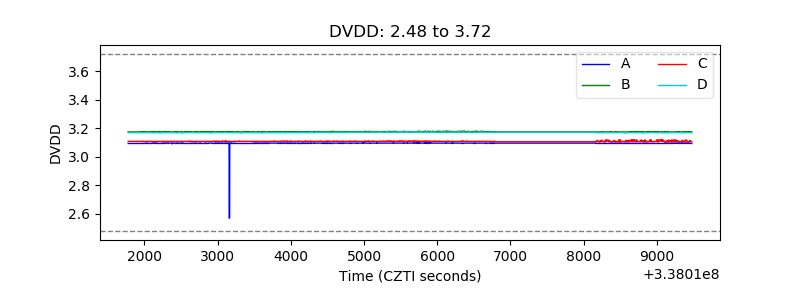 |
| Temperature 1 | 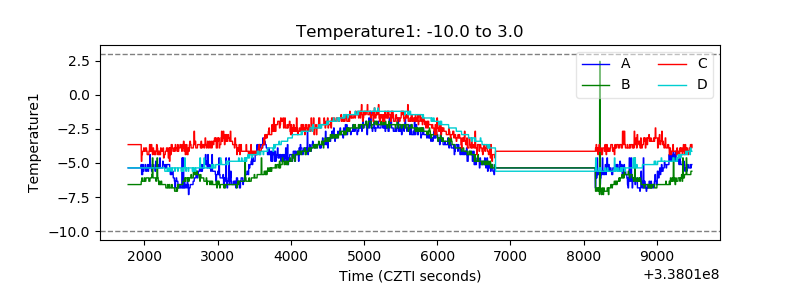 |
| Veto HV Monitor | 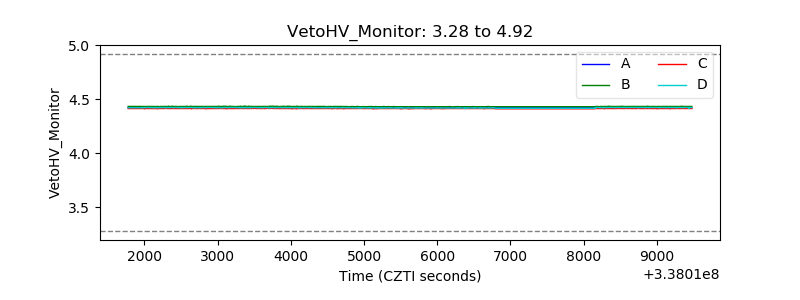 |
| Veto LLD | 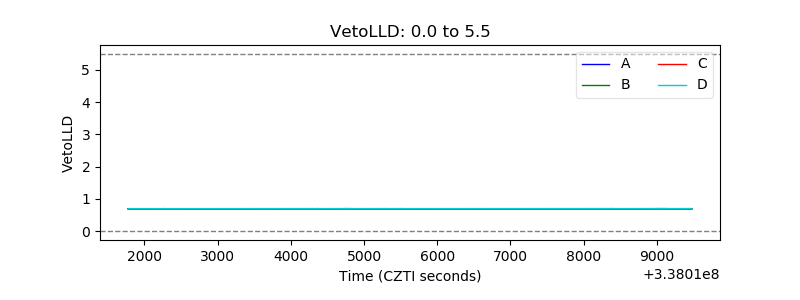 |
| Alpha Counter | 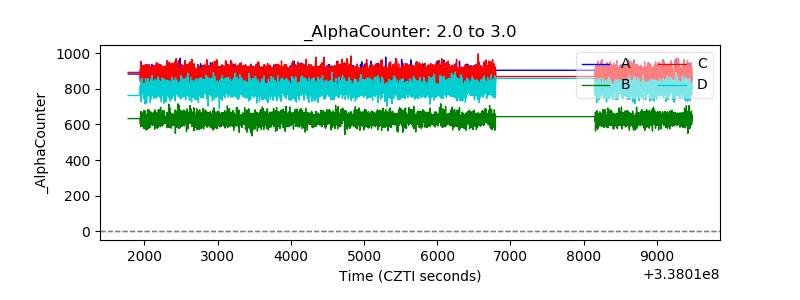 |
| _CPM_Rate | 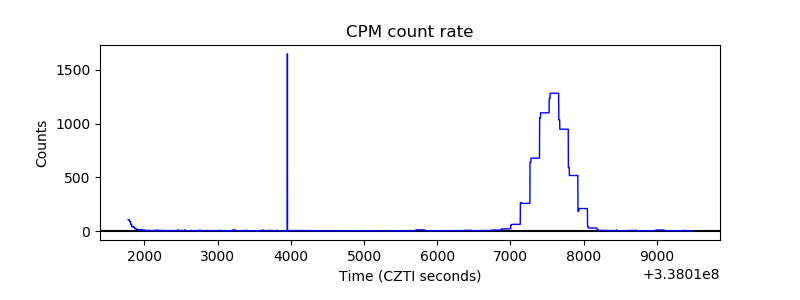 |
| CZT Counter | 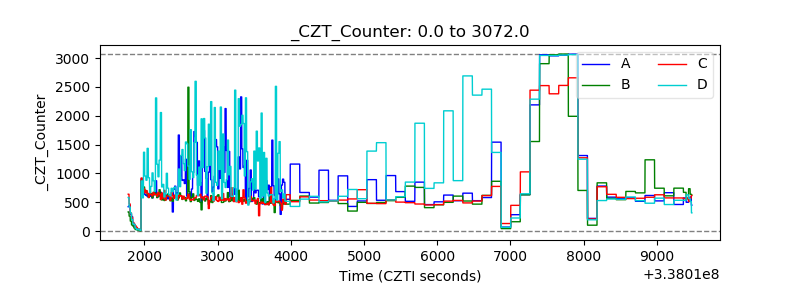 |
| +2.5 Volts monitor |  |
| +5 Volts monitor | 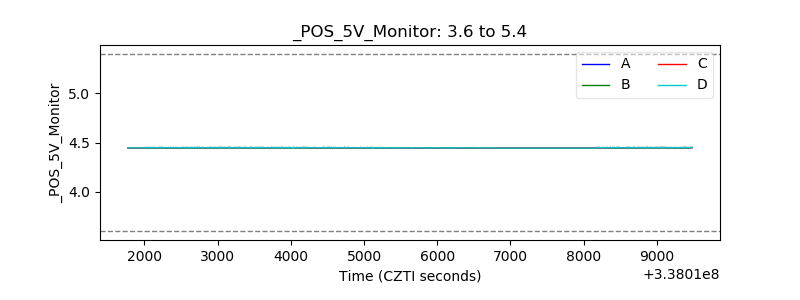 |
| _ROLL_ROT | 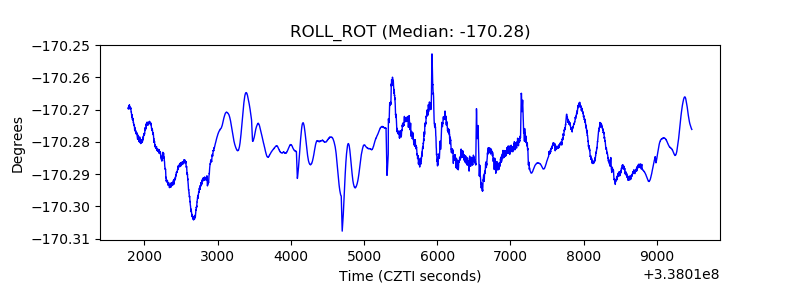 |
| _Roll_DEC | 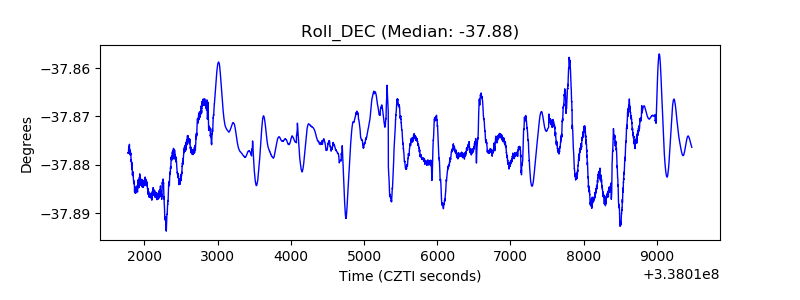 |
| _Roll_RA | 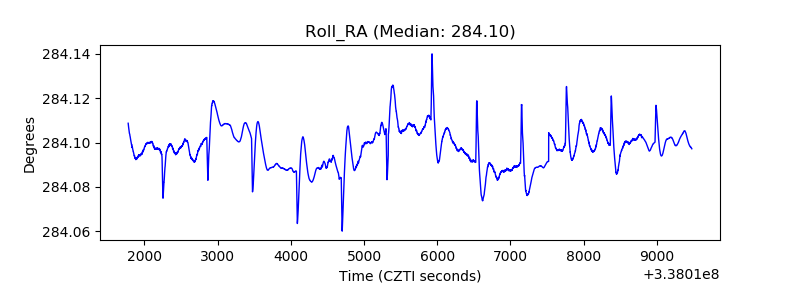 |
| Veto Counter |  |