| Param | Original file | Final file |
|---|---|---|
| Filename | modeM0/AS1T03_224T01_9000003872_26882cztM0_level2.evt | modeM0/AS1T03_224T01_9000003872_26882cztM0_level2_quad_clean.evt |
| Size (bytes) | 603,492,480 | 79,531,200 |
| Size | 575.5 MB | 75.8 MB |
| Events in quadrant A | 5,478,523 | 481,399 |
| Events in quadrant B | 4,104,083 | 506,714 |
| Events in quadrant C | 3,479,774 | 492,886 |
| Events in quadrant D | 4,772,171 | 471,106 |
| Mode M0 | |||
|---|---|---|---|
| Quadrant | BADHDUFLAG | Total packets | Discarded packets |
| A | 0 | 20631 | 0 |
| B | 0 | 16326 | 0 |
| C | 0 | 14020 | 0 |
| D | 0 | 18242 | 0 |
| Mode M9 | |||
|---|---|---|---|
| Quadrant | BADHDUFLAG | Total packets | Discarded packets |
| A | 0 | 9 | 0 |
| B | 0 | 9 | 0 |
| C | 0 | 9 | 0 |
| D | 0 | 9 | 0 |
| Quadrant | Total seconds | Saturated seconds | Saturation percentage |
|---|---|---|---|
| A | 6531 | 318 | 4.869086% |
| B | 6532 | 266 | 4.072260% |
| C | 6532 | 185 | 2.832211% |
| D | 6532 | 328 | 5.021433% |
Noise dominated data is calculated using 1-second bins in cleaned event files. If a bin has >2000 counts, and if more than 50% of those come from <1% of pixels, then it is considered to be noise-dominated and hence unusable.
| Quadrant | # 1 sec bins | Bins with >0 counts | Bins with >2000 counts | High rate bins dominated by noise | Noise dominated (total time) | Noise dominated (detector-on time) | Marked lightcurve |
|---|---|---|---|---|---|---|---|
| A | 7506 | 6531 | 168 | 168 | 2.24% | 2.57% | 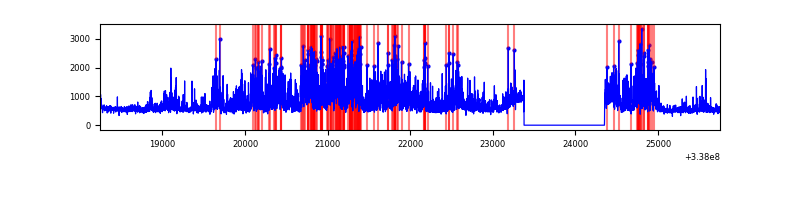 |
| B | 7507 | 6532 | 35 | 35 | 0.47% | 0.54% | 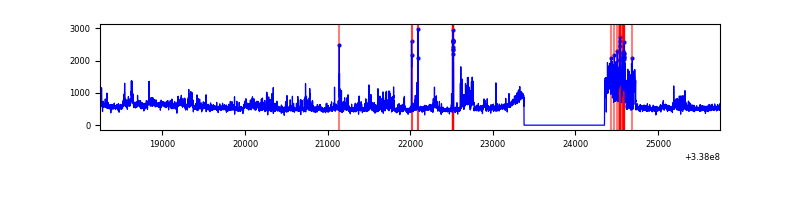 |
| C | 7507 | 6532 | 4 | 4 | 0.05% | 0.06% | 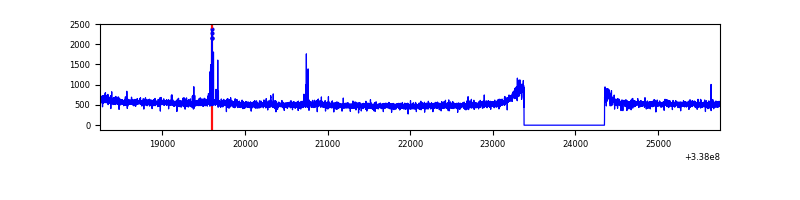 |
| D | 7507 | 6532 | 228 | 228 | 3.04% | 3.49% | 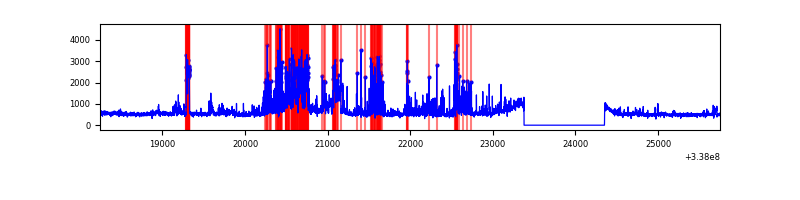 |
Top three noisy pixels from each quadrant. If the there are fewer than three noisy pixels in the level2.evt file, extra rows are filled as -1
| Pixel properties | Quadrant properties | ||||||
|---|---|---|---|---|---|---|---|
| Quadrant | DetID | PixID | Counts | Sigma | Mean | Median | Sigma |
| A | 0 | 13 | 2188491 | 12851.14 | 854 | 839 | 170.2 |
| A | 13 | 254 | 9889 | 53.16 | 854 | 839 | 170.2 |
| A | 3 | 137 | 7768 | 40.7 | 854 | 839 | 170.2 |
| B | 3 | 64 | 658058 | 4078.77 | 851 | 831 | 161.1 |
| B | 0 | 190 | 91678 | 563.8 | 851 | 831 | 161.1 |
| B | 12 | 111 | 19300 | 114.62 | 851 | 831 | 161.1 |
| C | 14 | 238 | 134549 | 689.64 | 836 | 844 | 193.9 |
| C | 15 | 208 | 32882 | 165.25 | 836 | 844 | 193.9 |
| C | 3 | 233 | 26981 | 134.81 | 836 | 844 | 193.9 |
| D | 7 | 80 | 698943 | 3607.23 | 830 | 811 | 193.5 |
| D | 13 | 168 | 358626 | 1848.82 | 830 | 811 | 193.5 |
| D | 2 | 250 | 222057 | 1143.17 | 830 | 811 | 193.5 |
Histogram calculated using DETX and DETY for each event in the final _common_clean file
| Quadrant A |  |
 |
Quadrant B |
|---|---|---|---|
| Quadrant D |  |
 |
Quadrant C |
| Plot type | Count rate plots | Images |
|---|---|---|
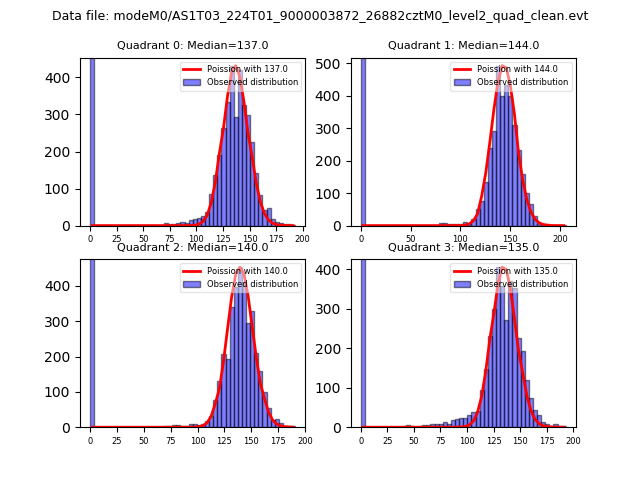
| Comparison with Poisson distribution Blue bars denote a histogram of data divided into 1 sec bins. Red curve is a Poisson curve with rate = median count rate of data. |
 |
 |
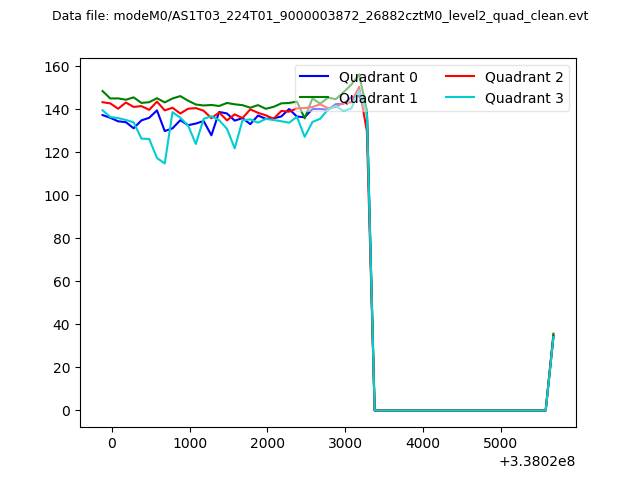
| Quadrant-wise count rates Data is divided into 100 sec bins |
 |
|
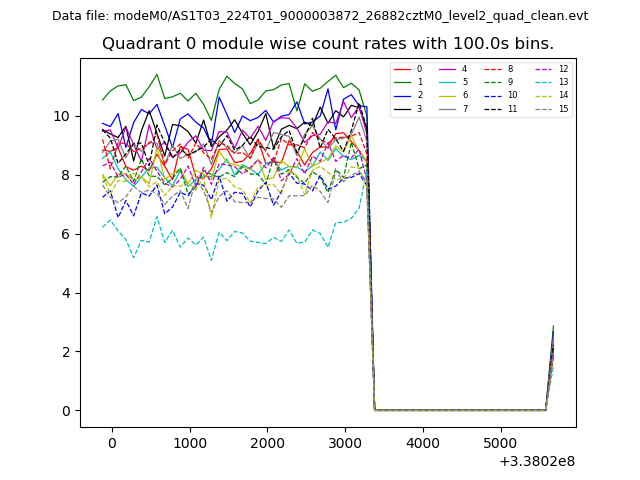
| Module-wise count rates for Quadrant A Data is divided into 100 sec bins |
 |
 |
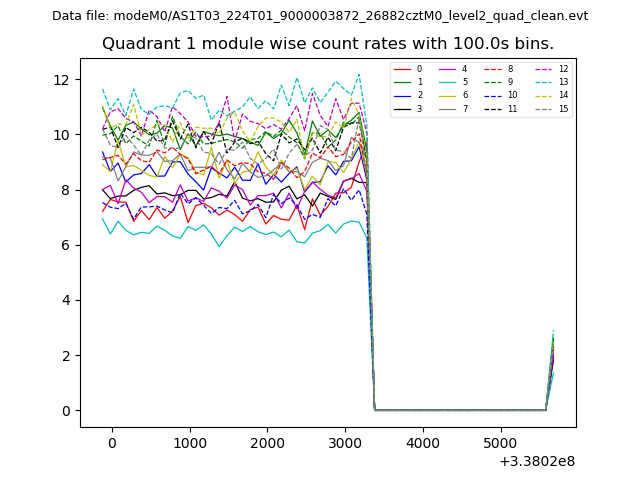
| Module-wise count rates for Quadrant B Data is divided into 100 sec bins |
 |
 |
| Module-wise count rates for Quadrant C Data is divided into 100 sec bins |
 |
 |
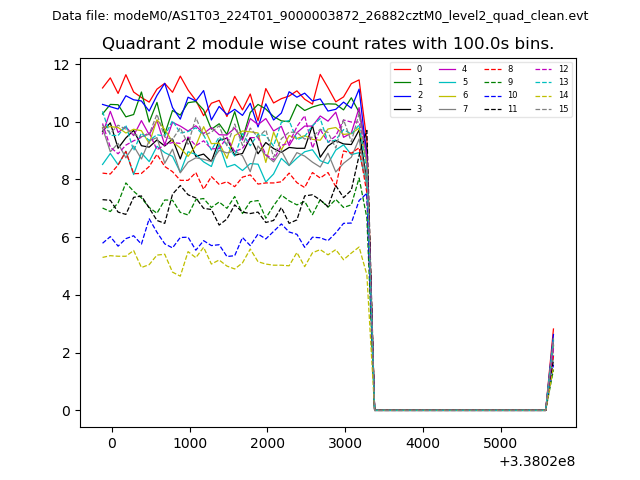
| Module-wise count rates for Quadrant D Data is divided into 100 sec bins |
 |
 |
| Parameter | Plot |
|---|---|
| CZT HV Monitor | 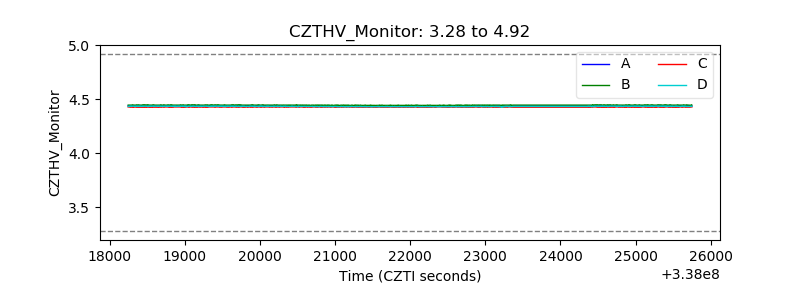 |
| D_VDD |  |
| Temperature 1 |  |
| Veto HV Monitor |  |
| Veto LLD |  |
| Alpha Counter | 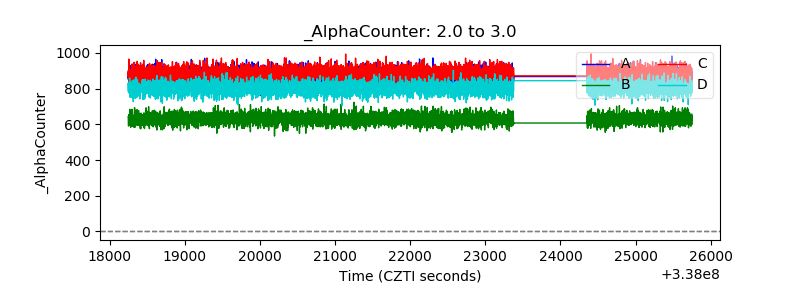 |
| _CPM_Rate | 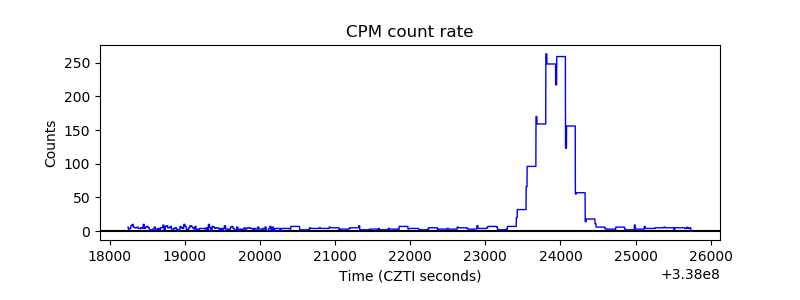 |
| CZT Counter |  |
| +2.5 Volts monitor |  |
| +5 Volts monitor |  |
| _ROLL_ROT |  |
| _Roll_DEC |  |
| _Roll_RA |  |
| Veto Counter | 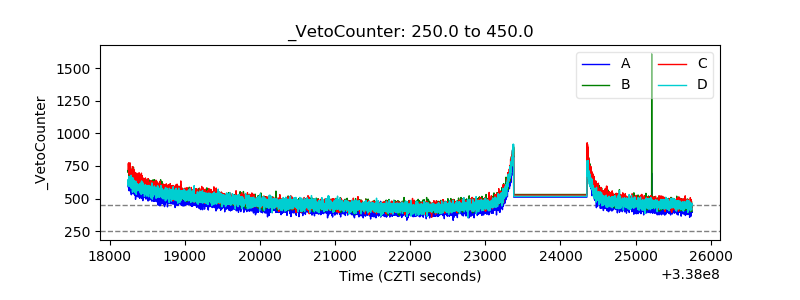 |