| Param | Original file | Final file |
|---|---|---|
| Filename | modeM0/AS1T03_224T01_9000003872_26883cztM0_level2.evt | modeM0/AS1T03_224T01_9000003872_26883cztM0_level2_quad_clean.evt |
| Size (bytes) | 646,706,880 | 92,321,280 |
| Size | 616.7 MB | 88.0 MB |
| Events in quadrant A | 5,973,336 | 556,110 |
| Events in quadrant B | 4,547,807 | 594,109 |
| Events in quadrant C | 3,860,258 | 574,328 |
| Events in quadrant D | 4,705,591 | 558,689 |
| Mode M0 | |||
|---|---|---|---|
| Quadrant | BADHDUFLAG | Total packets | Discarded packets |
| A | 0 | 22465 | 0 |
| B | 0 | 18035 | 0 |
| C | 0 | 15744 | 0 |
| D | 0 | 18635 | 0 |
| Mode M9 | |||
|---|---|---|---|
| Quadrant | BADHDUFLAG | Total packets | Discarded packets |
| A | 0 | 14 | 0 |
| B | 0 | 14 | 0 |
| C | 0 | 14 | 0 |
| D | 0 | 14 | 0 |
| Quadrant | Total seconds | Saturated seconds | Saturation percentage |
|---|---|---|---|
| A | 7349 | 709 | 9.647571% |
| B | 7350 | 461 | 6.272109% |
| C | 7350 | 325 | 4.421769% |
| D | 7350 | 317 | 4.312925% |
Noise dominated data is calculated using 1-second bins in cleaned event files. If a bin has >2000 counts, and if more than 50% of those come from <1% of pixels, then it is considered to be noise-dominated and hence unusable.
| Quadrant | # 1 sec bins | Bins with >0 counts | Bins with >2000 counts | High rate bins dominated by noise | Noise dominated (total time) | Noise dominated (detector-on time) | Marked lightcurve |
|---|---|---|---|---|---|---|---|
| A | 8864 | 7349 | 375 | 375 | 4.23% | 5.10% | 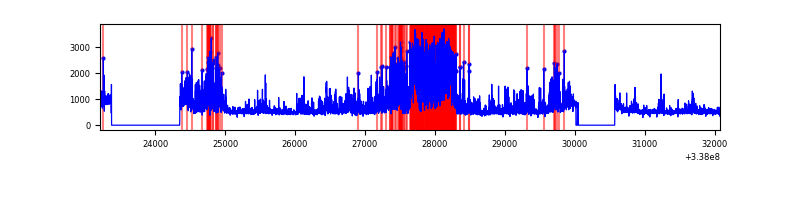 |
| B | 8865 | 7350 | 70 | 70 | 0.79% | 0.95% | 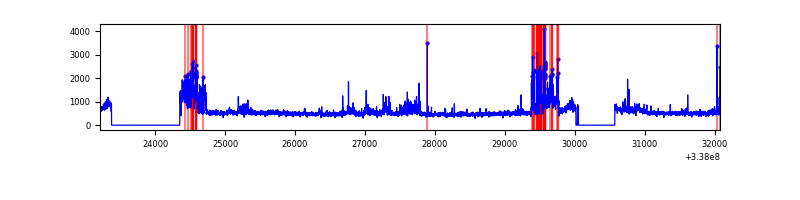 |
| C | 8865 | 7350 | 0 | 0 | 0.00% | 0.00% | 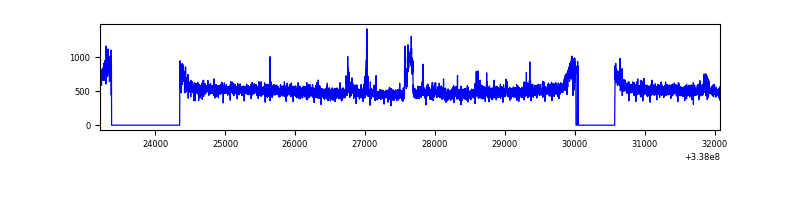 |
| D | 8865 | 7350 | 111 | 111 | 1.25% | 1.51% | 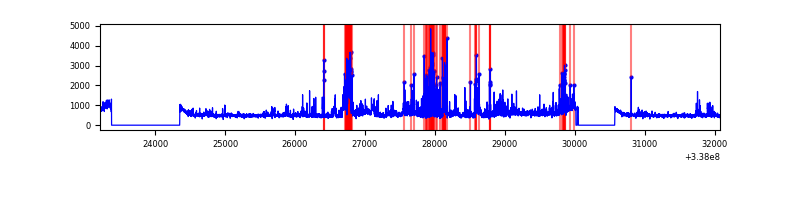 |
Top three noisy pixels from each quadrant. If the there are fewer than three noisy pixels in the level2.evt file, extra rows are filled as -1
| Pixel properties | Quadrant properties | ||||||
|---|---|---|---|---|---|---|---|
| Quadrant | DetID | PixID | Counts | Sigma | Mean | Median | Sigma |
| A | 0 | 13 | 2373118 | 12748.08 | 934 | 914 | 186.1 |
| A | 13 | 254 | 10313 | 50.51 | 934 | 914 | 186.1 |
| A | 3 | 137 | 8993 | 43.41 | 934 | 914 | 186.1 |
| B | 3 | 64 | 590163 | 3296.82 | 935 | 911 | 178.7 |
| B | 10 | 246 | 175402 | 976.26 | 935 | 911 | 178.7 |
| B | 0 | 190 | 98036 | 543.4 | 935 | 911 | 178.7 |
| C | 14 | 238 | 145795 | 675.5 | 919 | 924 | 214.5 |
| C | 0 | 79 | 95093 | 439.09 | 919 | 924 | 214.5 |
| C | 3 | 233 | 24179 | 108.43 | 919 | 924 | 214.5 |
| D | 7 | 80 | 785367 | 3624.92 | 921 | 898 | 216.4 |
| D | 2 | 250 | 141301 | 648.78 | 921 | 898 | 216.4 |
| D | 1 | 52 | 107812 | 494.03 | 921 | 898 | 216.4 |
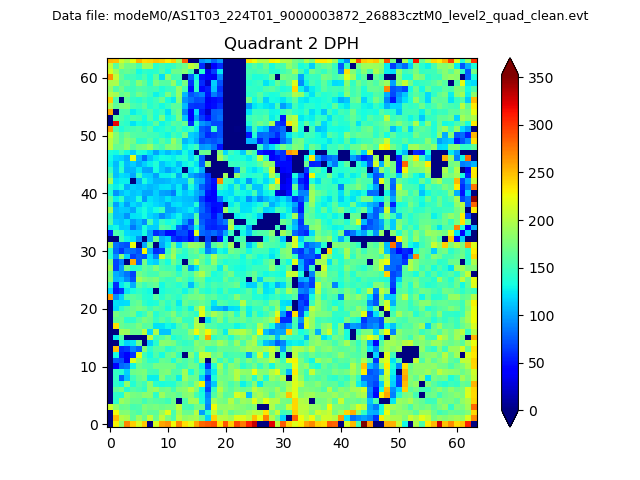
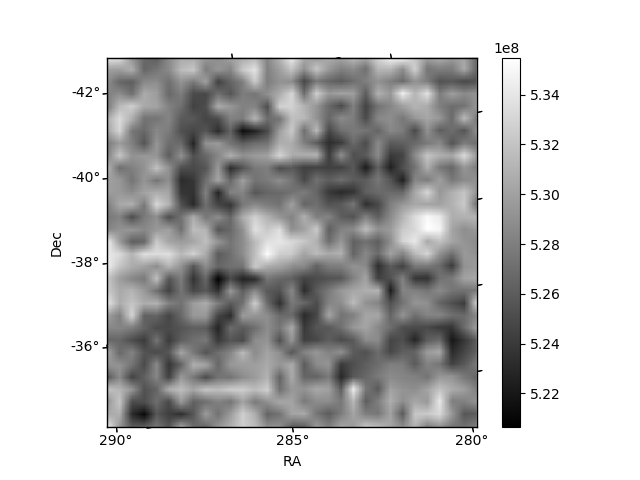
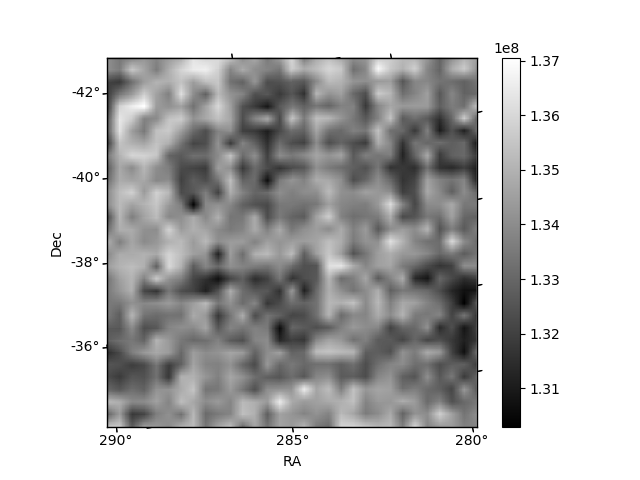
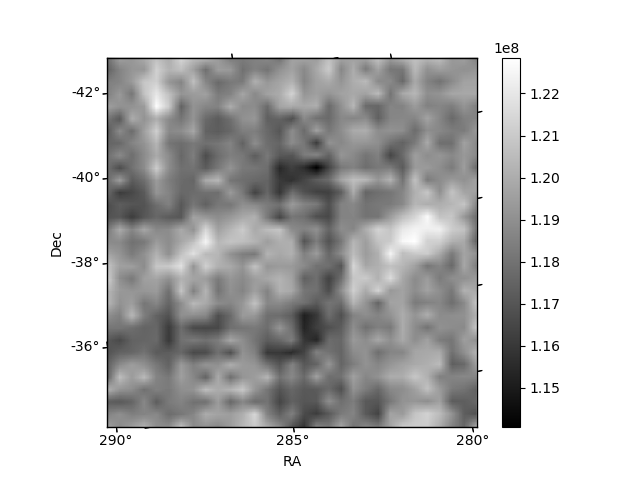
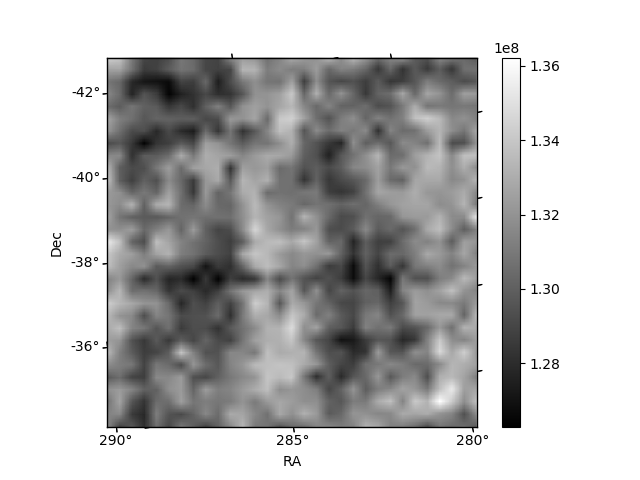
Histogram calculated using DETX and DETY for each event in the final _common_clean file
| Quadrant A | 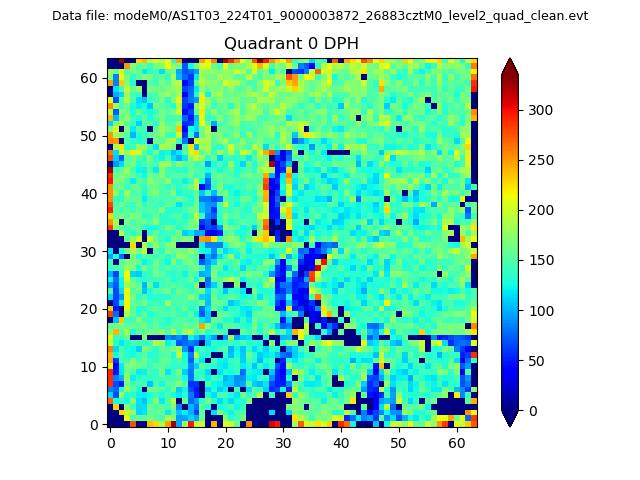 |
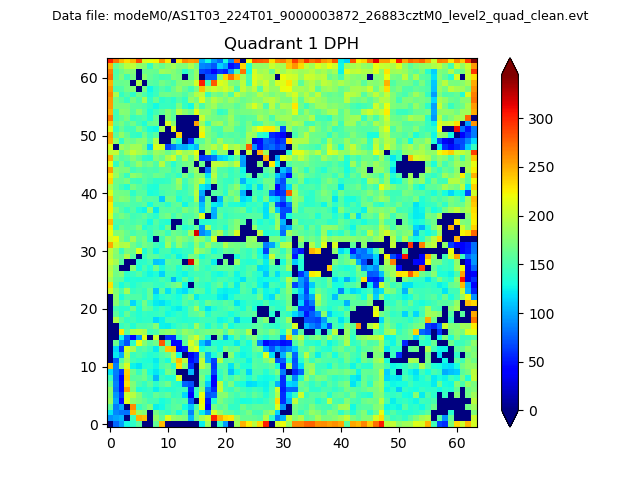 |
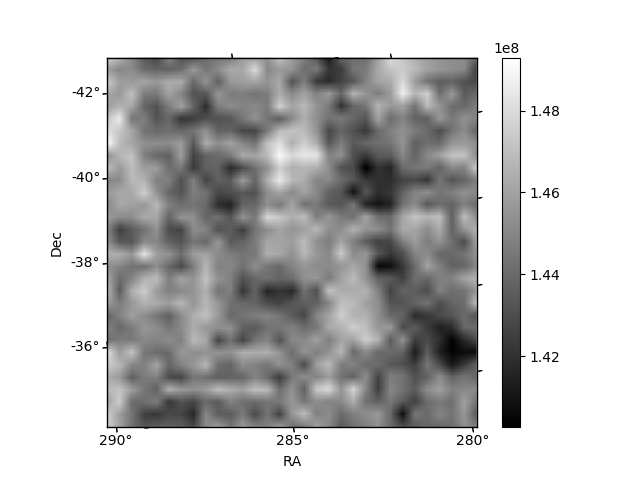
Quadrant B |
|---|---|---|---|
| Quadrant D | 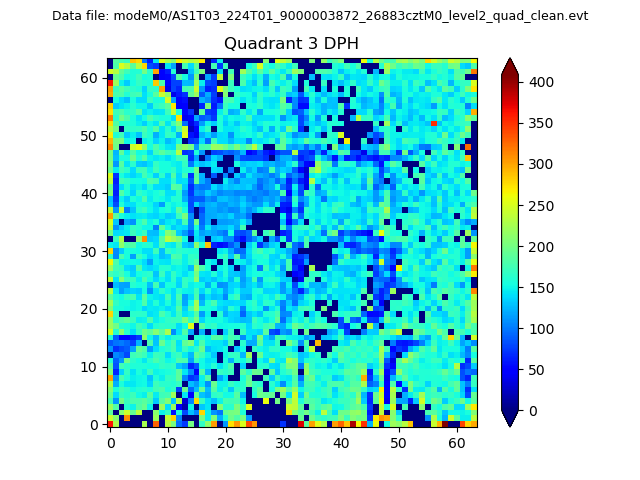 |
 |
Quadrant C |
| Plot type | Count rate plots | Images |
|---|---|---|
| Comparison with Poisson distribution Blue bars denote a histogram of data divided into 1 sec bins. Red curve is a Poisson curve with rate = median count rate of data. |
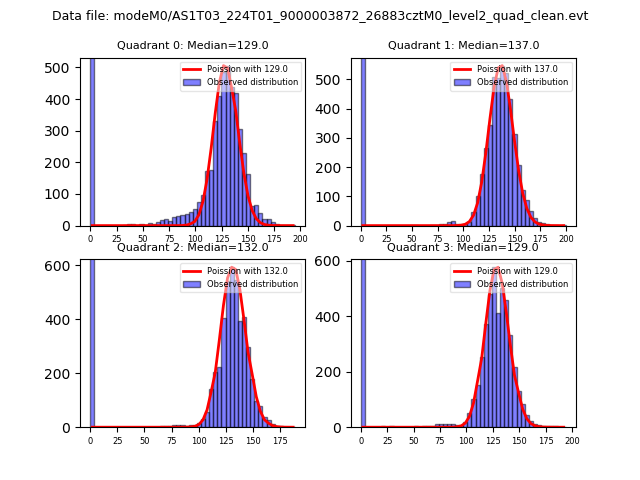 |
 |
| Quadrant-wise count rates Data is divided into 100 sec bins |
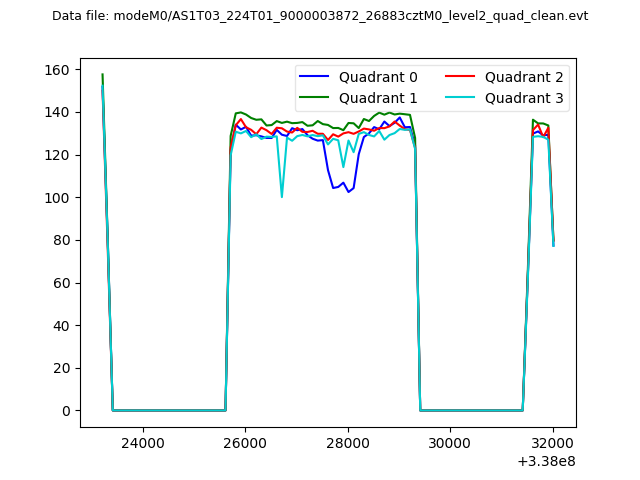 |
|
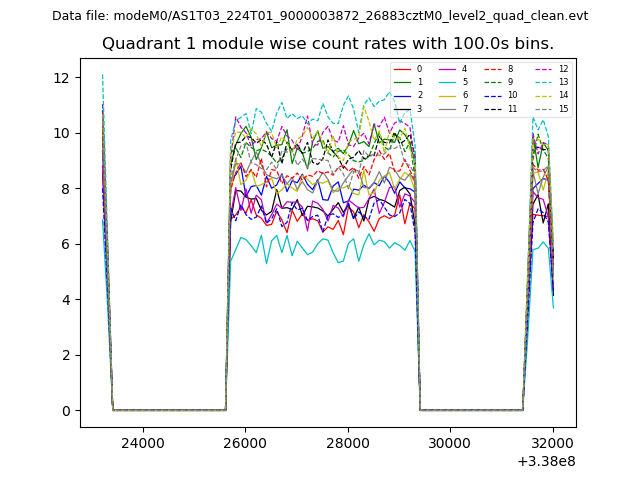
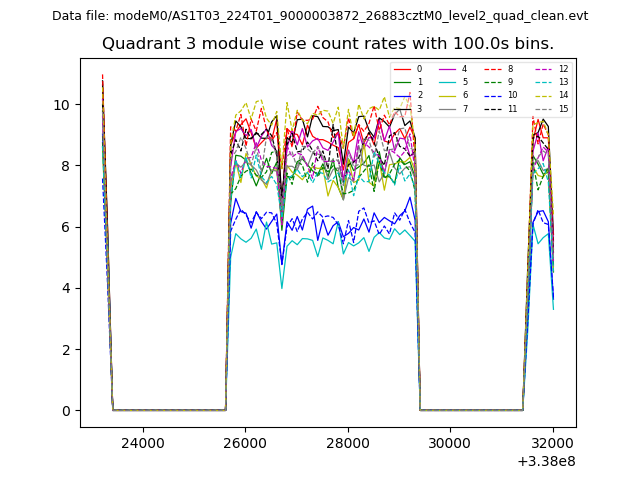
| Module-wise count rates for Quadrant A Data is divided into 100 sec bins |
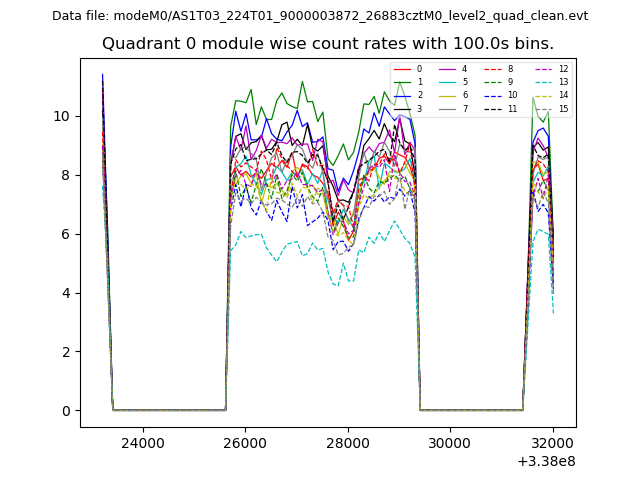 |
 |
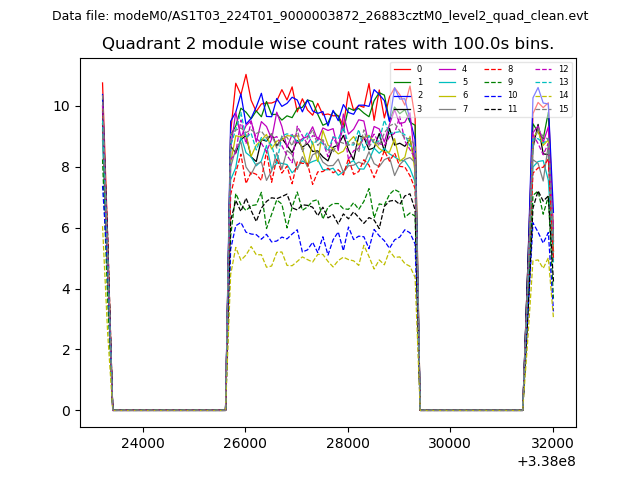
| Module-wise count rates for Quadrant B Data is divided into 100 sec bins |
 |
 |
| Module-wise count rates for Quadrant C Data is divided into 100 sec bins |
 |
 |
| Module-wise count rates for Quadrant D Data is divided into 100 sec bins |
 |
 |
| Parameter | Plot |
|---|---|
| CZT HV Monitor | 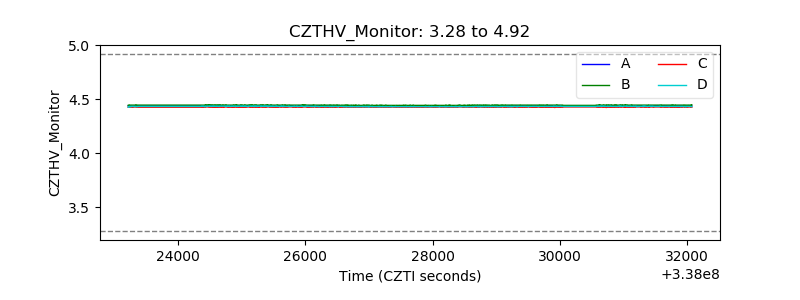 |
| D_VDD | 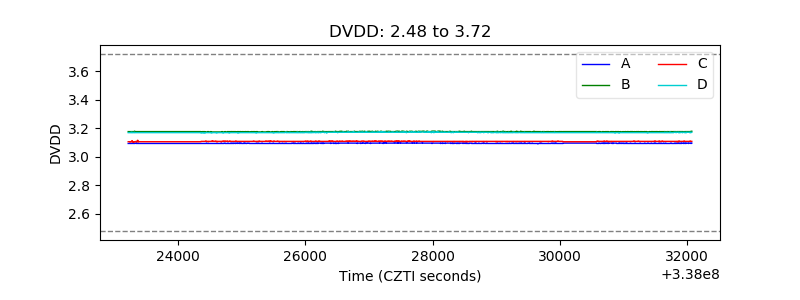 |
| Temperature 1 | 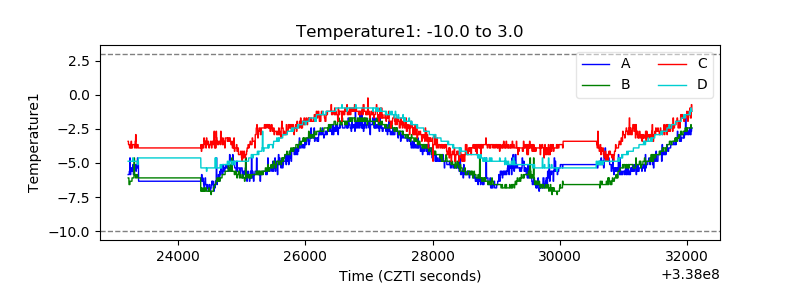 |
| Veto HV Monitor | 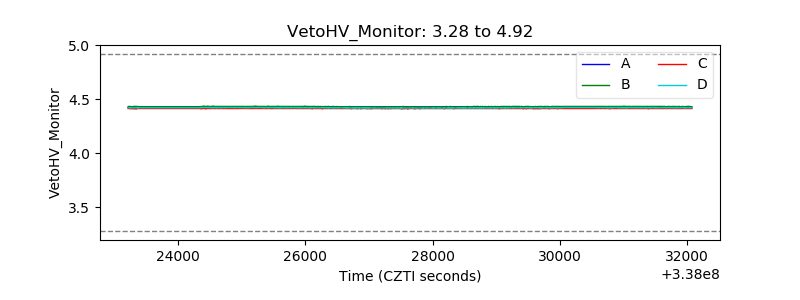 |
| Veto LLD | 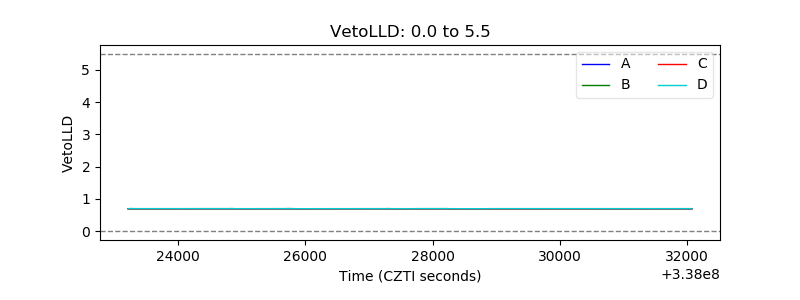 |
| Alpha Counter | 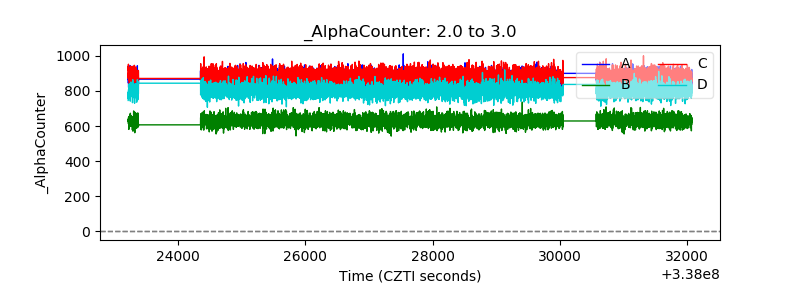 |
| _CPM_Rate | 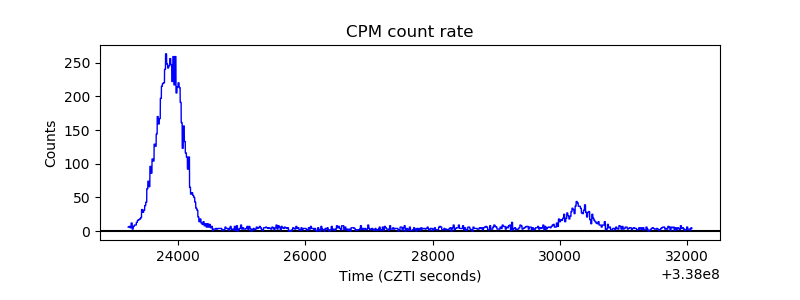 |
| CZT Counter | 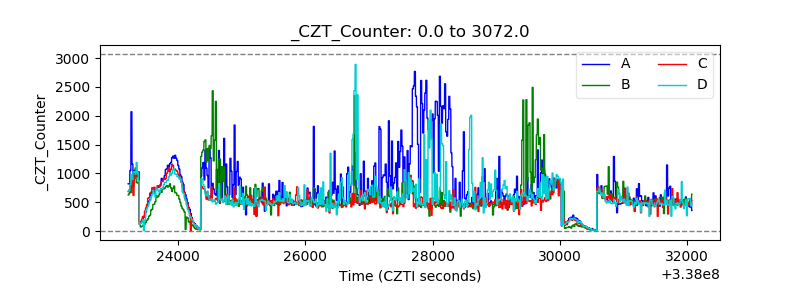 |
| +2.5 Volts monitor | 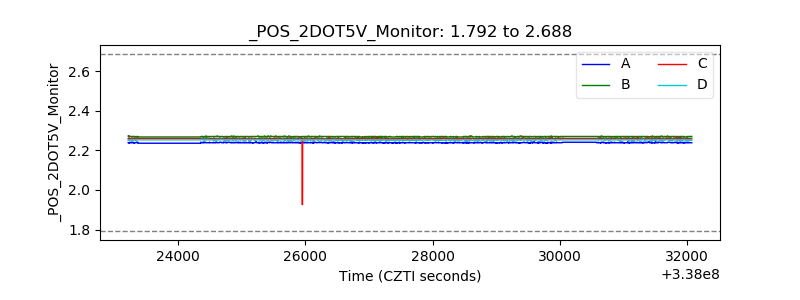 |
| +5 Volts monitor | 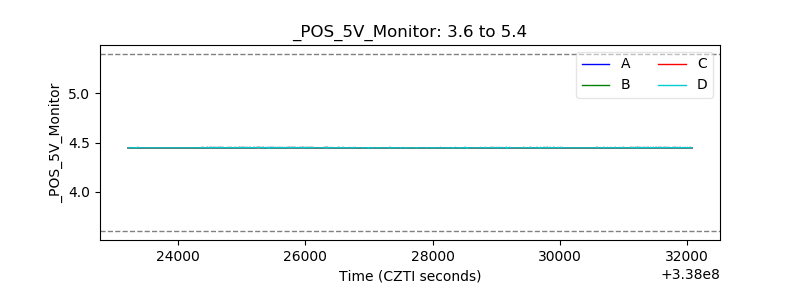 |
| _ROLL_ROT | 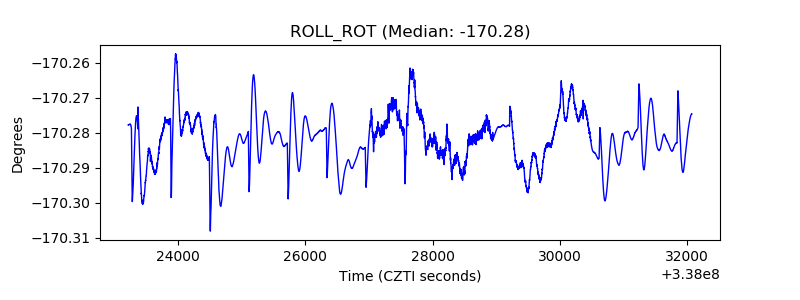 |
| _Roll_DEC |  |
| _Roll_RA | 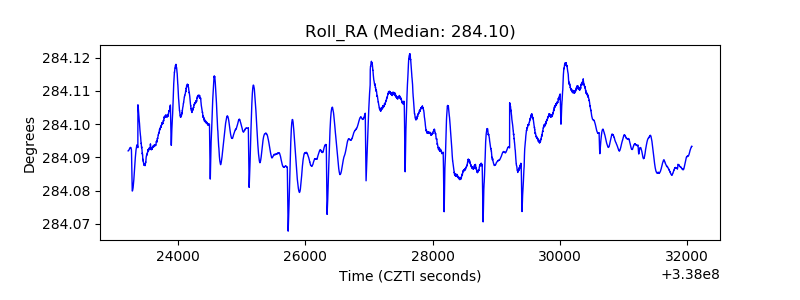 |
| Veto Counter | 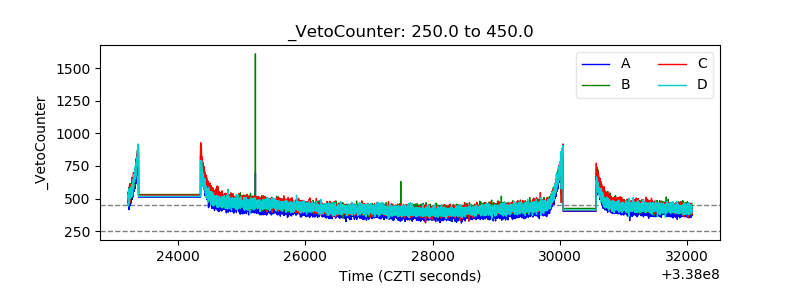 |