| Param | Original file | Final file |
|---|---|---|
| Filename | modeM0/AS1T03_224T01_9000003872_26884cztM0_level2.evt | modeM0/AS1T03_224T01_9000003872_26884cztM0_level2_quad_clean.evt |
| Size (bytes) | 590,857,920 | 97,182,720 |
| Size | 563.5 MB | 92.7 MB |
| Events in quadrant A | 4,378,047 | 599,702 |
| Events in quadrant B | 4,629,254 | 613,587 |
| Events in quadrant C | 3,977,852 | 599,378 |
| Events in quadrant D | 4,377,130 | 585,341 |
| Mode M0 | |||
|---|---|---|---|
| Quadrant | BADHDUFLAG | Total packets | Discarded packets |
| A | 0 | 17876 | 0 |
| B | 0 | 18717 | 0 |
| C | 0 | 16590 | 0 |
| D | 0 | 17953 | 0 |
| Mode M9 | |||
|---|---|---|---|
| Quadrant | BADHDUFLAG | Total packets | Discarded packets |
| A | 0 | 6 | 0 |
| B | 0 | 6 | 0 |
| C | 0 | 6 | 0 |
| D | 0 | 6 | 0 |
| Quadrant | Total seconds | Saturated seconds | Saturation percentage |
|---|---|---|---|
| A | 7842 | 353 | 4.501403% |
| B | 7842 | 407 | 5.190003% |
| C | 7842 | 418 | 5.330273% |
| D | 7842 | 285 | 3.634277% |
Noise dominated data is calculated using 1-second bins in cleaned event files. If a bin has >2000 counts, and if more than 50% of those come from <1% of pixels, then it is considered to be noise-dominated and hence unusable.
| Quadrant | # 1 sec bins | Bins with >0 counts | Bins with >2000 counts | High rate bins dominated by noise | Noise dominated (total time) | Noise dominated (detector-on time) | Marked lightcurve |
|---|---|---|---|---|---|---|---|
| A | 8437 | 7842 | 9 | 9 | 0.11% | 0.11% | 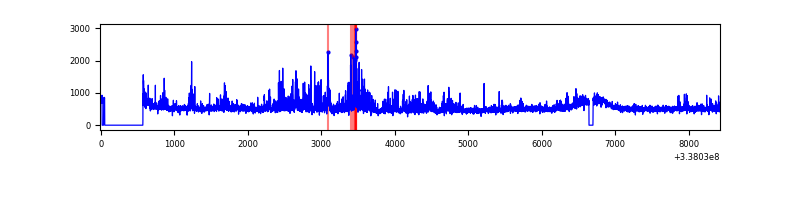 |
| B | 8437 | 7842 | 28 | 28 | 0.33% | 0.36% | 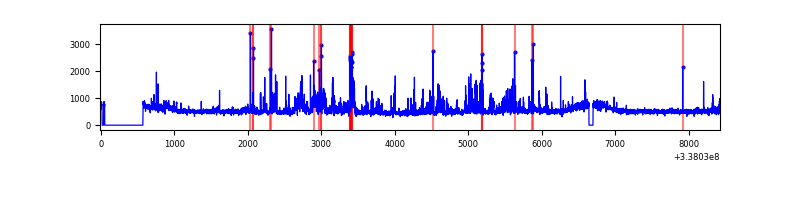 |
| C | 8437 | 7843 | 7 | 7 | 0.08% | 0.09% | 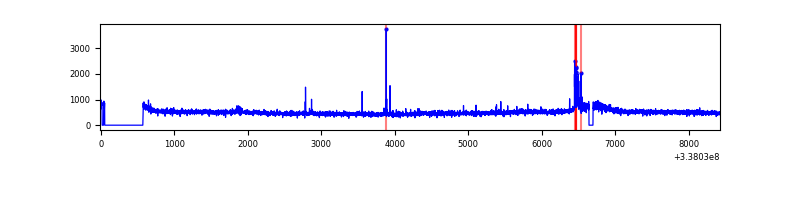 |
| D | 8437 | 7843 | 41 | 41 | 0.49% | 0.52% | 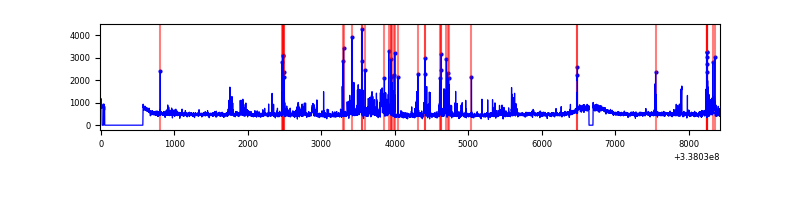 |
Top three noisy pixels from each quadrant. If the there are fewer than three noisy pixels in the level2.evt file, extra rows are filled as -1
| Pixel properties | Quadrant properties | ||||||
|---|---|---|---|---|---|---|---|
| Quadrant | DetID | PixID | Counts | Sigma | Mean | Median | Sigma |
| A | 0 | 13 | 545952 | 2740.27 | 993 | 971 | 198.9 |
| A | 13 | 254 | 12596 | 58.45 | 993 | 971 | 198.9 |
| A | 3 | 137 | 9603 | 43.4 | 993 | 971 | 198.9 |
| B | 3 | 64 | 513579 | 2676.19 | 987 | 961 | 191.5 |
| B | 0 | 190 | 177862 | 923.54 | 987 | 961 | 191.5 |
| B | 10 | 246 | 50802 | 260.2 | 987 | 961 | 191.5 |
| C | 14 | 238 | 153581 | 677.15 | 958 | 961 | 225.4 |
| C | 15 | 208 | 60521 | 264.26 | 958 | 961 | 225.4 |
| C | 3 | 233 | 28664 | 122.91 | 958 | 961 | 225.4 |
| D | 11 | 176 | 305257 | 1338.82 | 968 | 946 | 227.3 |
| D | 2 | 250 | 182506 | 798.78 | 968 | 946 | 227.3 |
| D | 1 | 52 | 75014 | 325.86 | 968 | 946 | 227.3 |
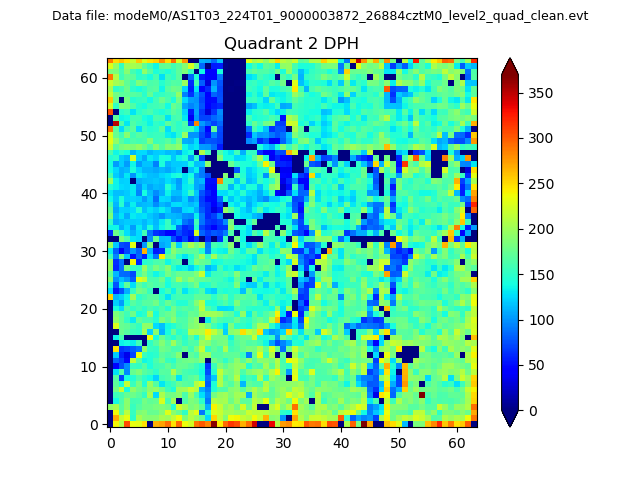
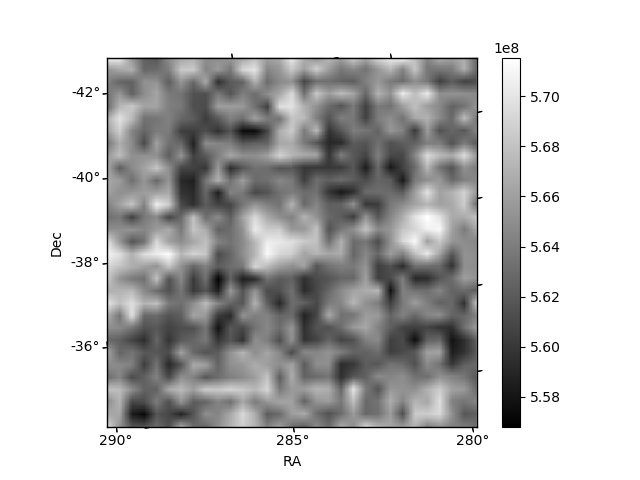
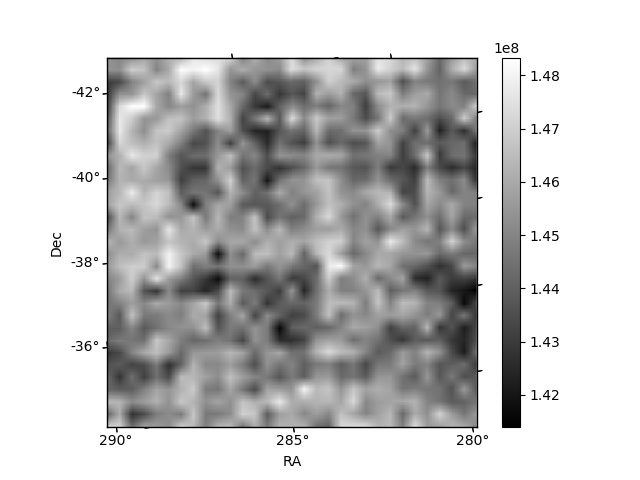
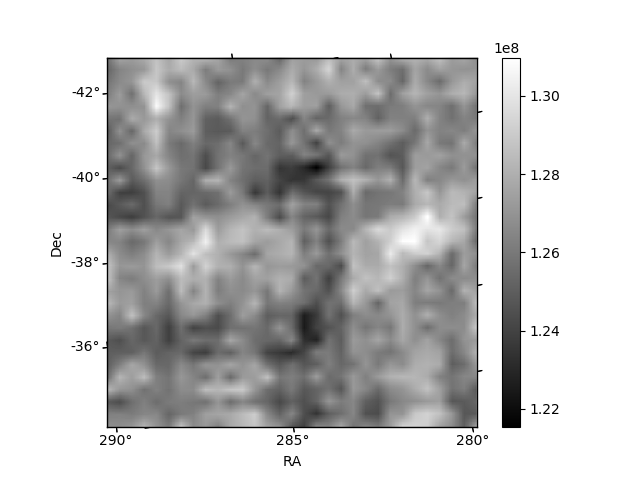
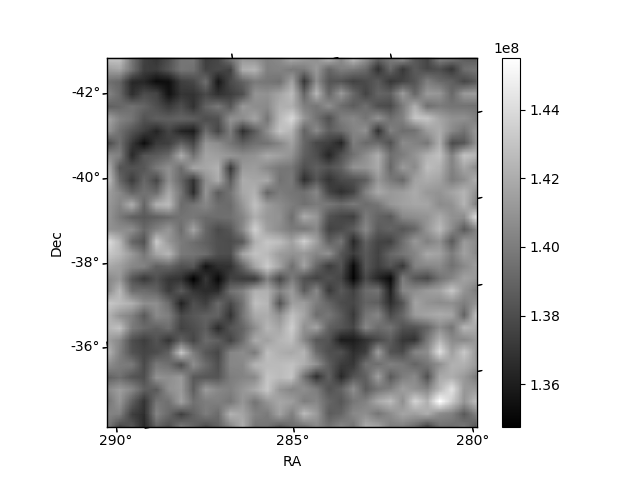
Histogram calculated using DETX and DETY for each event in the final _common_clean file
| Quadrant A | 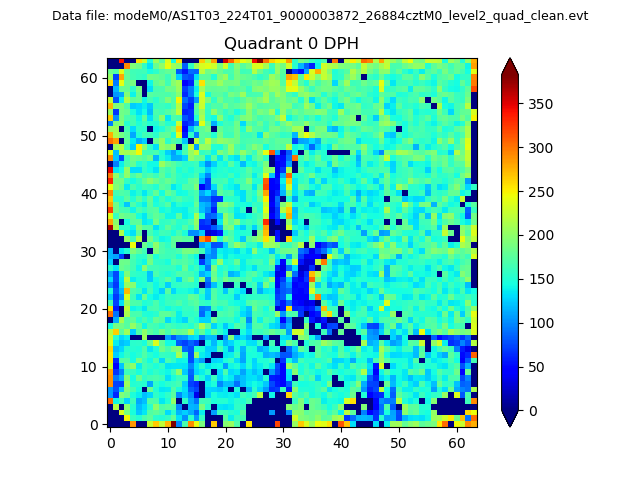 |
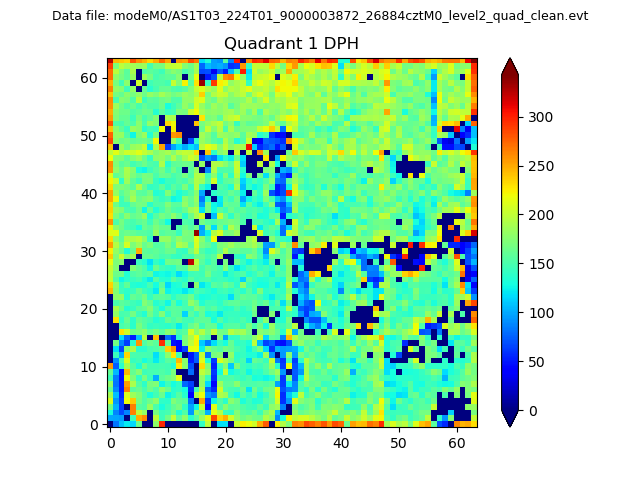 |
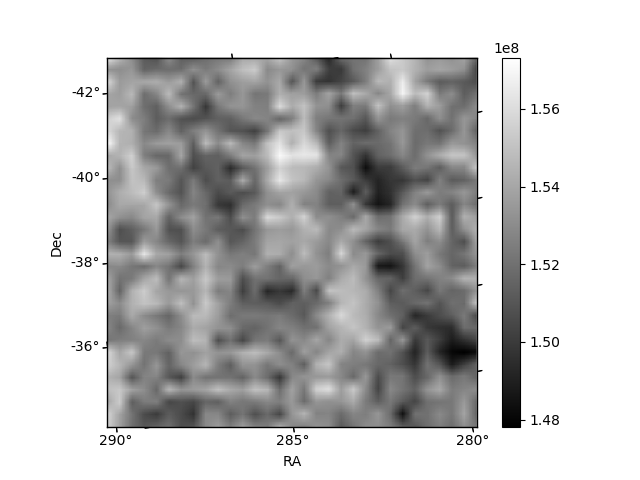
Quadrant B |
|---|---|---|---|
| Quadrant D | 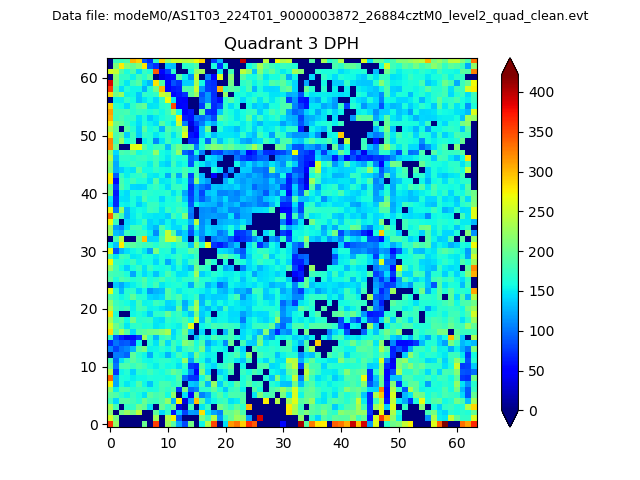 |
 |
Quadrant C |
| Plot type | Count rate plots | Images |
|---|---|---|
| Comparison with Poisson distribution Blue bars denote a histogram of data divided into 1 sec bins. Red curve is a Poisson curve with rate = median count rate of data. |
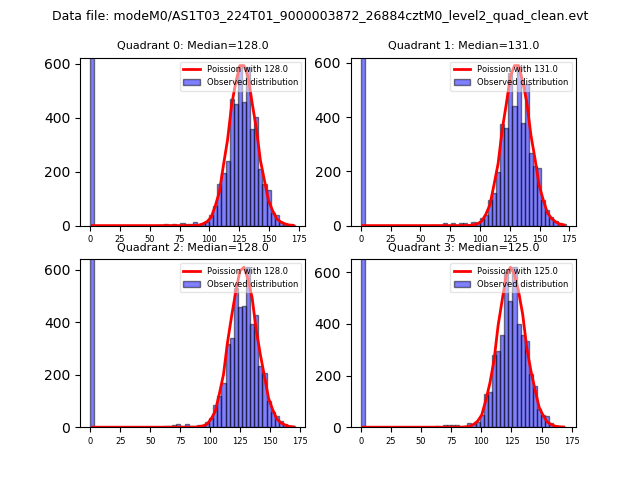 |
 |
| Quadrant-wise count rates Data is divided into 100 sec bins |
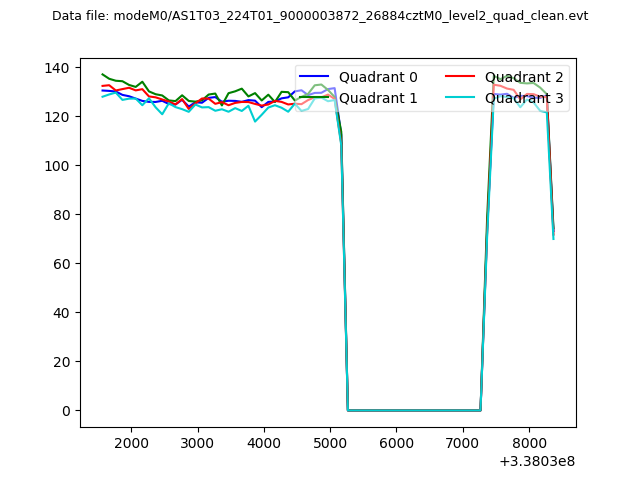 |
|
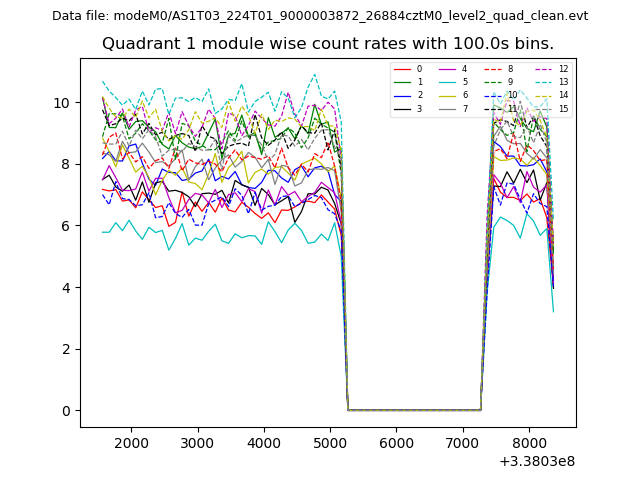
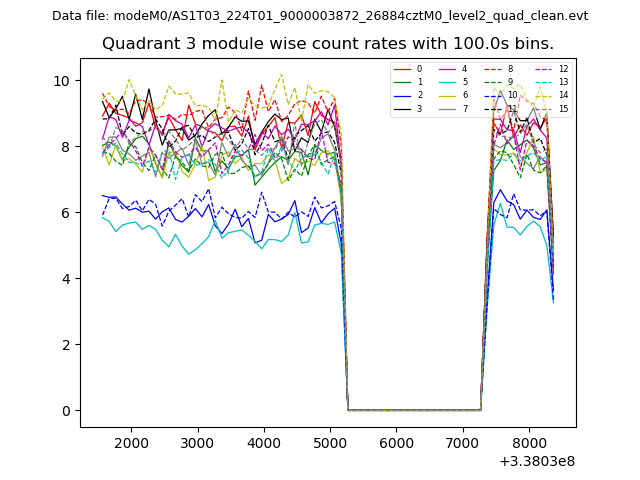
| Module-wise count rates for Quadrant A Data is divided into 100 sec bins |
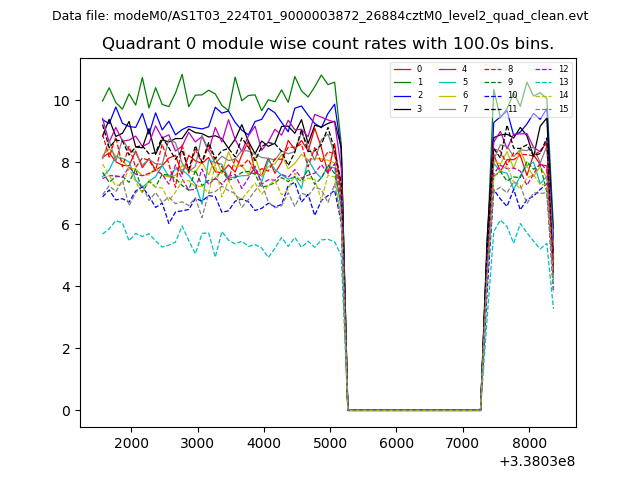 |
 |
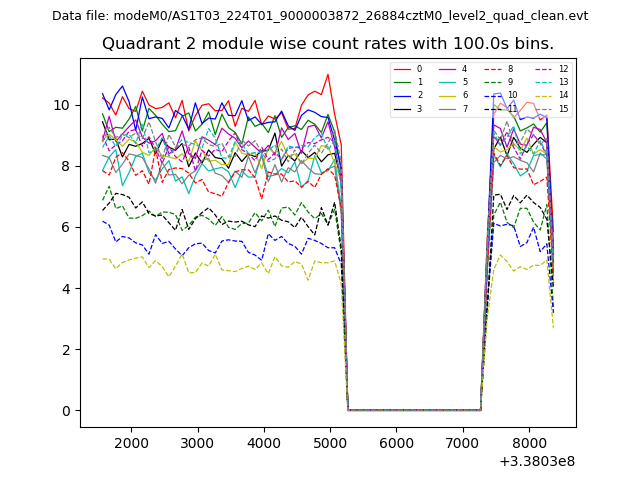
| Module-wise count rates for Quadrant B Data is divided into 100 sec bins |
 |
 |
| Module-wise count rates for Quadrant C Data is divided into 100 sec bins |
 |
 |
| Module-wise count rates for Quadrant D Data is divided into 100 sec bins |
 |
 |
| Parameter | Plot |
|---|---|
| CZT HV Monitor | 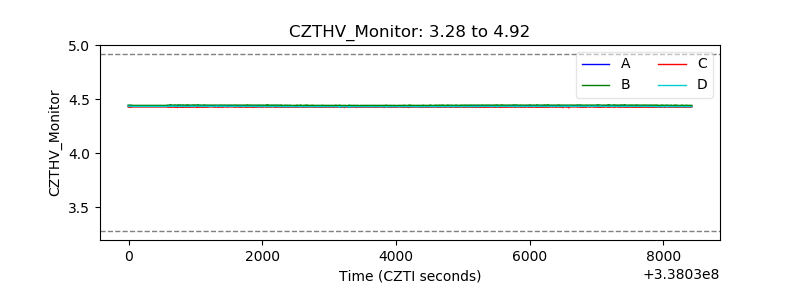 |
| D_VDD | 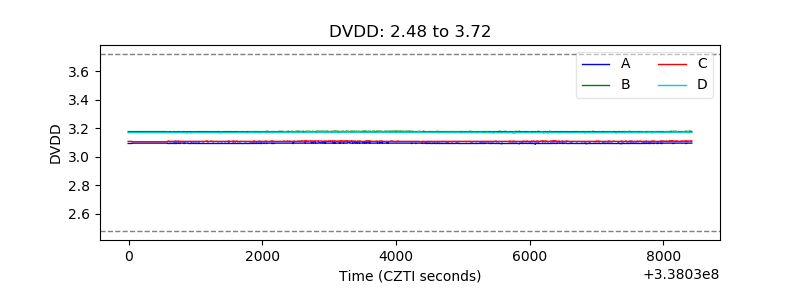 |
| Temperature 1 | 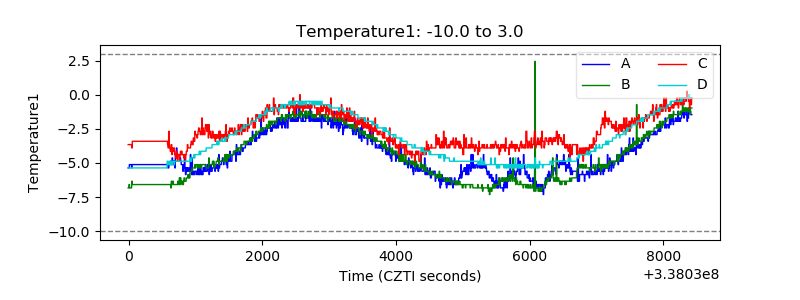 |
| Veto HV Monitor | 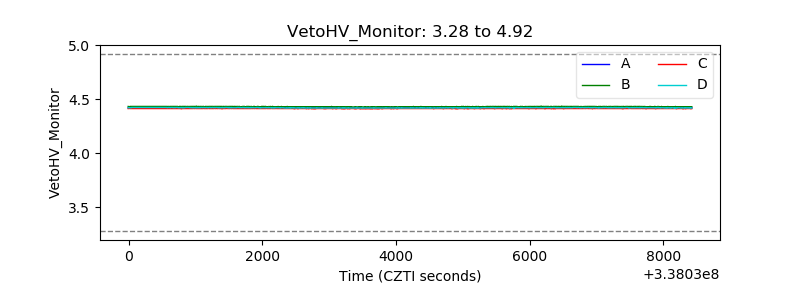 |
| Veto LLD | 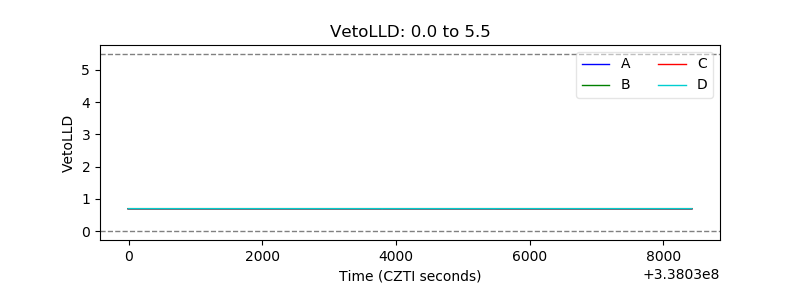 |
| Alpha Counter | 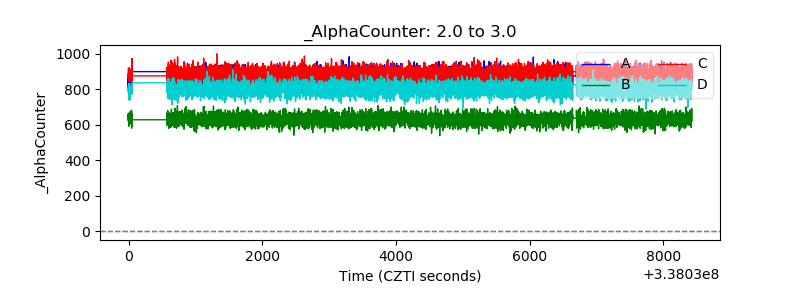 |
| _CPM_Rate | 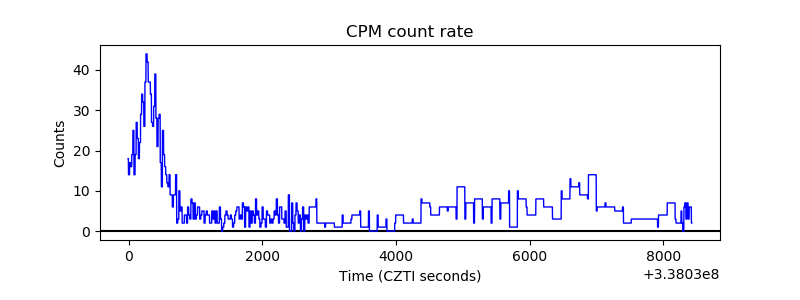 |
| CZT Counter | 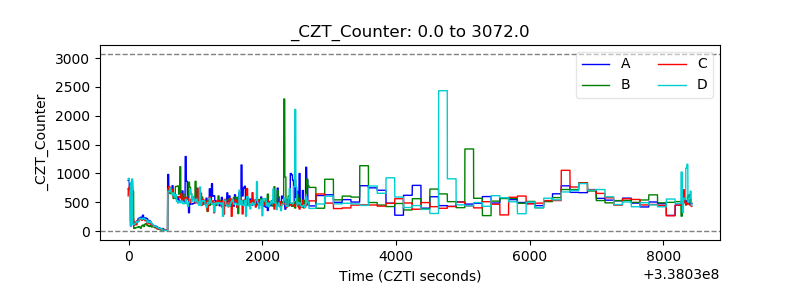 |
| +2.5 Volts monitor | 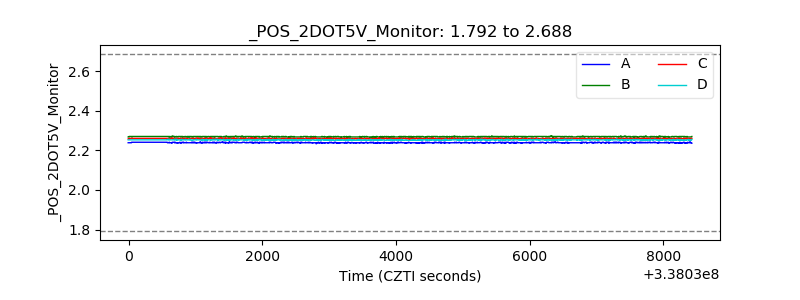 |
| +5 Volts monitor |  |
| _ROLL_ROT | 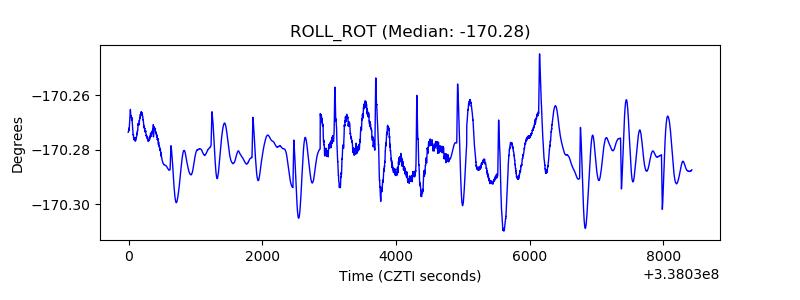 |
| _Roll_DEC | 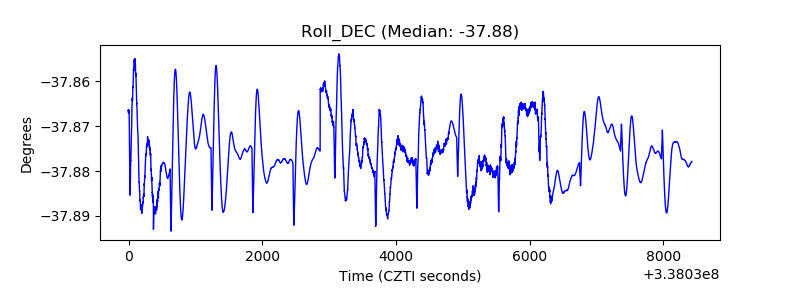 |
| _Roll_RA | 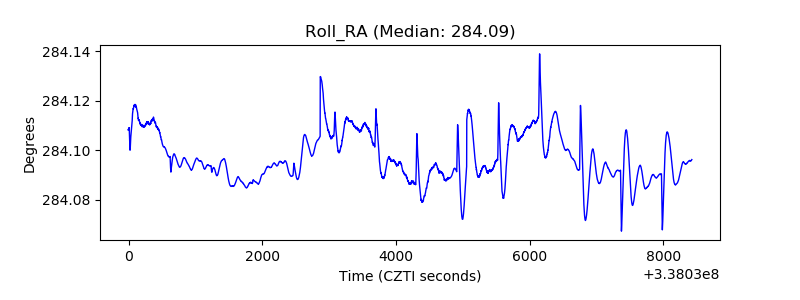 |
| Veto Counter | 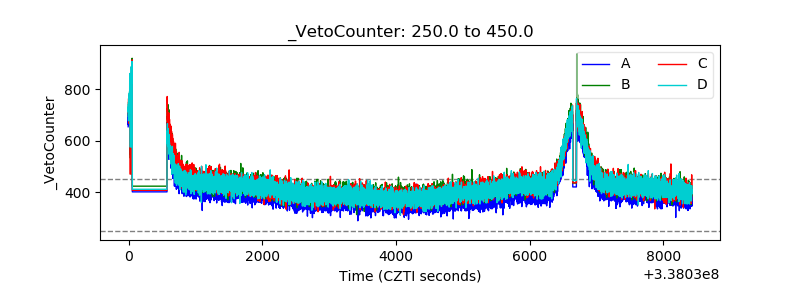 |