| Param | Original file | Final file |
|---|---|---|
| Filename | modeM0/AS1A09_038T10_9000003876cztM0_level2.fits | modeM0/AS1A09_038T10_9000003876cztM0_level2_quad_clean.evt |
| Size (bytes) | 68,388,480 | 75,147,840 |
| Size | 65.2 MB | 71.7 MB |
| Events in quadrant A | 409,390 | 460,786 |
| Events in quadrant B | 397,274 | 465,559 |
| Events in quadrant C | 410,166 | 447,616 |
| Events in quadrant D | 350,986 | 397,881 |
| Mode SS | |||
|---|---|---|---|
| Quadrant | BADHDUFLAG | Total packets | Discarded packets |
| A | 0 | 144 | 0 |
| B | 0 | 144 | 0 |
| C | 0 | 144 | 0 |
| D | 0 | 144 | 0 |
| Mode M0 | |||
|---|---|---|---|
| Quadrant | BADHDUFLAG | Total packets | Discarded packets |
| A | 0 | 18527 | 0 |
| B | 0 | 16790 | 0 |
| C | 0 | 14738 | 0 |
| D | 0 | 20124 | 0 |
| Mode M9 | |||
|---|---|---|---|
| Quadrant | BADHDUFLAG | Total packets | Discarded packets |
| A | 0 | 7 | 0 |
| B | 0 | 7 | 0 |
| C | 0 | 7 | 0 |
| D | 0 | 7 | 0 |
| Quadrant | Total seconds | Saturated seconds | Saturation percentage |
|---|---|---|---|
| A | 7240 | 121 | 1.671271% |
| B | 7240 | 116 | 1.602210% |
| C | 7240 | 69 | 0.953039% |
| D | 7240 | 327 | 4.516575% |
Noise dominated data is calculated using 1-second bins in cleaned event files. If a bin has >2000 counts, and if more than 50% of those come from <1% of pixels, then it is considered to be noise-dominated and hence unusable.
| Quadrant | # 1 sec bins | Bins with >0 counts | Bins with >2000 counts | High rate bins dominated by noise | Noise dominated (total time) | Noise dominated (detector-on time) | Marked lightcurve |
|---|---|---|---|---|---|---|---|
| A | 7875 | 7241 | 0 | 0 | 0.00% | 0.00% |  |
| B | 7875 | 7239 | 0 | 0 | 0.00% | 0.00% |  |
| C | 7875 | 7240 | 0 | 0 | 0.00% | 0.00% | 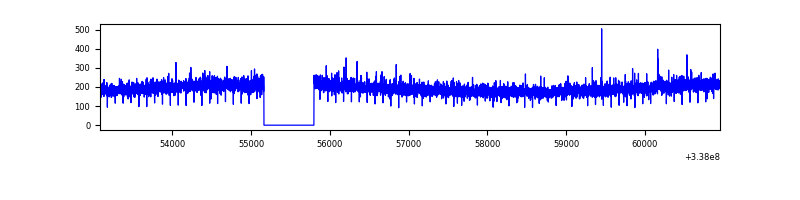 |
| D | 7875 | 7237 | 0 | 0 | 0.00% | 0.00% |  |
Top three noisy pixels from each quadrant. If the there are fewer than three noisy pixels in the level2.evt file, extra rows are filled as -1
| Pixel properties | Quadrant properties | ||||||
|---|---|---|---|---|---|---|---|
| Quadrant | DetID | PixID | Counts | Sigma | Mean | Median | Sigma |
| A | 0 | 29 | 331 | 8.23 | 106 | 100 | 28.1 |
| A | 0 | 30 | 303 | 7.24 | 106 | 100 | 28.1 |
| A | 7 | 110 | 303 | 7.24 | 106 | 100 | 28.1 |
| B | 2 | 9 | 344 | 10.63 | 104 | 100 | 23.0 |
| B | 2 | 8 | 281 | 7.89 | 104 | 100 | 23.0 |
| B | 3 | 17 | 270 | 7.41 | 104 | 100 | 23.0 |
| C | 9 | 209 | 309 | 7.1 | 108 | 101 | 29.3 |
| C | 12 | 241 | 300 | 6.79 | 108 | 101 | 29.3 |
| C | 2 | 191 | 284 | 6.25 | 108 | 101 | 29.3 |
| D | 12 | 6 | 262 | 6.05 | 100 | 91 | 28.3 |
| D | 7 | 3 | 252 | 5.69 | 100 | 91 | 28.3 |
| D | 10 | 113 | 250 | 5.62 | 100 | 91 | 28.3 |
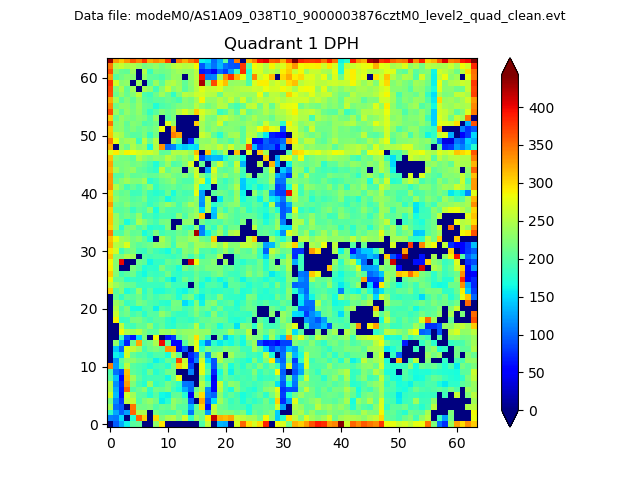
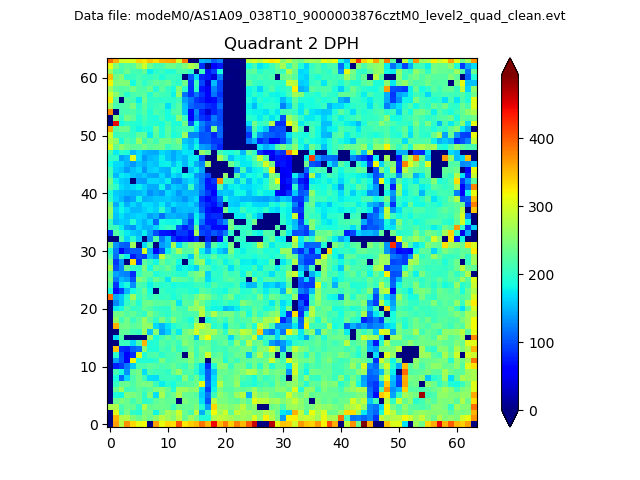
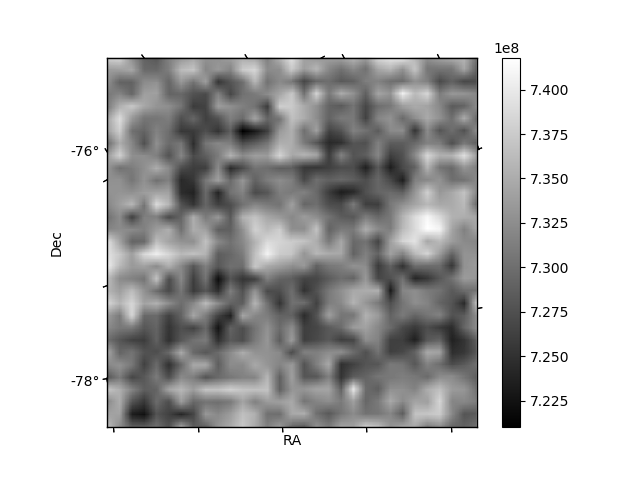
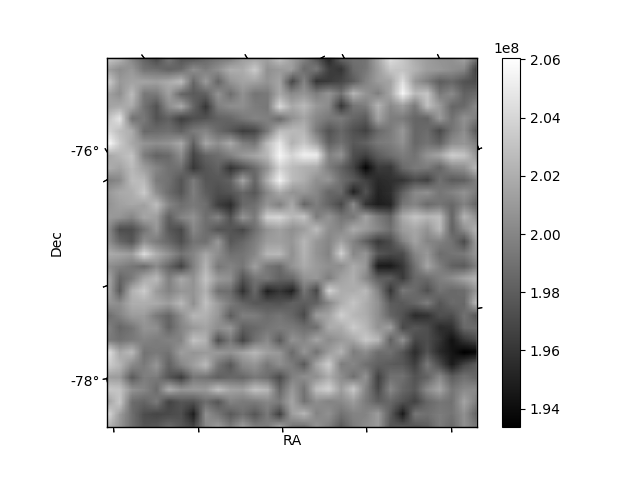
Histogram calculated using DETX and DETY for each event in the final _common_clean file
| Quadrant A |  |
 |
Quadrant B |
|---|---|---|---|
| Quadrant D | 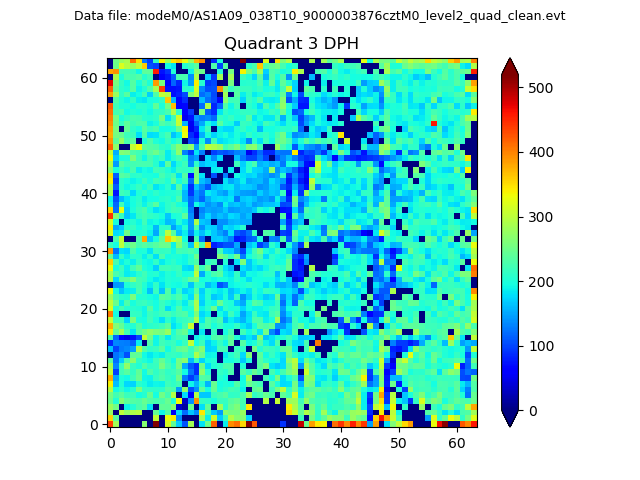 |
 |
Quadrant C |
| Plot type | Count rate plots | Images |
|---|---|---|
| Comparison with Poisson distribution Blue bars denote a histogram of data divided into 1 sec bins. Red curve is a Poisson curve with rate = median count rate of data. |
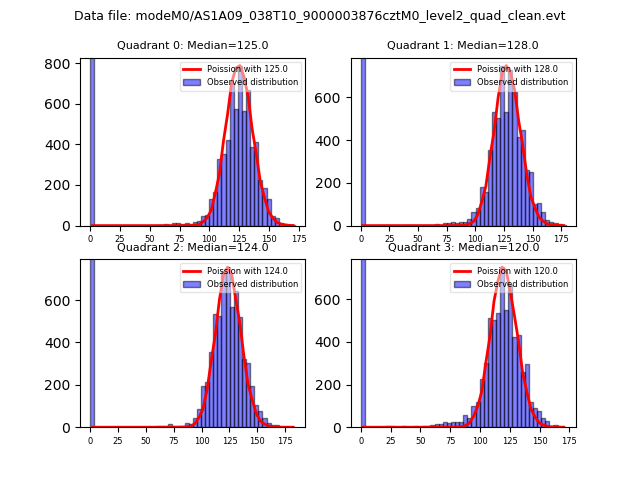 |
 |
| Quadrant-wise count rates Data is divided into 100 sec bins |
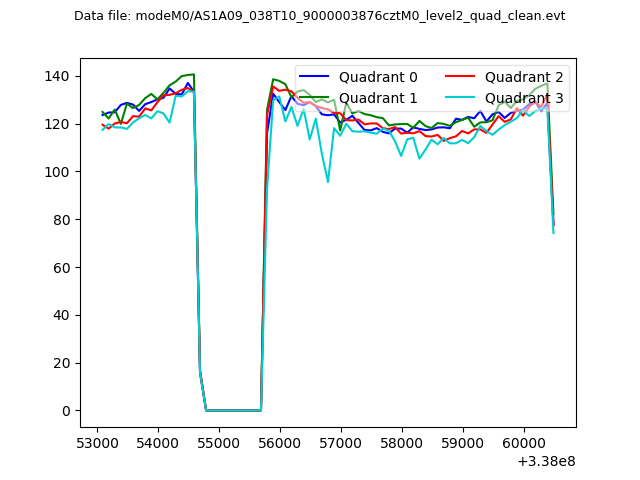 |
|
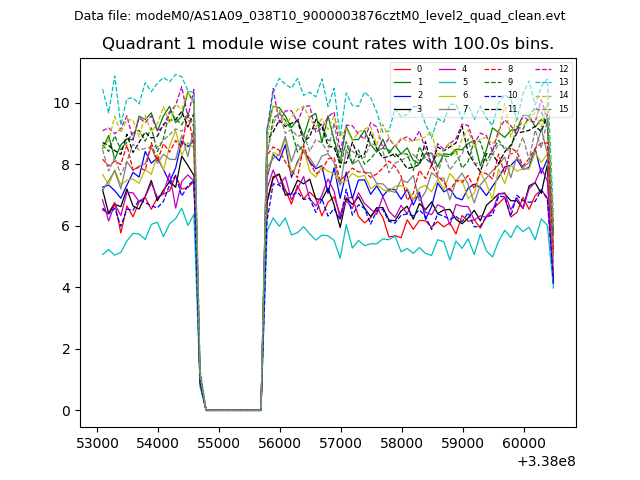
| Module-wise count rates for Quadrant A Data is divided into 100 sec bins |
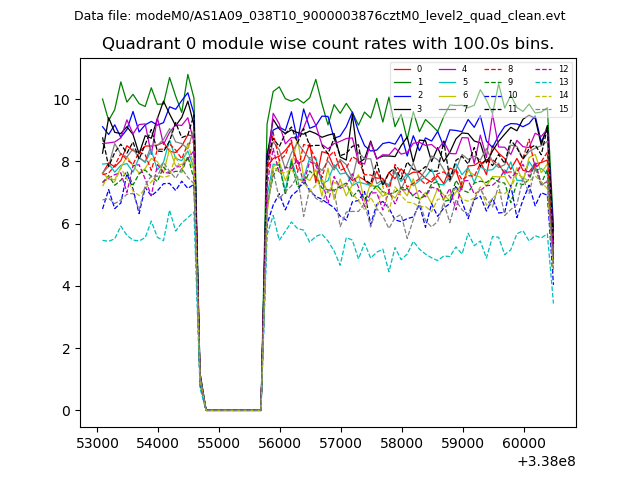 |
 |
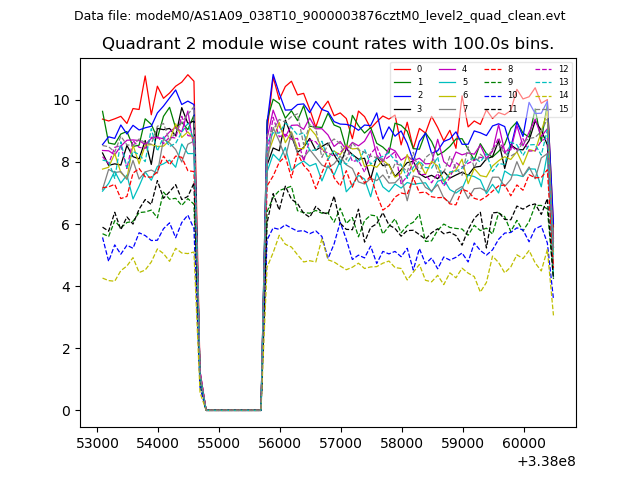
| Module-wise count rates for Quadrant B Data is divided into 100 sec bins |
 |
 |
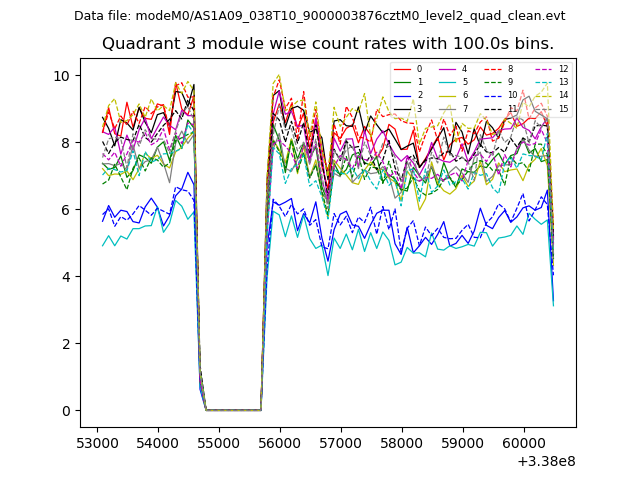
| Module-wise count rates for Quadrant C Data is divided into 100 sec bins |
 |
 |
| Module-wise count rates for Quadrant D Data is divided into 100 sec bins |
 |
 |
| Parameter | Plot |
|---|---|
| CZT HV Monitor | 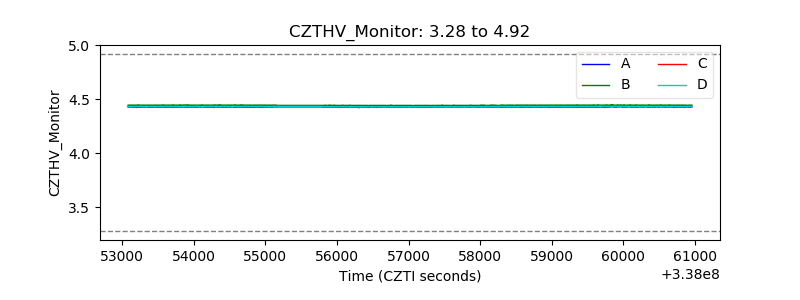 |
| D_VDD | 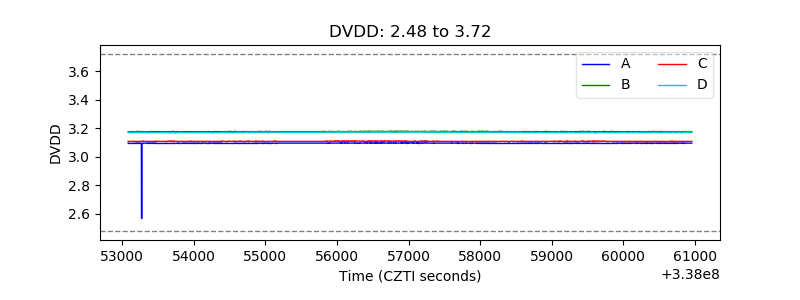 |
| Temperature 1 |  |
| Veto HV Monitor |  |
| Veto LLD |  |
| Alpha Counter |  |
| _CPM_Rate |  |
| CZT Counter |  |
| +2.5 Volts monitor |  |
| +5 Volts monitor |  |
| _ROLL_ROT | 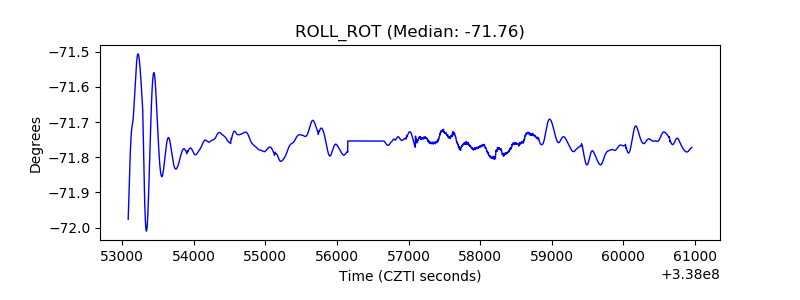 |
| _Roll_DEC |  |
| _Roll_RA |  |
| Veto Counter |  |