| Param | Original file | Final file |
|---|---|---|
| Filename | modeM0/AS1A09_038T10_9000003876_26888cztM0_level2.evt | modeM0/AS1A09_038T10_9000003876_26888cztM0_level2_quad_clean.evt |
| Size (bytes) | 583,280,640 | 120,447,360 |
| Size | 556.3 MB | 114.9 MB |
| Events in quadrant A | 4,586,660 | 792,528 |
| Events in quadrant B | 4,097,273 | 811,279 |
| Events in quadrant C | 3,399,240 | 786,135 |
| Events in quadrant D | 5,091,658 | 754,671 |
| Mode M0 | |||
|---|---|---|---|
| Quadrant | BADHDUFLAG | Total packets | Discarded packets |
| A | 0 | 18527 | 0 |
| B | 0 | 16790 | 0 |
| C | 0 | 14738 | 0 |
| D | 0 | 20124 | 0 |
| Mode M9 | |||
|---|---|---|---|
| Quadrant | BADHDUFLAG | Total packets | Discarded packets |
| A | 0 | 7 | 0 |
| B | 0 | 7 | 0 |
| C | 0 | 7 | 0 |
| D | 0 | 7 | 0 |
| Quadrant | Total seconds | Saturated seconds | Saturation percentage |
|---|---|---|---|
| A | 7240 | 121 | 1.671271% |
| B | 7240 | 116 | 1.602210% |
| C | 7240 | 69 | 0.953039% |
| D | 7240 | 327 | 4.516575% |
Noise dominated data is calculated using 1-second bins in cleaned event files. If a bin has >2000 counts, and if more than 50% of those come from <1% of pixels, then it is considered to be noise-dominated and hence unusable.
| Quadrant | # 1 sec bins | Bins with >0 counts | Bins with >2000 counts | High rate bins dominated by noise | Noise dominated (total time) | Noise dominated (detector-on time) | Marked lightcurve |
|---|---|---|---|---|---|---|---|
| A | 7875 | 7241 | 38 | 38 | 0.48% | 0.52% | 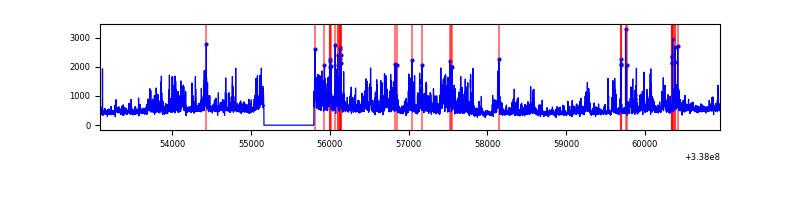 |
| B | 7875 | 7240 | 61 | 61 | 0.77% | 0.84% | 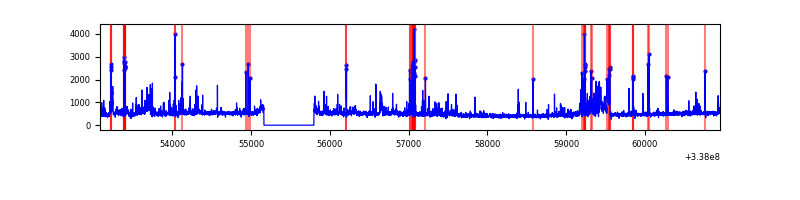 |
| C | 7875 | 7241 | 0 | 0 | 0.00% | 0.00% | 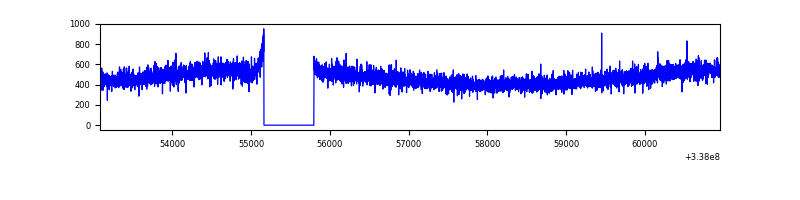 |
| D | 7875 | 7241 | 256 | 256 | 3.25% | 3.54% | 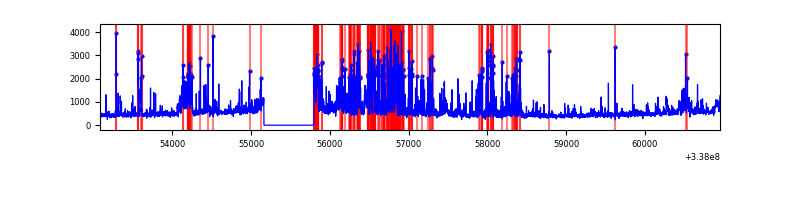 |
Top three noisy pixels from each quadrant. If the there are fewer than three noisy pixels in the level2.evt file, extra rows are filled as -1
| Pixel properties | Quadrant properties | ||||||
|---|---|---|---|---|---|---|---|
| Quadrant | DetID | PixID | Counts | Sigma | Mean | Median | Sigma |
| A | 0 | 13 | 888992 | 5174.78 | 853 | 835 | 171.6 |
| A | 6 | 16 | 400190 | 2326.81 | 853 | 835 | 171.6 |
| A | 13 | 254 | 10698 | 57.47 | 853 | 835 | 171.6 |
| B | 3 | 64 | 596381 | 3649.41 | 856 | 832 | 163.2 |
| B | 10 | 246 | 85189 | 516.92 | 856 | 832 | 163.2 |
| B | 0 | 190 | 36110 | 216.18 | 856 | 832 | 163.2 |
| C | 14 | 238 | 133861 | 678.52 | 837 | 842 | 196.0 |
| C | 13 | 61 | 5887 | 25.73 | 837 | 842 | 196.0 |
| C | 15 | 208 | 3295 | 12.51 | 837 | 842 | 196.0 |
| D | 1 | 52 | 653683 | 3373.08 | 824 | 803 | 193.6 |
| D | 7 | 80 | 650359 | 3355.91 | 824 | 803 | 193.6 |
| D | 2 | 250 | 435463 | 2245.66 | 824 | 803 | 193.6 |
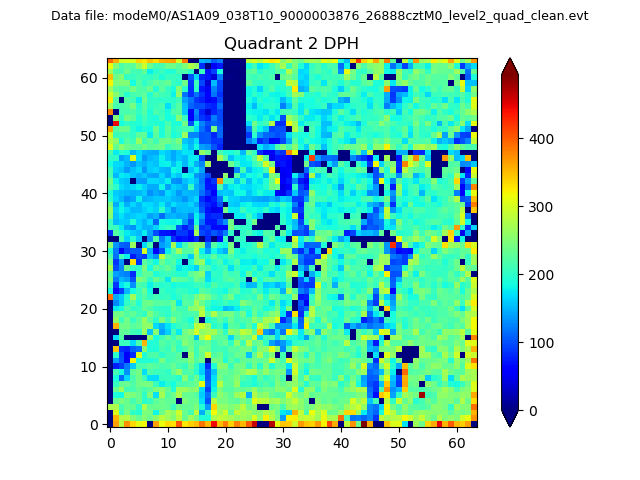
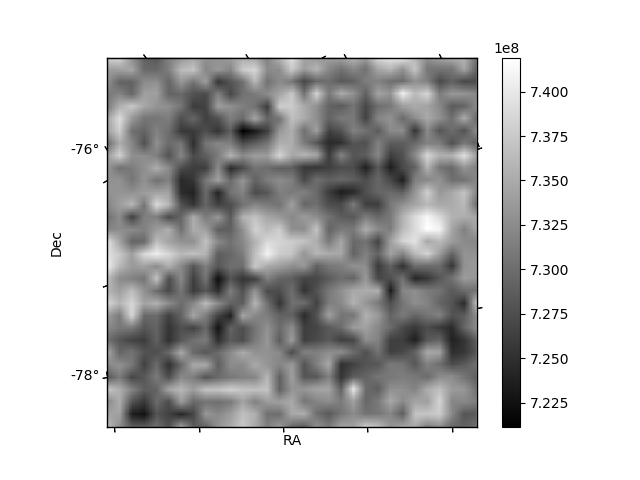
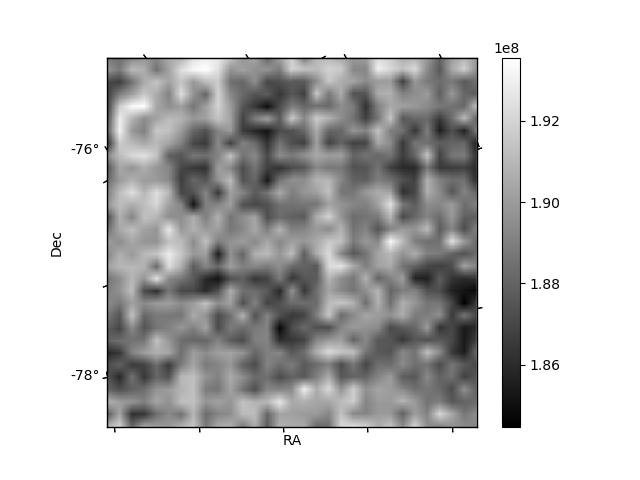
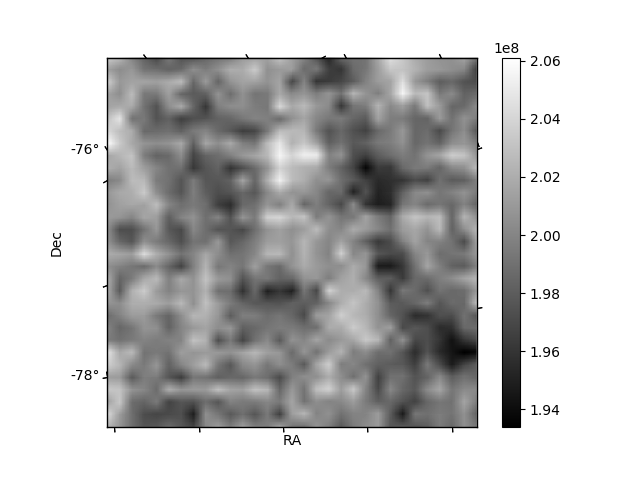
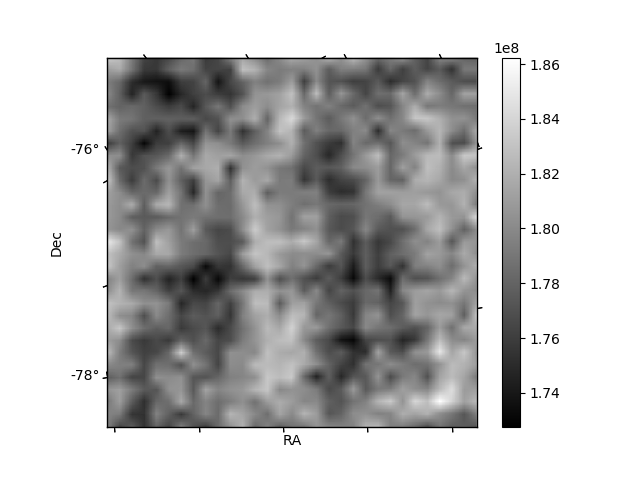
Histogram calculated using DETX and DETY for each event in the final _common_clean file
| Quadrant A | 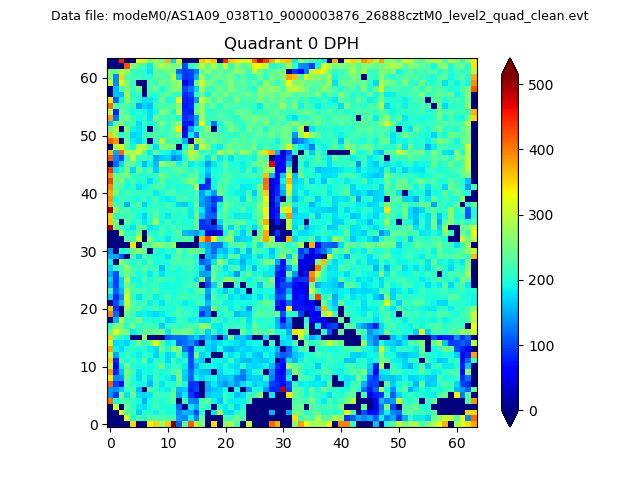 |
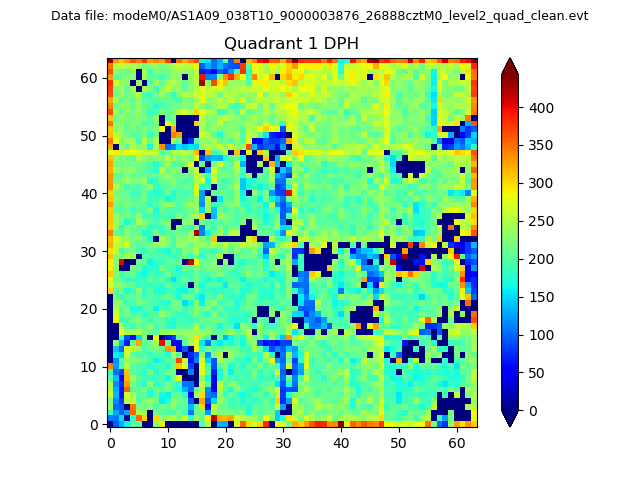 |
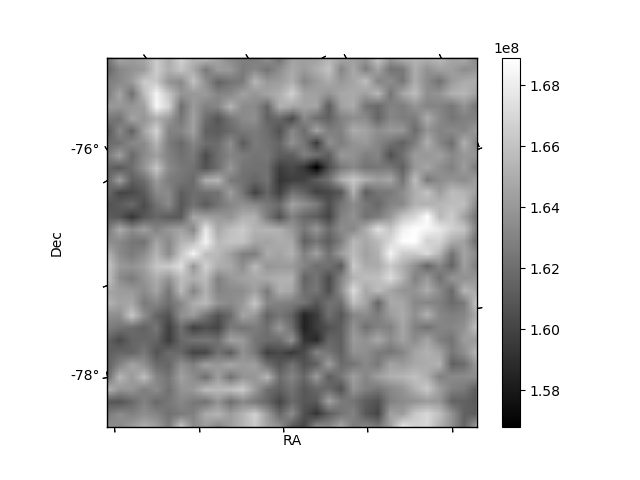
Quadrant B |
|---|---|---|---|
| Quadrant D | 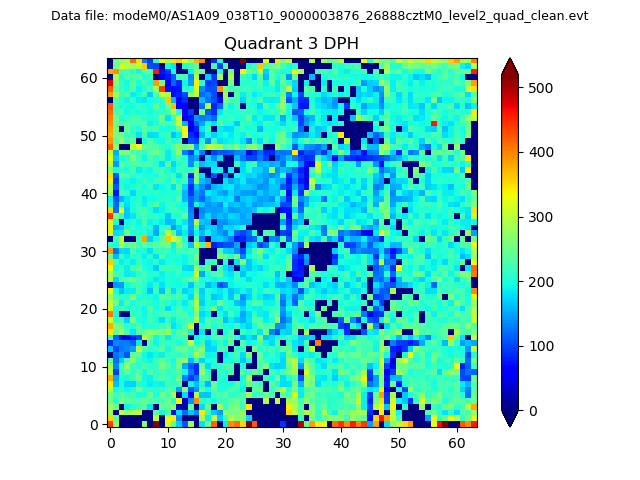 |
 |
Quadrant C |
| Plot type | Count rate plots | Images |
|---|---|---|
| Comparison with Poisson distribution Blue bars denote a histogram of data divided into 1 sec bins. Red curve is a Poisson curve with rate = median count rate of data. |
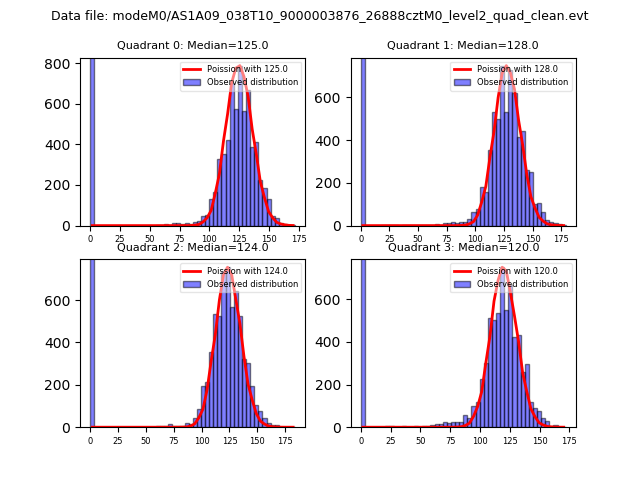 |
 |
| Quadrant-wise count rates Data is divided into 100 sec bins |
 |
|
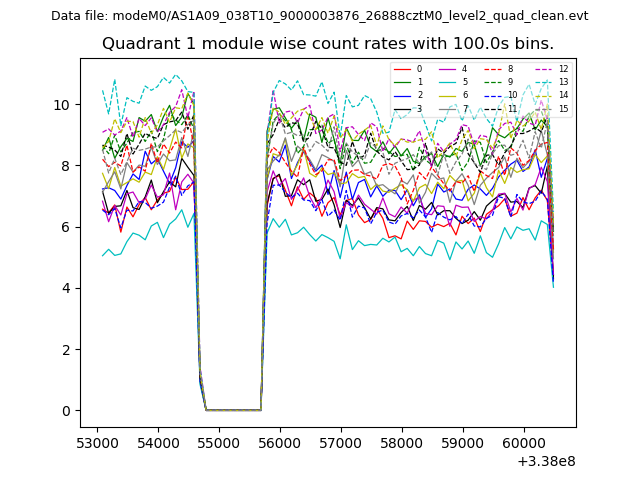
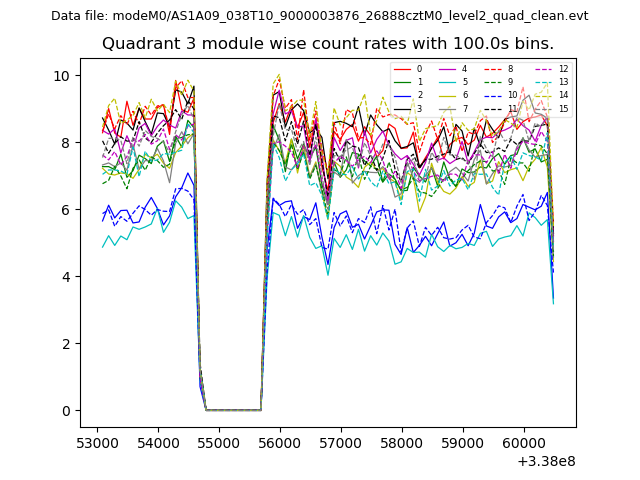
| Module-wise count rates for Quadrant A Data is divided into 100 sec bins |
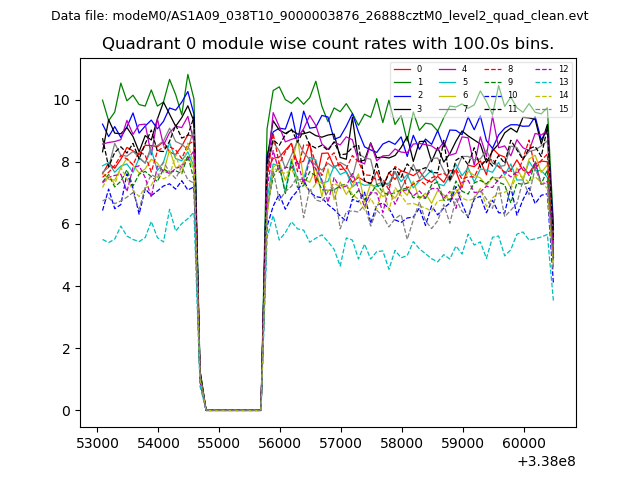 |
 |
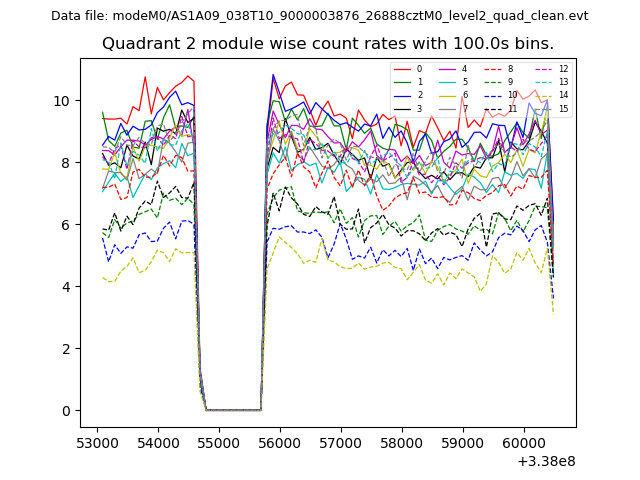
| Module-wise count rates for Quadrant B Data is divided into 100 sec bins |
 |
 |
| Module-wise count rates for Quadrant C Data is divided into 100 sec bins |
 |
 |
| Module-wise count rates for Quadrant D Data is divided into 100 sec bins |
 |
 |
| Parameter | Plot |
|---|---|
| CZT HV Monitor | 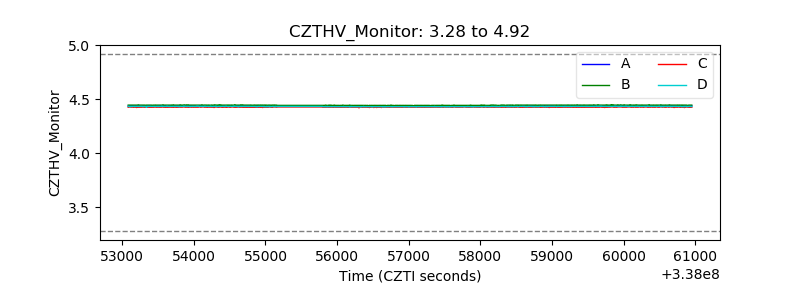 |
| D_VDD | 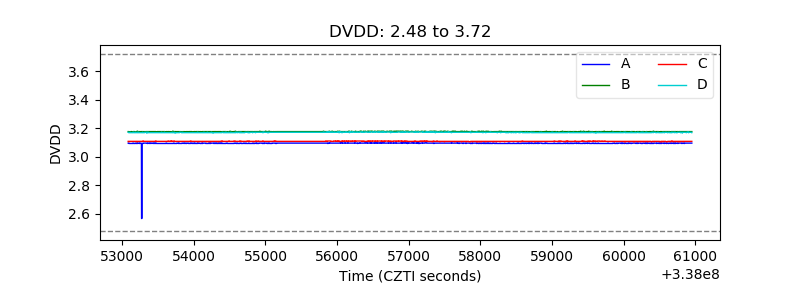 |
| Temperature 1 | 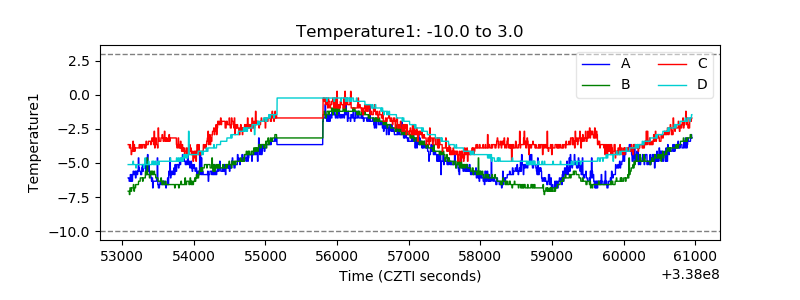 |
| Veto HV Monitor | 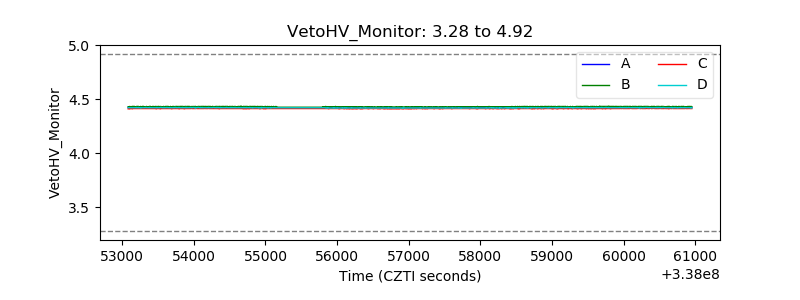 |
| Veto LLD | 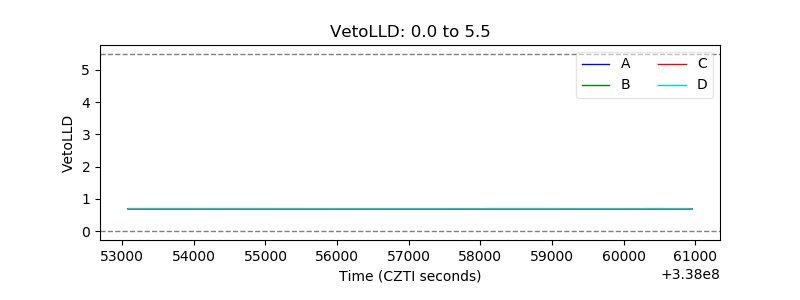 |
| Alpha Counter | 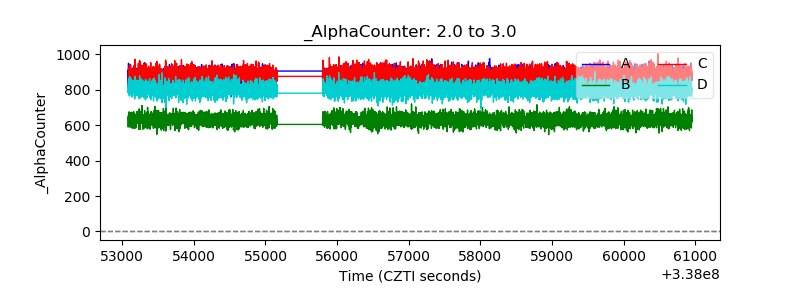 |
| _CPM_Rate | 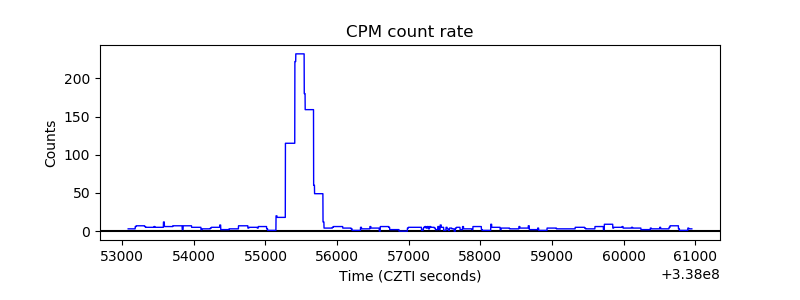 |
| CZT Counter |  |
| +2.5 Volts monitor |  |
| +5 Volts monitor |  |
| _ROLL_ROT | 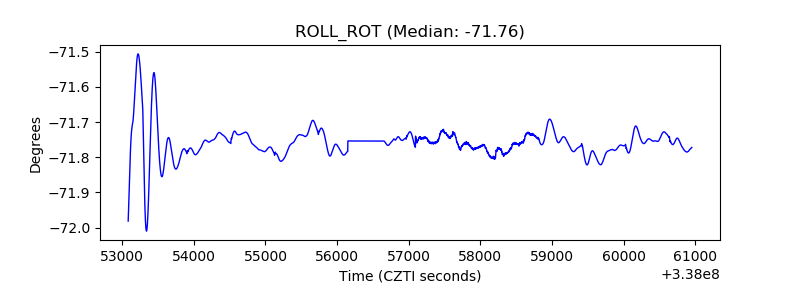 |
| _Roll_DEC | 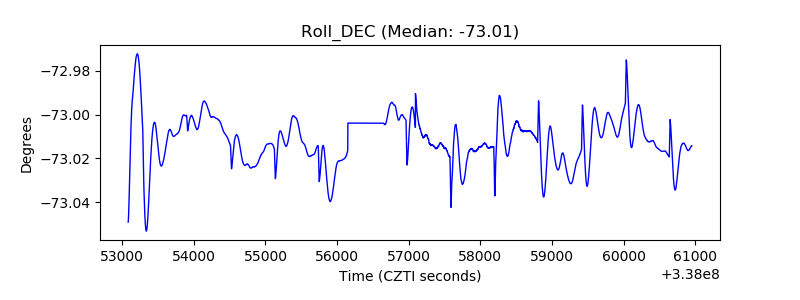 |
| _Roll_RA |  |
| Veto Counter | 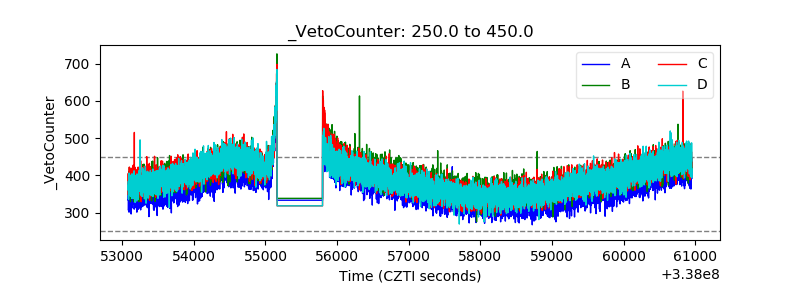 |