| Param | Original file | Final file |
|---|---|---|
| Filename | modeM0/AS1A09_038T11_9000003878cztM0_level2.fits | modeM0/AS1A09_038T11_9000003878cztM0_level2_quad_clean.evt |
| Size (bytes) | 38,649,600 | 27,218,880 |
| Size | 36.9 MB | 26.0 MB |
| Events in quadrant A | 223,956 | 128,437 |
| Events in quadrant B | 225,526 | 141,488 |
| Events in quadrant C | 227,964 | 134,747 |
| Events in quadrant D | 198,362 | 123,762 |
| Mode SS | |||
|---|---|---|---|
| Quadrant | BADHDUFLAG | Total packets | Discarded packets |
| A | 0 | 84 | 0 |
| B | 0 | 84 | 0 |
| C | 0 | 84 | 0 |
| D | 0 | 84 | 0 |
| Mode M0 | |||
|---|---|---|---|
| Quadrant | BADHDUFLAG | Total packets | Discarded packets |
| A | 0 | 14277 | 0 |
| B | 0 | 9600 | 0 |
| C | 0 | 8467 | 0 |
| D | 0 | 10653 | 0 |
| Mode M9 | |||
|---|---|---|---|
| Quadrant | BADHDUFLAG | Total packets | Discarded packets |
| A | 0 | 8 | 0 |
| B | 0 | 8 | 0 |
| C | 0 | 8 | 0 |
| D | 0 | 8 | 0 |
| Quadrant | Total seconds | Saturated seconds | Saturation percentage |
|---|---|---|---|
| A | 4189 | 244 | 5.824779% |
| B | 4189 | 62 | 1.480067% |
| C | 4189 | 30 | 0.716161% |
| D | 4189 | 86 | 2.052996% |
Noise dominated data is calculated using 1-second bins in cleaned event files. If a bin has >2000 counts, and if more than 50% of those come from <1% of pixels, then it is considered to be noise-dominated and hence unusable.
| Quadrant | # 1 sec bins | Bins with >0 counts | Bins with >2000 counts | High rate bins dominated by noise | Noise dominated (total time) | Noise dominated (detector-on time) | Marked lightcurve |
|---|---|---|---|---|---|---|---|
| A | 4979 | 4188 | 0 | 0 | 0.00% | 0.00% |  |
| B | 4979 | 4188 | 0 | 0 | 0.00% | 0.00% |  |
| C | 4979 | 4189 | 0 | 0 | 0.00% | 0.00% |  |
| D | 4979 | 4188 | 0 | 0 | 0.00% | 0.00% |  |
Top three noisy pixels from each quadrant. If the there are fewer than three noisy pixels in the level2.evt file, extra rows are filled as -1
| Pixel properties | Quadrant properties | ||||||
|---|---|---|---|---|---|---|---|
| Quadrant | DetID | PixID | Counts | Sigma | Mean | Median | Sigma |
| A | 0 | 29 | 196 | 8.75 | 58 | 55 | 16.1 |
| A | 14 | 79 | 178 | 7.63 | 58 | 55 | 16.1 |
| A | 0 | 30 | 177 | 7.57 | 58 | 55 | 16.1 |
| B | 2 | 9 | 195 | 9.83 | 59 | 57 | 14.0 |
| B | 2 | 8 | 163 | 7.55 | 59 | 57 | 14.0 |
| B | 3 | 17 | 161 | 7.41 | 59 | 57 | 14.0 |
| C | 12 | 241 | 170 | 6.67 | 60 | 56 | 17.1 |
| C | 12 | 242 | 164 | 6.32 | 60 | 56 | 17.1 |
| C | 1 | 65 | 159 | 6.02 | 60 | 56 | 17.1 |
| D | 6 | 231 | 160 | 6.46 | 56 | 51 | 16.9 |
| D | 3 | 31 | 155 | 6.17 | 56 | 51 | 16.9 |
| D | 1 | 3 | 153 | 6.05 | 56 | 51 | 16.9 |
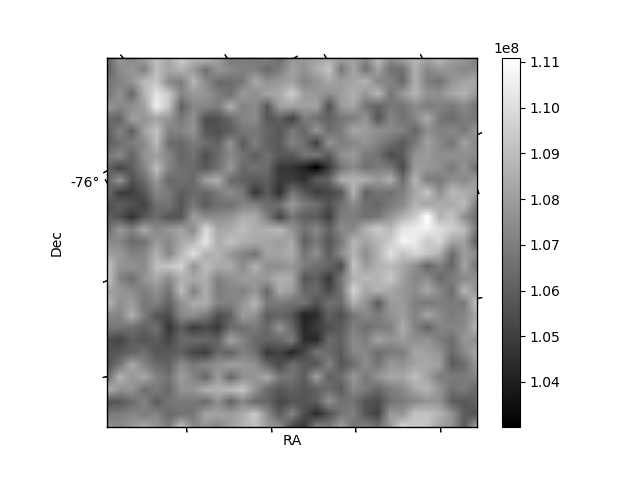
Histogram calculated using DETX and DETY for each event in the final _common_clean file
| Quadrant A | 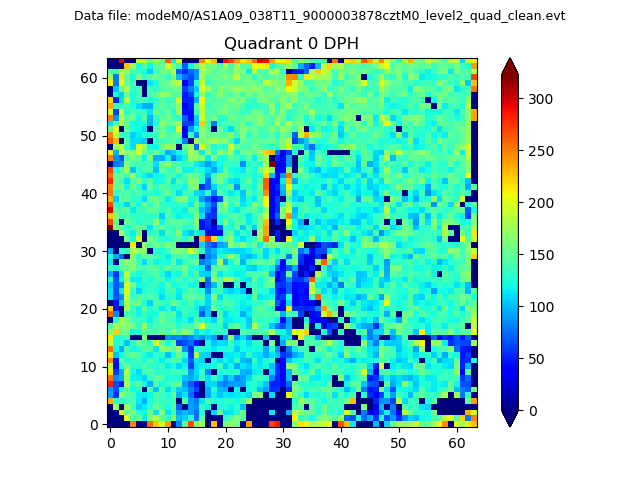 |
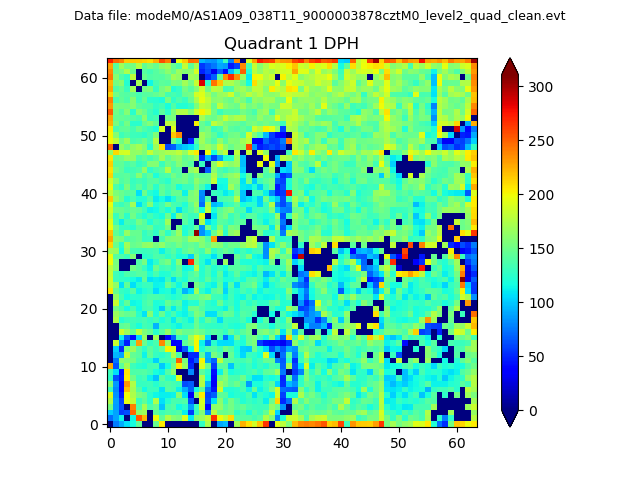 |
Quadrant B |
|---|---|---|---|
| Quadrant D |  |
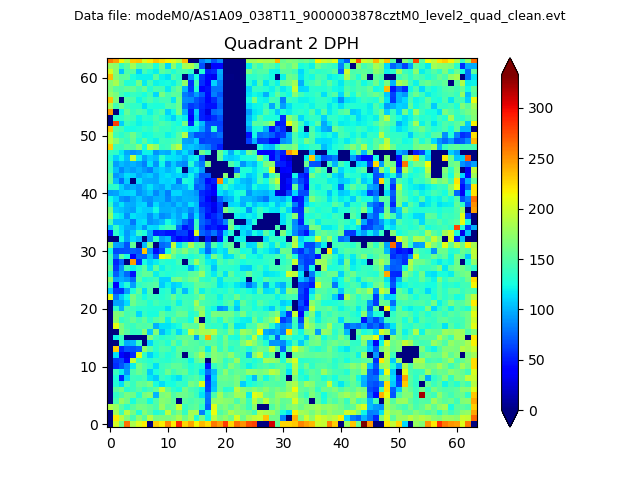 |
Quadrant C |
| Plot type | Count rate plots | Images |
|---|---|---|
| Comparison with Poisson distribution Blue bars denote a histogram of data divided into 1 sec bins. Red curve is a Poisson curve with rate = median count rate of data. |
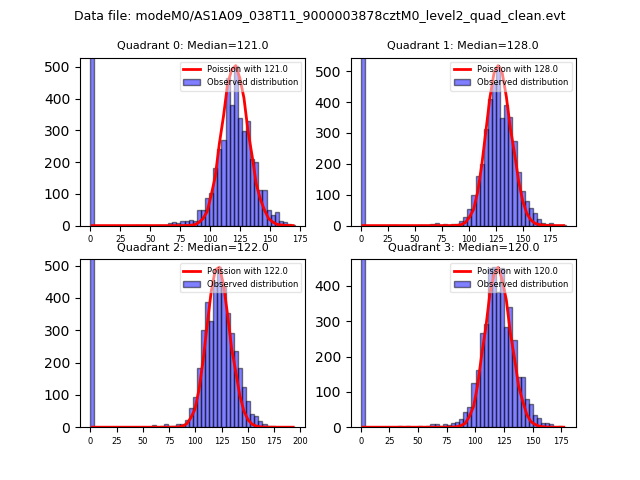 |
 |
| Quadrant-wise count rates Data is divided into 100 sec bins |
 |
|
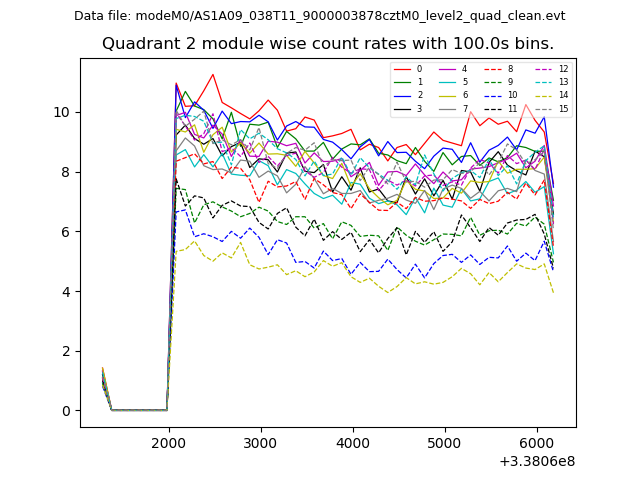
| Module-wise count rates for Quadrant A Data is divided into 100 sec bins |
 |
 |
| Module-wise count rates for Quadrant B Data is divided into 100 sec bins |
 |
 |
| Module-wise count rates for Quadrant C Data is divided into 100 sec bins |
 |
 |
| Module-wise count rates for Quadrant D Data is divided into 100 sec bins |
 |
 |
| Parameter | Plot |
|---|---|
| CZT HV Monitor |  |
| D_VDD |  |
| Temperature 1 |  |
| Veto HV Monitor | 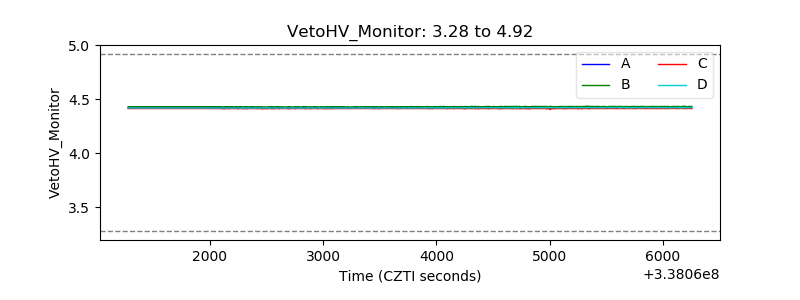 |
| Veto LLD |  |
| Alpha Counter |  |
| _CPM_Rate |  |
| CZT Counter |  |
| +2.5 Volts monitor |  |
| +5 Volts monitor |  |
| _ROLL_ROT |  |
| _Roll_DEC |  |
| _Roll_RA | 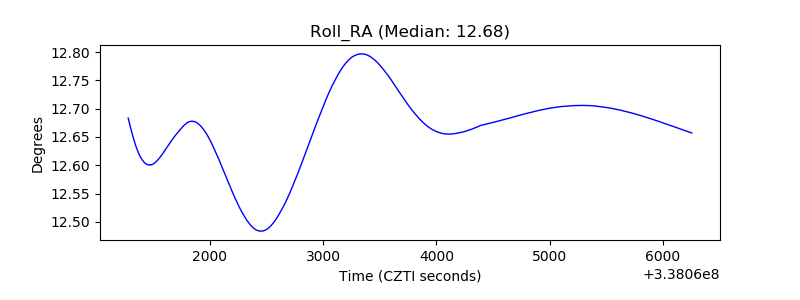 |
| Veto Counter |  |