| Param | Original file | Final file |
|---|---|---|
| Filename | modeM0/AS1A09_038T11_9000003878_26888cztM0_level2.evt | modeM0/AS1A09_038T11_9000003878_26888cztM0_level2_quad_clean.evt |
| Size (bytes) | 162,599,040 | 30,957,120 |
| Size | 155.1 MB | 29.5 MB |
| Events in quadrant A | 1,693,836 | 197,922 |
| Events in quadrant B | 1,073,799 | 213,470 |
| Events in quadrant C | 768,574 | 208,743 |
| Events in quadrant D | 1,278,206 | 199,788 |
| Mode M0 | |||
|---|---|---|---|
| Quadrant | BADHDUFLAG | Total packets | Discarded packets |
| A | 0 | 6176 | 0 |
| B | 0 | 4262 | 0 |
| C | 0 | 3267 | 0 |
| D | 0 | 4910 | 0 |
| Mode M9 | |||
|---|---|---|---|
| Quadrant | BADHDUFLAG | Total packets | Discarded packets |
| A | 0 | 8 | 0 |
| B | 0 | 8 | 0 |
| C | 0 | 8 | 0 |
| D | 0 | 8 | 0 |
| Quadrant | Total seconds | Saturated seconds | Saturation percentage |
|---|---|---|---|
| A | 1592 | 213 | 13.379397% |
| B | 1592 | 57 | 3.580402% |
| C | 1592 | 21 | 1.319095% |
| D | 1592 | 70 | 4.396985% |
Noise dominated data is calculated using 1-second bins in cleaned event files. If a bin has >2000 counts, and if more than 50% of those come from <1% of pixels, then it is considered to be noise-dominated and hence unusable.
| Quadrant | # 1 sec bins | Bins with >0 counts | Bins with >2000 counts | High rate bins dominated by noise | Noise dominated (total time) | Noise dominated (detector-on time) | Marked lightcurve |
|---|---|---|---|---|---|---|---|
| A | 2382 | 1592 | 130 | 130 | 5.46% | 8.17% | 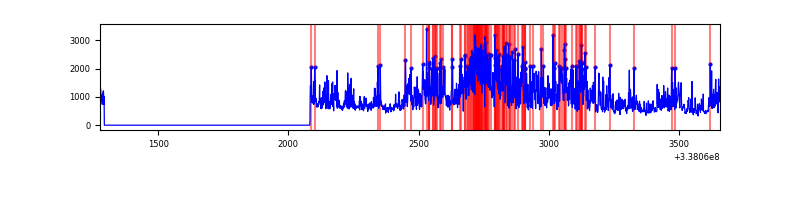 |
| B | 2382 | 1593 | 6 | 6 | 0.25% | 0.38% | 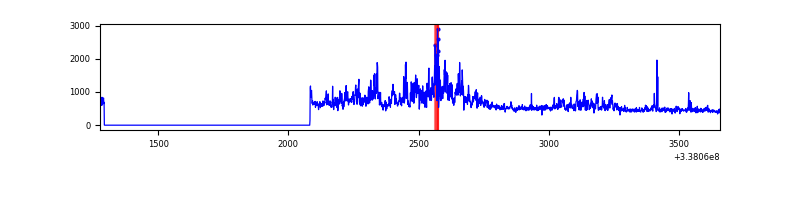 |
| C | 2382 | 1593 | 0 | 0 | 0.00% | 0.00% | 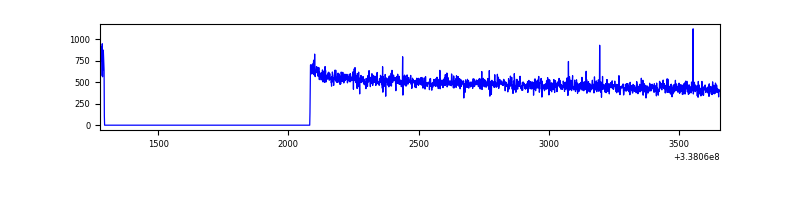 |
| D | 2382 | 1592 | 42 | 42 | 1.76% | 2.64% | 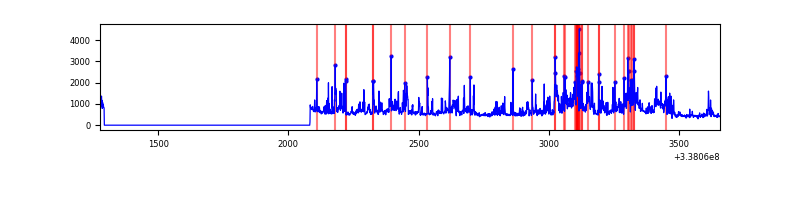 |
Top three noisy pixels from each quadrant. If the there are fewer than three noisy pixels in the level2.evt file, extra rows are filled as -1
| Pixel properties | Quadrant properties | ||||||
|---|---|---|---|---|---|---|---|
| Quadrant | DetID | PixID | Counts | Sigma | Mean | Median | Sigma |
| A | 0 | 13 | 736389 | 17856.33 | 195 | 192 | 41.2 |
| A | 6 | 16 | 189413 | 4589.52 | 195 | 192 | 41.2 |
| A | 7 | 192 | 9315 | 221.28 | 195 | 192 | 41.2 |
| B | 0 | 190 | 238379 | 5830.67 | 200 | 195 | 40.9 |
| B | 10 | 246 | 36057 | 877.89 | 200 | 195 | 40.9 |
| B | 15 | 33 | 7434 | 177.21 | 200 | 195 | 40.9 |
| C | 14 | 238 | 31173 | 681.85 | 187 | 187 | 45.4 |
| C | 3 | 233 | 3891 | 81.51 | 187 | 187 | 45.4 |
| C | 15 | 208 | 1916 | 38.05 | 187 | 187 | 45.4 |
| D | 1 | 52 | 392358 | 8507.23 | 187 | 183 | 46.1 |
| D | 2 | 250 | 83469 | 1806.68 | 187 | 183 | 46.1 |
| D | 12 | 233 | 65503 | 1416.95 | 187 | 183 | 46.1 |
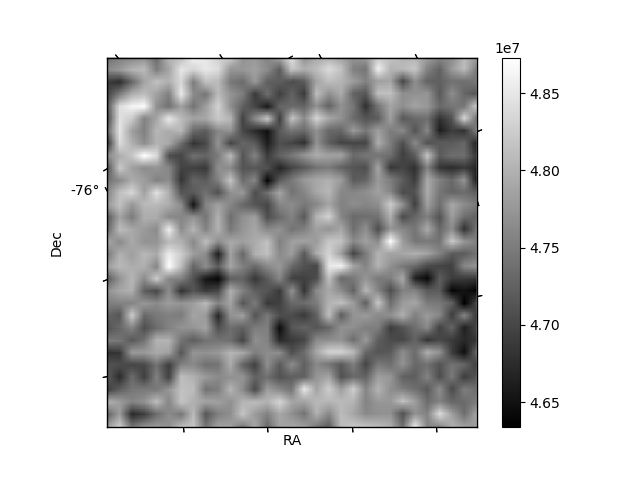
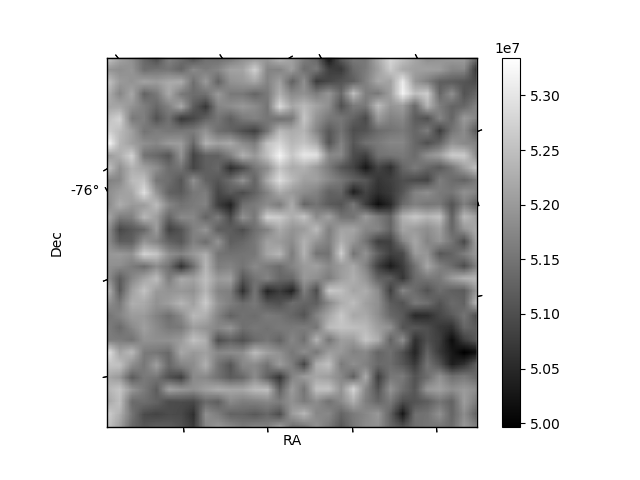
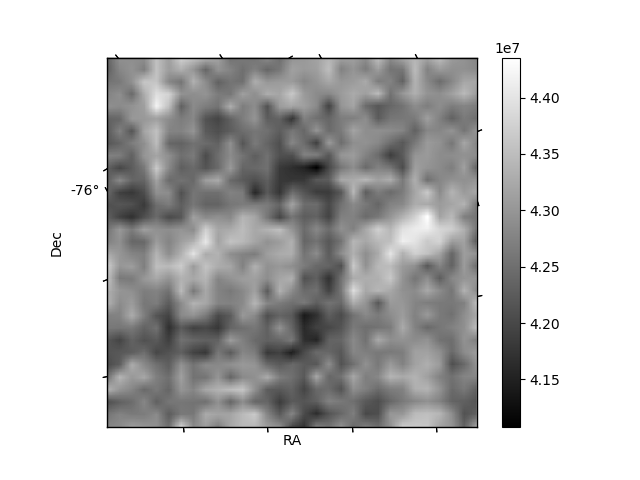
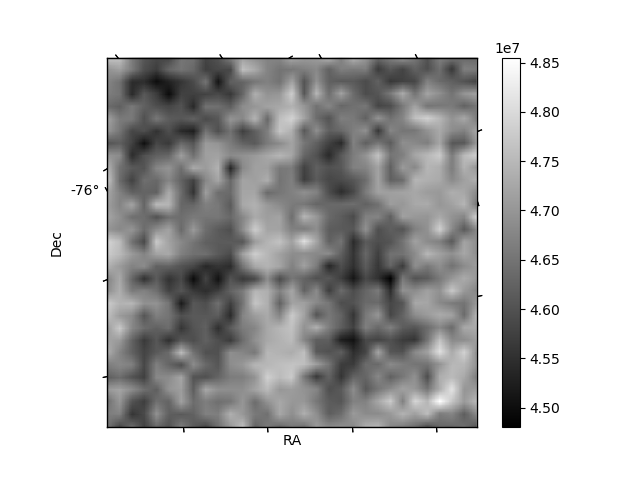
Histogram calculated using DETX and DETY for each event in the final _common_clean file
| Quadrant A | 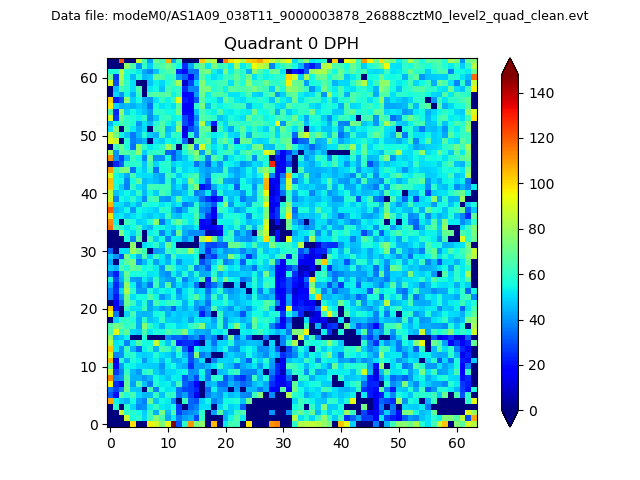 |
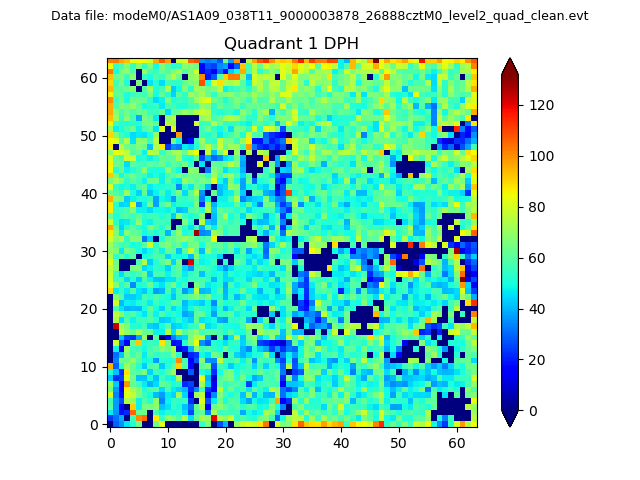 |
Quadrant B |
|---|---|---|---|
| Quadrant D | 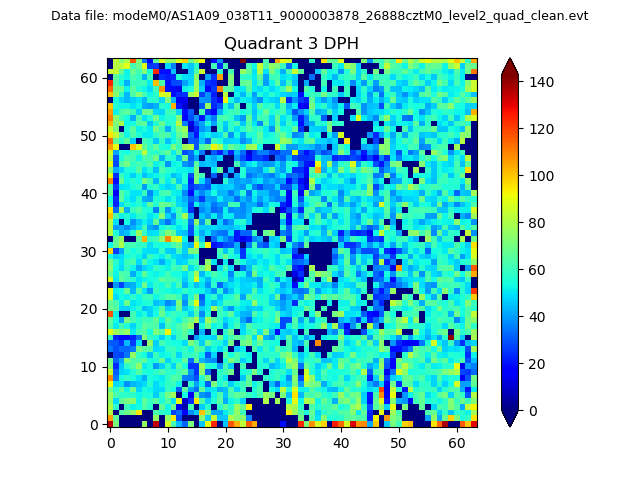 |
 |
Quadrant C |
| Plot type | Count rate plots | Images |
|---|---|---|
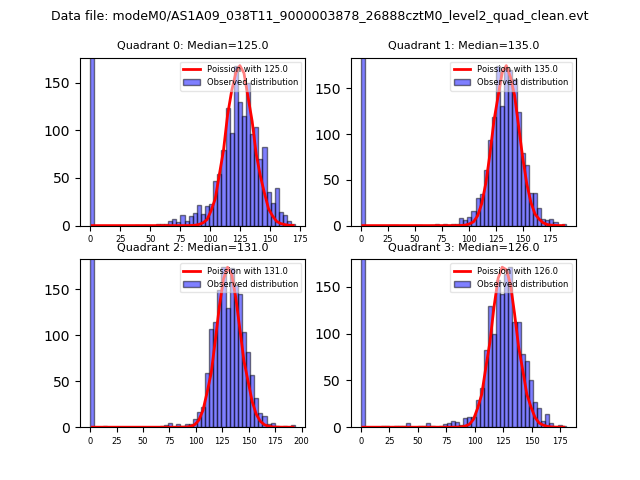
| Comparison with Poisson distribution Blue bars denote a histogram of data divided into 1 sec bins. Red curve is a Poisson curve with rate = median count rate of data. |
 |
 |
| Quadrant-wise count rates Data is divided into 100 sec bins |
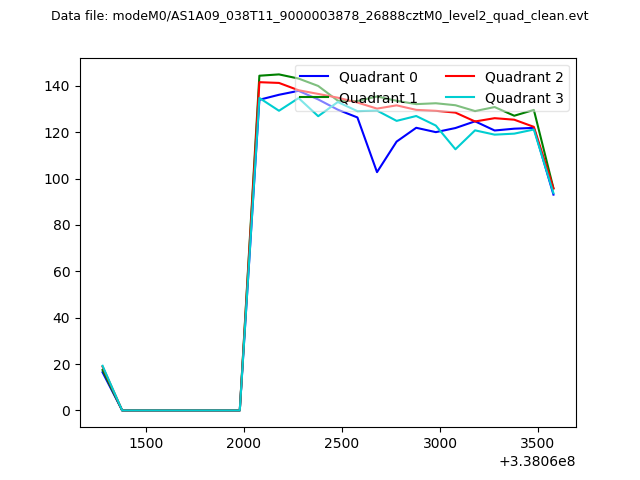 |
|
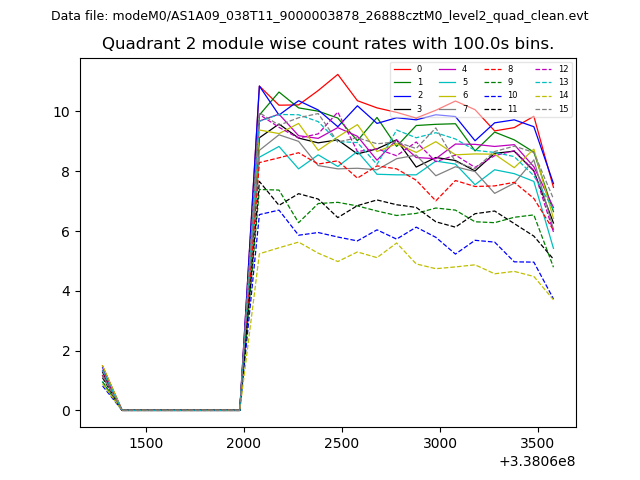
| Module-wise count rates for Quadrant A Data is divided into 100 sec bins |
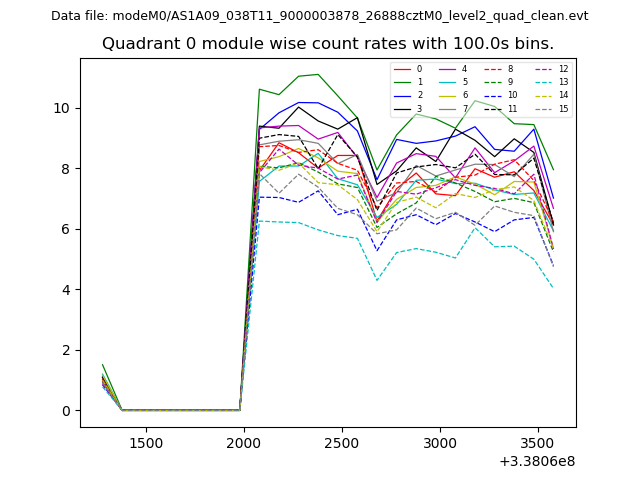 |
 |
| Module-wise count rates for Quadrant B Data is divided into 100 sec bins |
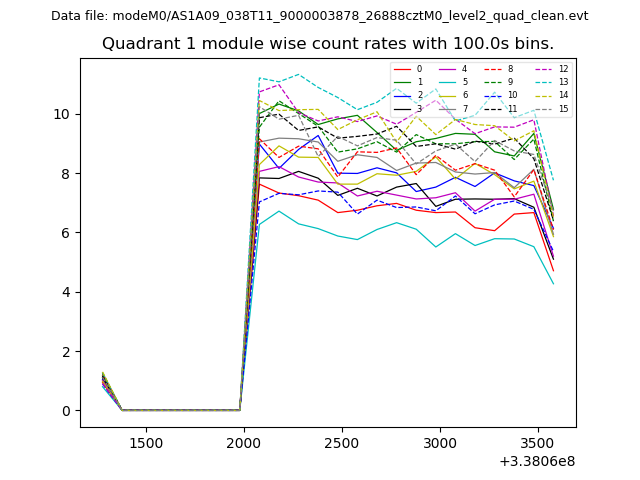 |
 |
| Module-wise count rates for Quadrant C Data is divided into 100 sec bins |
 |
 |
| Module-wise count rates for Quadrant D Data is divided into 100 sec bins |
 |
 |
| Parameter | Plot |
|---|---|
| CZT HV Monitor | 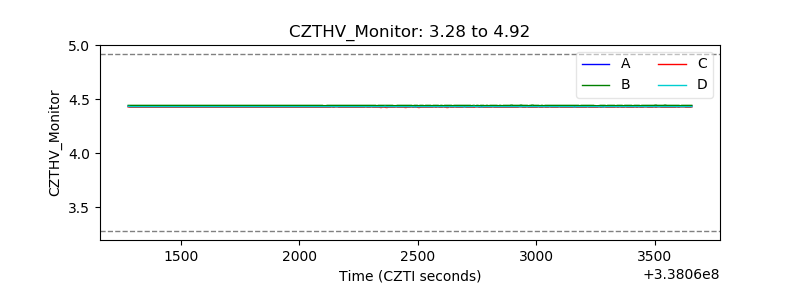 |
| D_VDD | 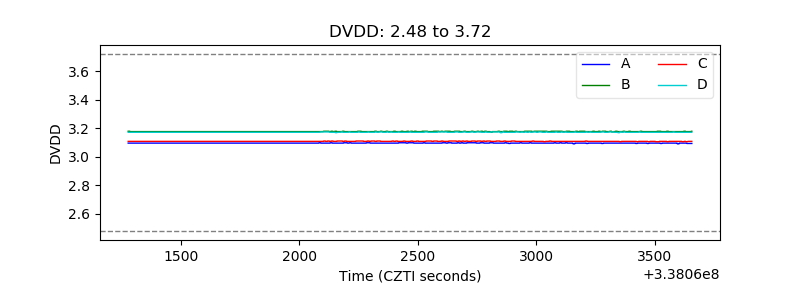 |
| Temperature 1 | 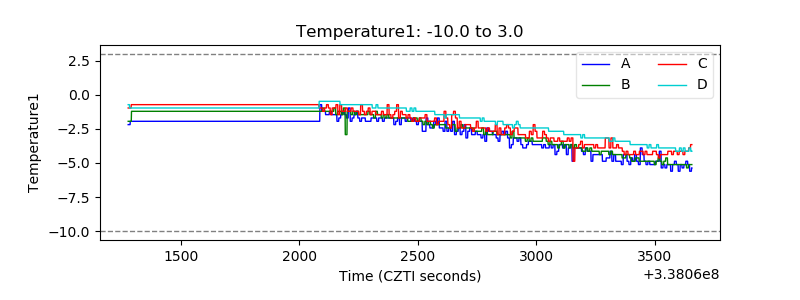 |
| Veto HV Monitor | 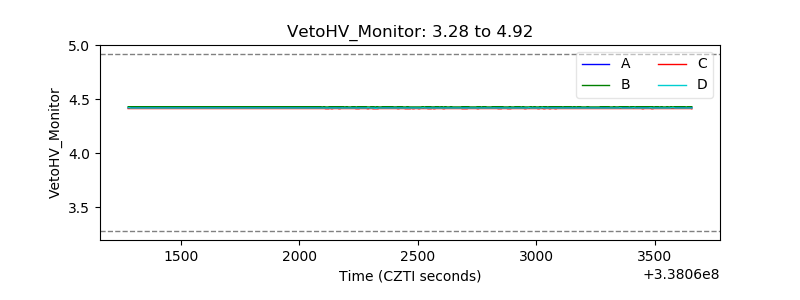 |
| Veto LLD | 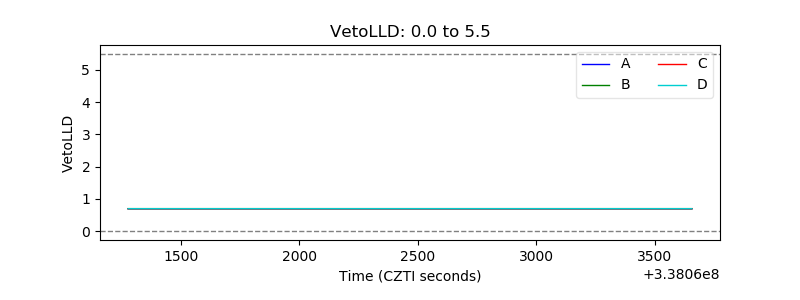 |
| Alpha Counter | 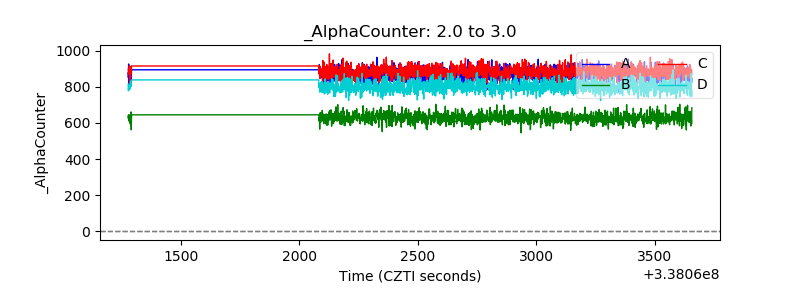 |
| _CPM_Rate | 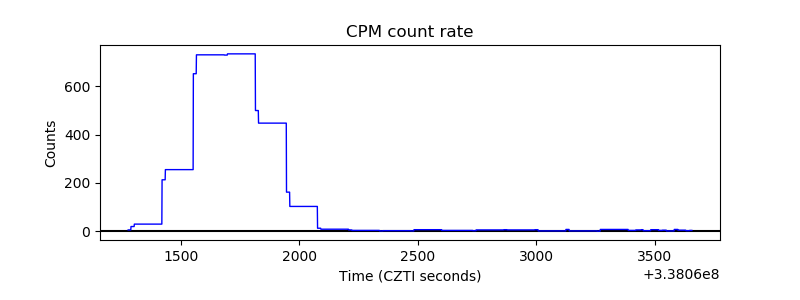 |
| CZT Counter |  |
| +2.5 Volts monitor |  |
| +5 Volts monitor |  |
| _ROLL_ROT |  |
| _Roll_DEC | 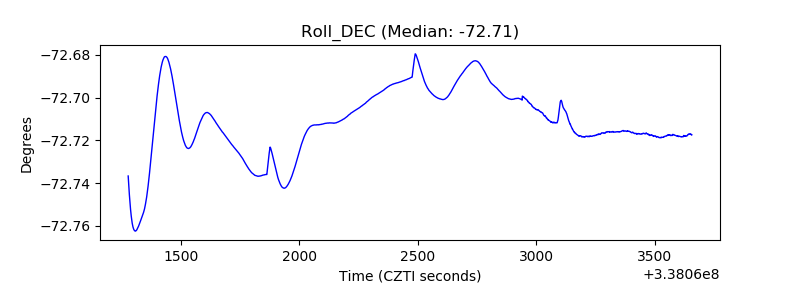 |
| _Roll_RA |  |
| Veto Counter | 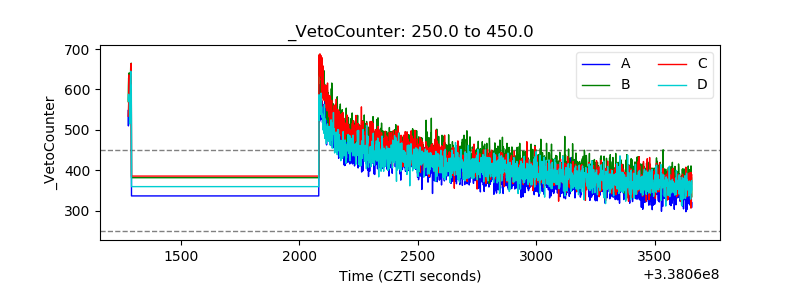 |