| Param | Original file | Final file |
|---|---|---|
| Filename | modeM0/AS1A09_038T11_9000003878_26889cztM0_level2.evt | modeM0/AS1A09_038T11_9000003878_26889cztM0_level2_quad_clean.evt |
| Size (bytes) | 353,050,560 | 77,359,680 |
| Size | 336.7 MB | 73.8 MB |
| Events in quadrant A | 3,792,831 | 504,373 |
| Events in quadrant B | 2,215,232 | 534,029 |
| Events in quadrant C | 1,861,228 | 512,281 |
| Events in quadrant D | 2,539,225 | 498,300 |
| Mode M0 | |||
|---|---|---|---|
| Quadrant | BADHDUFLAG | Total packets | Discarded packets |
| A | 0 | 14214 | 0 |
| B | 0 | 9550 | 0 |
| C | 0 | 8418 | 0 |
| D | 0 | 10590 | 0 |
| Mode M9 | |||
|---|---|---|---|
| Quadrant | BADHDUFLAG | Total packets | Discarded packets |
| A | 0 | 4 | 0 |
| B | 0 | 5 | 0 |
| C | 0 | 5 | 0 |
| D | 0 | 5 | 0 |
| Quadrant | Total seconds | Saturated seconds | Saturation percentage |
|---|---|---|---|
| A | 4172 | 227 | 5.441035% |
| B | 4172 | 47 | 1.126558% |
| C | 4172 | 18 | 0.431448% |
| D | 4172 | 72 | 1.725791% |
Noise dominated data is calculated using 1-second bins in cleaned event files. If a bin has >2000 counts, and if more than 50% of those come from <1% of pixels, then it is considered to be noise-dominated and hence unusable.
| Quadrant | # 1 sec bins | Bins with >0 counts | Bins with >2000 counts | High rate bins dominated by noise | Noise dominated (total time) | Noise dominated (detector-on time) | Marked lightcurve |
|---|---|---|---|---|---|---|---|
| A | 4172 | 4172 | 174 | 174 | 4.17% | 4.17% | 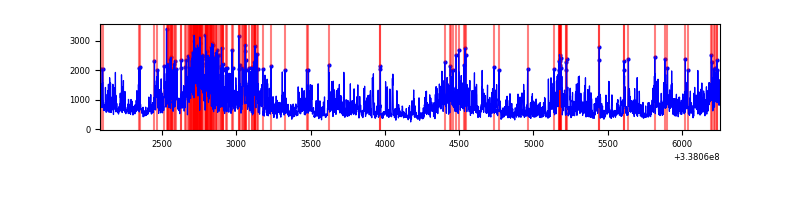 |
| B | 4172 | 4172 | 7 | 7 | 0.17% | 0.17% | 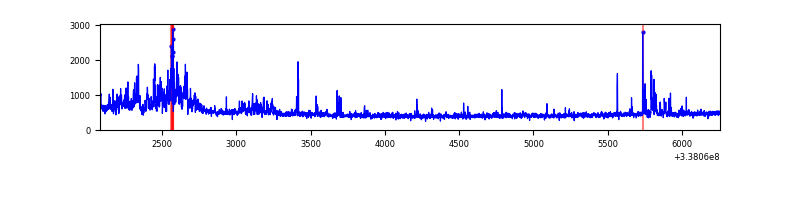 |
| C | 4172 | 4172 | 0 | 0 | 0.00% | 0.00% | 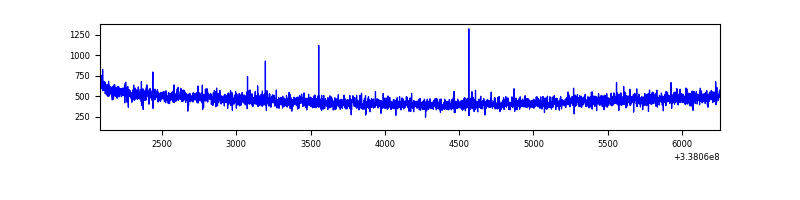 |
| D | 4172 | 4172 | 59 | 59 | 1.41% | 1.41% | 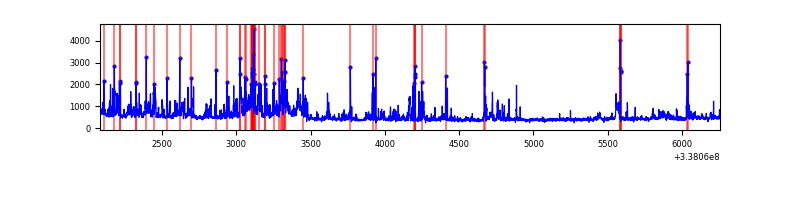 |
Top three noisy pixels from each quadrant. If the there are fewer than three noisy pixels in the level2.evt file, extra rows are filled as -1
| Pixel properties | Quadrant properties | ||||||
|---|---|---|---|---|---|---|---|
| Quadrant | DetID | PixID | Counts | Sigma | Mean | Median | Sigma |
| A | 0 | 13 | 1381030 | 14468.51 | 466 | 457 | 95.4 |
| A | 6 | 16 | 597523 | 6257.3 | 466 | 457 | 95.4 |
| A | 7 | 192 | 9653 | 96.37 | 466 | 457 | 95.4 |
| B | 0 | 190 | 238578 | 2595.59 | 476 | 463 | 91.7 |
| B | 3 | 64 | 49278 | 532.11 | 476 | 463 | 91.7 |
| B | 10 | 246 | 47486 | 512.58 | 476 | 463 | 91.7 |
| C | 14 | 238 | 74964 | 690.49 | 456 | 459 | 107.9 |
| C | 3 | 233 | 4919 | 41.33 | 456 | 459 | 107.9 |
| C | 13 | 61 | 3141 | 24.86 | 456 | 459 | 107.9 |
| D | 1 | 52 | 475771 | 4475.4 | 450 | 441 | 106.2 |
| D | 2 | 250 | 141070 | 1324.07 | 450 | 441 | 106.2 |
| D | 11 | 176 | 108488 | 1017.3 | 450 | 441 | 106.2 |
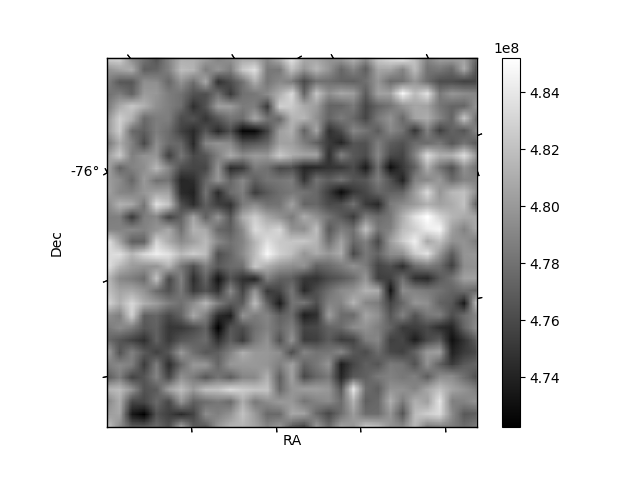
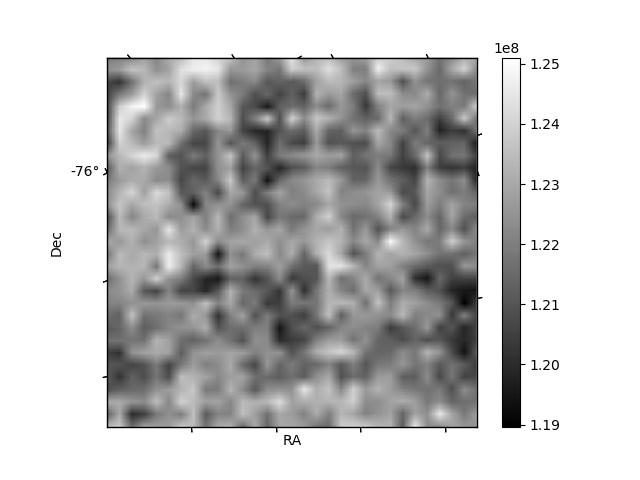
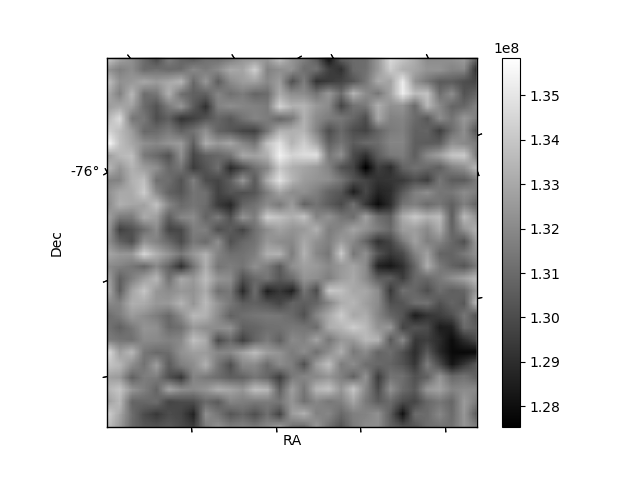
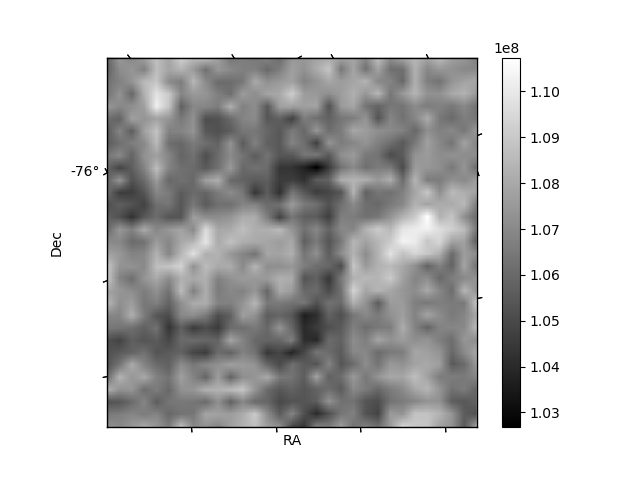
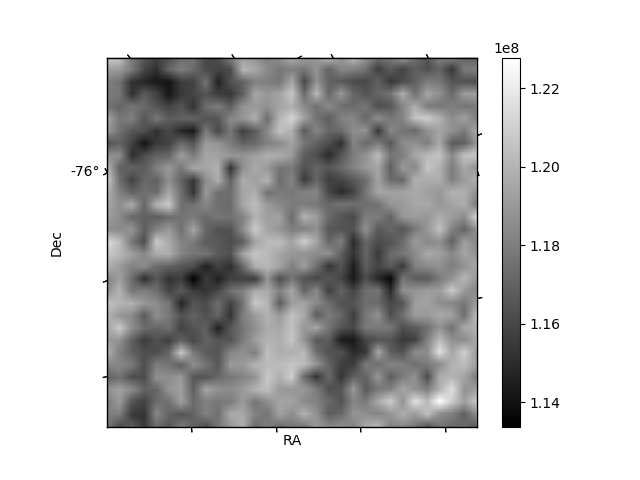
Histogram calculated using DETX and DETY for each event in the final _common_clean file
| Quadrant A | 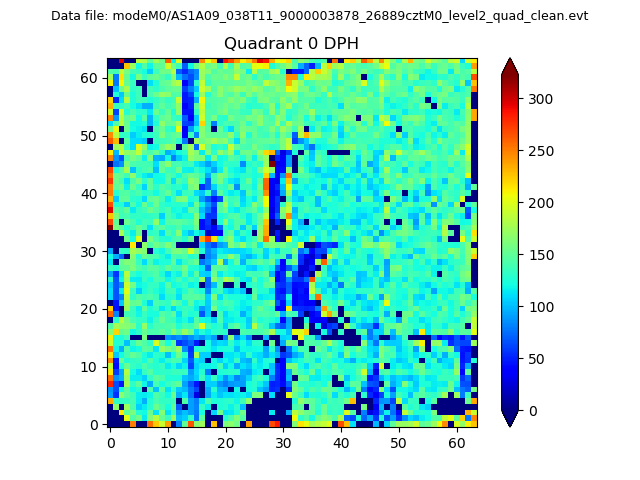 |
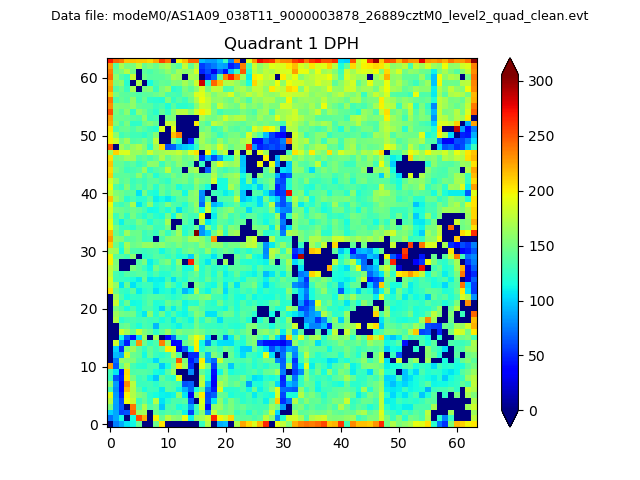 |
Quadrant B |
|---|---|---|---|
| Quadrant D |  |
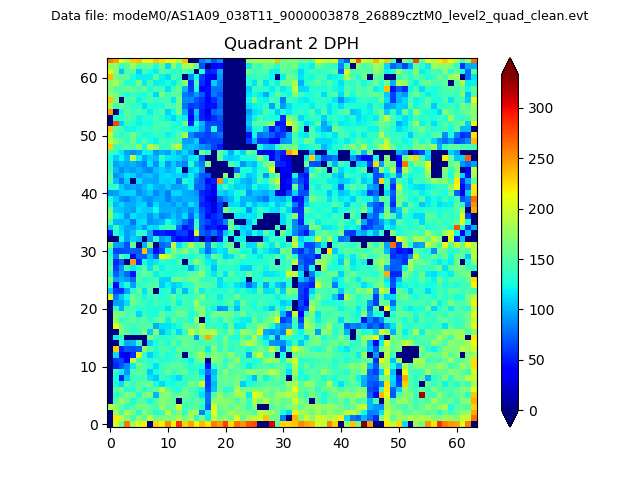 |
Quadrant C |
| Plot type | Count rate plots | Images |
|---|---|---|
| Comparison with Poisson distribution Blue bars denote a histogram of data divided into 1 sec bins. Red curve is a Poisson curve with rate = median count rate of data. |
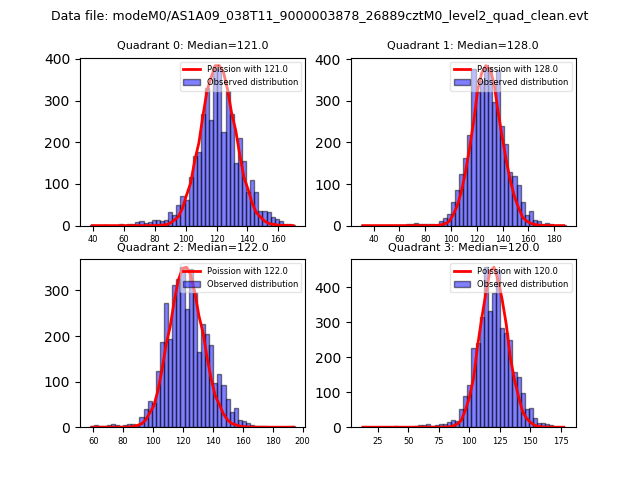 |
 |
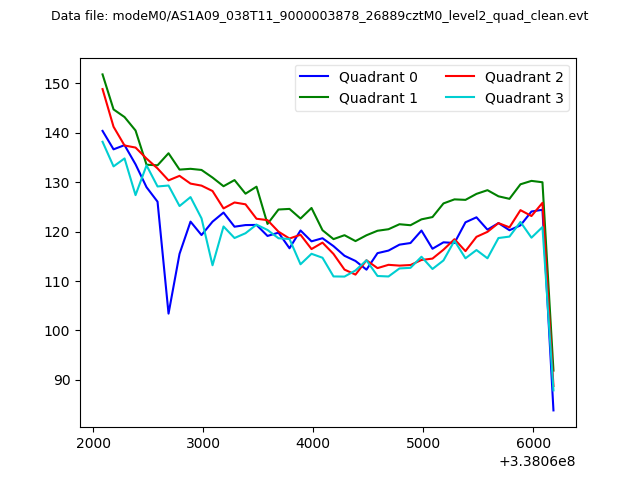
| Quadrant-wise count rates Data is divided into 100 sec bins |
 |
|
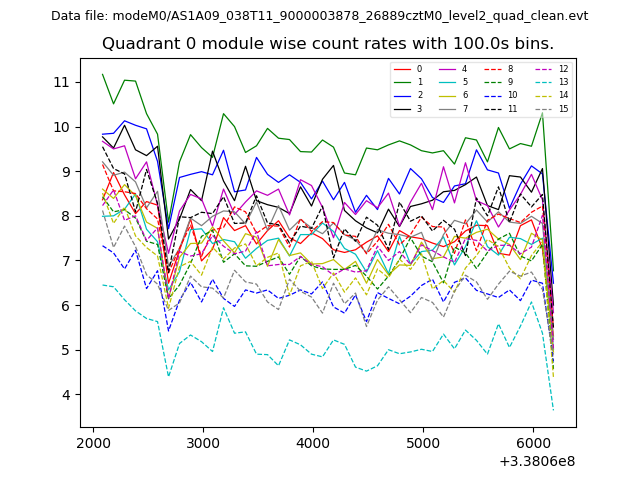
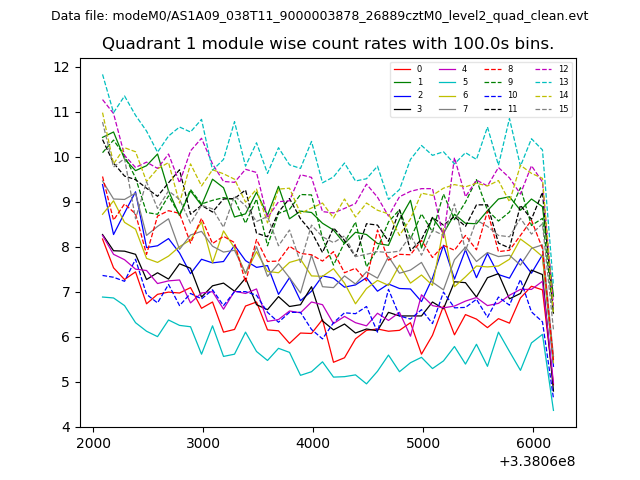
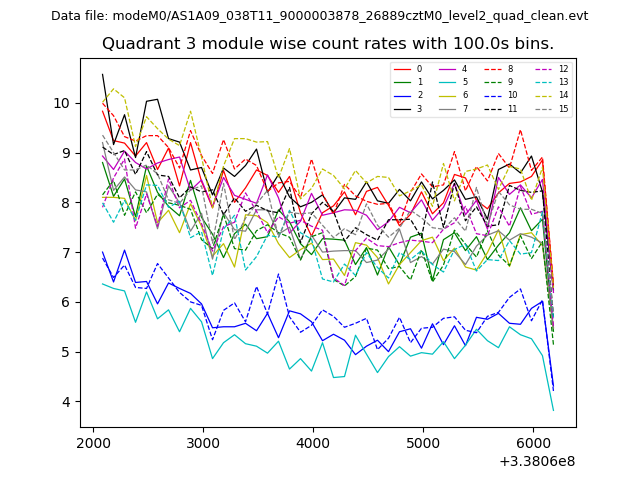
| Module-wise count rates for Quadrant A Data is divided into 100 sec bins |
 |
 |
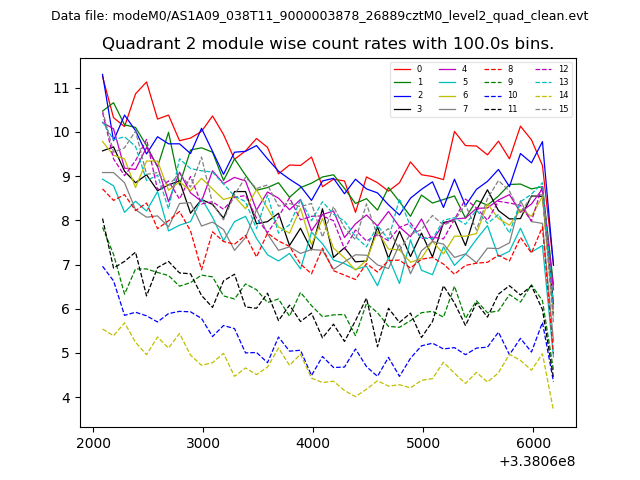
| Module-wise count rates for Quadrant B Data is divided into 100 sec bins |
 |
 |
| Module-wise count rates for Quadrant C Data is divided into 100 sec bins |
 |
 |
| Module-wise count rates for Quadrant D Data is divided into 100 sec bins |
 |
 |
| Parameter | Plot |
|---|---|
| CZT HV Monitor | 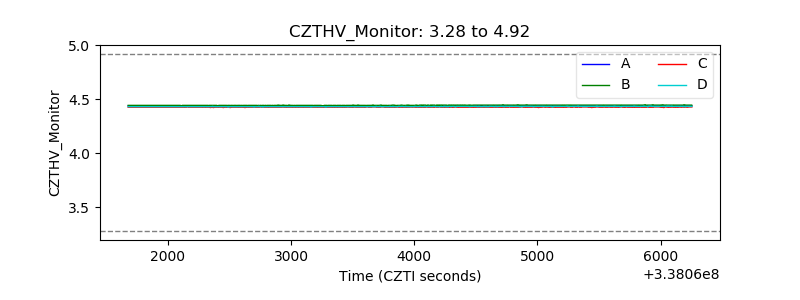 |
| D_VDD | 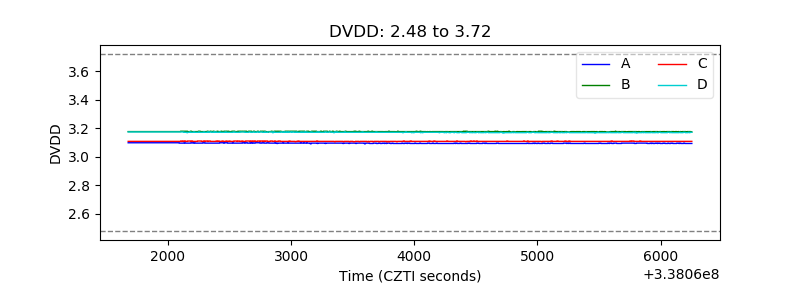 |
| Temperature 1 | 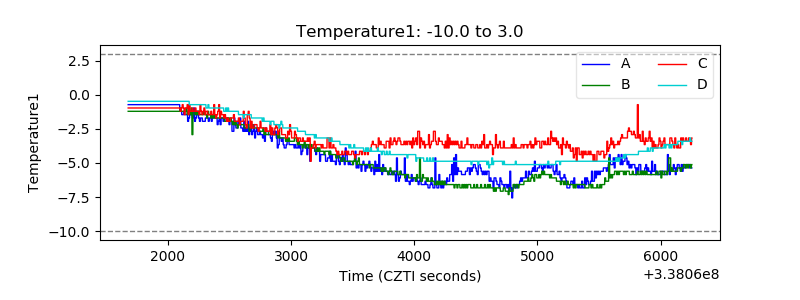 |
| Veto HV Monitor |  |
| Veto LLD | 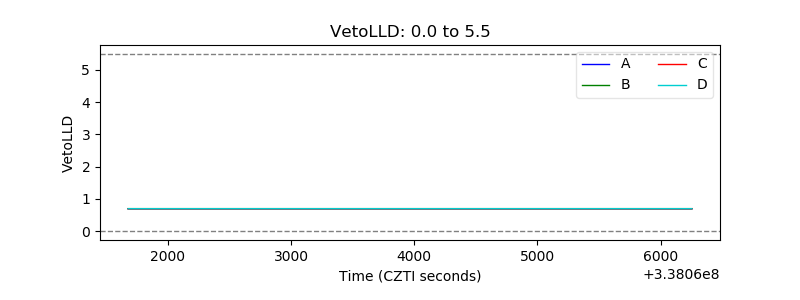 |
| Alpha Counter | 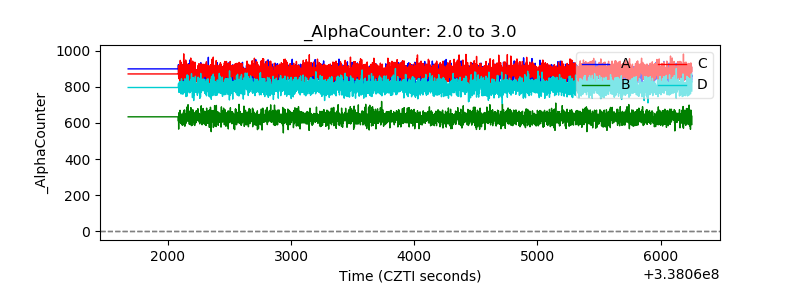 |
| _CPM_Rate | 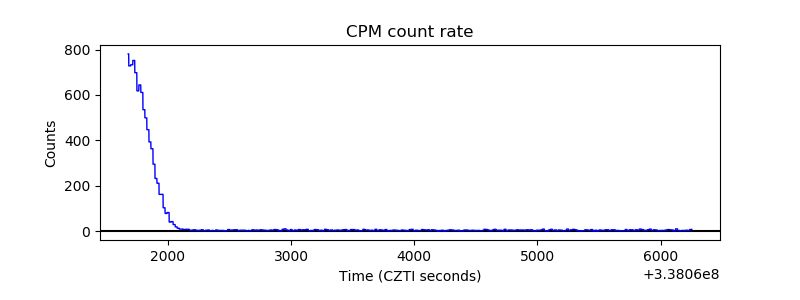 |
| CZT Counter |  |
| +2.5 Volts monitor |  |
| +5 Volts monitor |  |
| _ROLL_ROT | 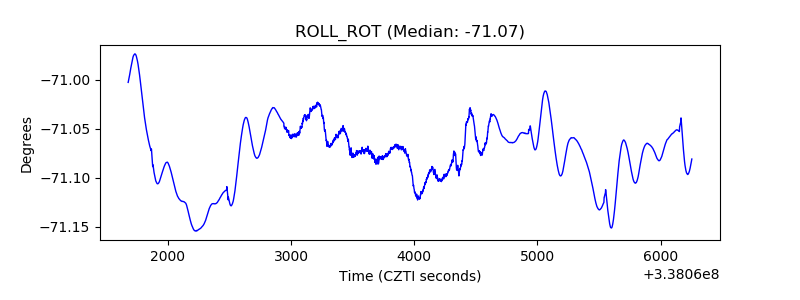 |
| _Roll_DEC |  |
| _Roll_RA | 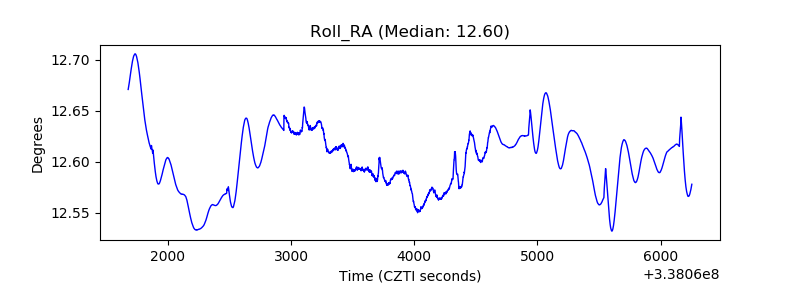 |
| Veto Counter | 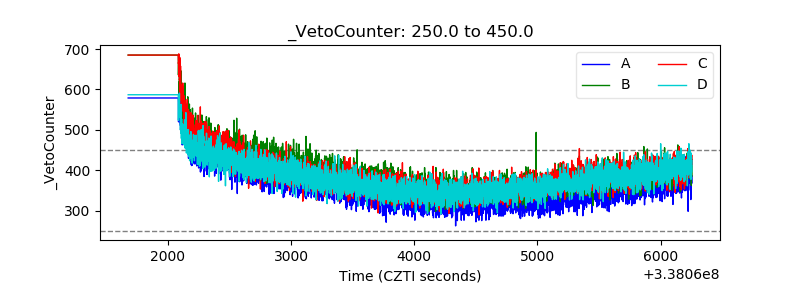 |