| Param | Original file | Final file |
|---|---|---|
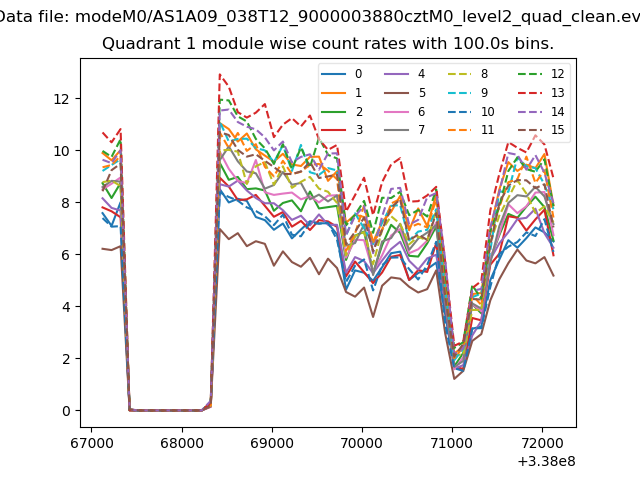
| Filename | modeM0/AS1A09_038T12_9000003880cztM0_level2.fits | modeM0/AS1A09_038T12_9000003880cztM0_level2_quad_clean.evt |
| Size (bytes) | 46,860,480 | 51,128,640 |
| Size | 44.7 MB | 48.8 MB |
| Events in quadrant A | 283,250 | 328,737 |
| Events in quadrant B | 256,082 | 260,318 |
| Events in quadrant C | 289,940 | 321,064 |
| Events in quadrant D | 240,194 | 288,325 |
| Mode M9 | |||
|---|---|---|---|
| Quadrant | BADHDUFLAG | Total packets | Discarded packets |
| A | 0 | 10 | 0 |
| B | 0 | 10 | 0 |
| C | 0 | 10 | 0 |
| D | 0 | 10 | 0 |
| Mode M0 | |||
|---|---|---|---|
| Quadrant | BADHDUFLAG | Total packets | Discarded packets |
| A | 0 | 15292 | 0 |
| B | 0 | 17777 | 0 |
| C | 0 | 10224 | 0 |
| D | 0 | 15391 | 0 |
| Mode SS | |||
|---|---|---|---|
| Quadrant | BADHDUFLAG | Total packets | Discarded packets |
| A | 0 | 100 | 0 |
| B | 0 | 100 | 0 |
| C | 0 | 100 | 0 |
| D | 0 | 100 | 0 |
| Quadrant | Total seconds | Saturated seconds | Saturation percentage |
|---|---|---|---|
| A | 4984 | 263 | 5.276886% |
| B | 4984 | 907 | 18.198234% |
| C | 4984 | 38 | 0.762440% |
| D | 4984 | 407 | 8.166132% |
Noise dominated data is calculated using 1-second bins in cleaned event files. If a bin has >2000 counts, and if more than 50% of those come from <1% of pixels, then it is considered to be noise-dominated and hence unusable.
| Quadrant | # 1 sec bins | Bins with >0 counts | Bins with >2000 counts | High rate bins dominated by noise | Noise dominated (total time) | Noise dominated (detector-on time) | Marked lightcurve |
|---|---|---|---|---|---|---|---|
| A | 5979 | 4984 | 0 | 0 | 0.00% | 0.00% | 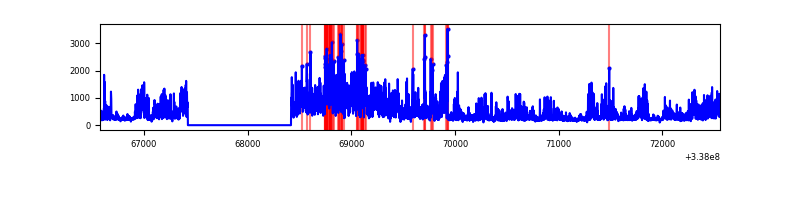 |
| B | 5979 | 4957 | 0 | 0 | 0.00% | 0.00% | 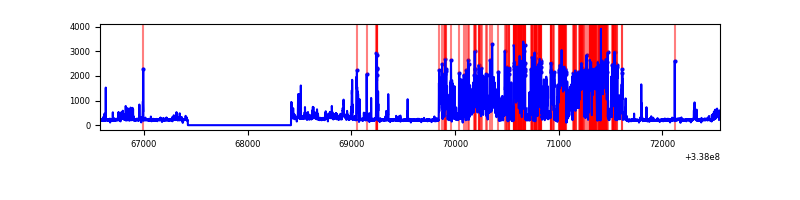 |
| C | 5979 | 4983 | 0 | 0 | 0.00% | 0.00% | 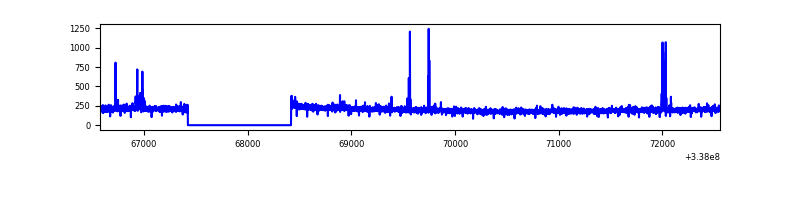 |
| D | 5979 | 4979 | 0 | 0 | 0.00% | 0.00% | 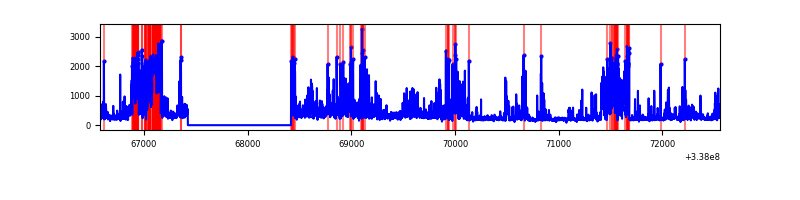 |
Top three noisy pixels from each quadrant. If the there are fewer than three noisy pixels in the level2.evt file, extra rows are filled as -1
| Pixel properties | Quadrant properties | ||||||
|---|---|---|---|---|---|---|---|
| Quadrant | DetID | PixID | Counts | Sigma | Mean | Median | Sigma |
| A | 0 | 29 | 243 | 8.6 | 73 | 69 | 20.2 |
| A | 0 | 30 | 217 | 7.32 | 73 | 69 | 20.2 |
| A | 9 | 19 | 214 | 7.17 | 73 | 69 | 20.2 |
| B | 2 | 9 | 220 | 10.01 | 67 | 64 | 15.6 |
| B | 2 | 8 | 190 | 8.09 | 67 | 64 | 15.6 |
| B | 4 | 146 | 168 | 6.67 | 67 | 64 | 15.6 |
| C | 1 | 81 | 227 | 7.14 | 76 | 72 | 21.7 |
| C | 1 | 80 | 220 | 6.81 | 76 | 72 | 21.7 |
| C | 7 | 111 | 212 | 6.44 | 76 | 72 | 21.7 |
| D | 6 | 231 | 185 | 6.27 | 68 | 62 | 19.6 |
| D | 4 | 246 | 185 | 6.27 | 68 | 62 | 19.6 |
| D | 6 | 62 | 180 | 6.02 | 68 | 62 | 19.6 |
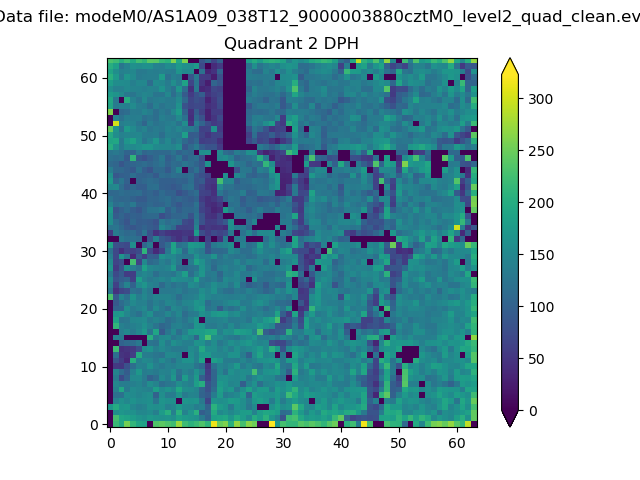
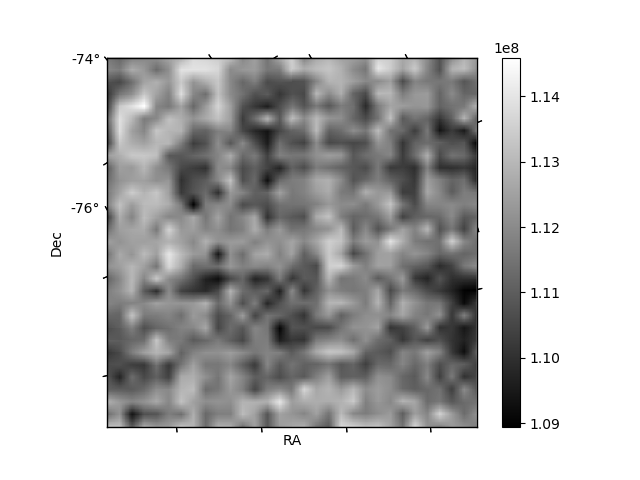
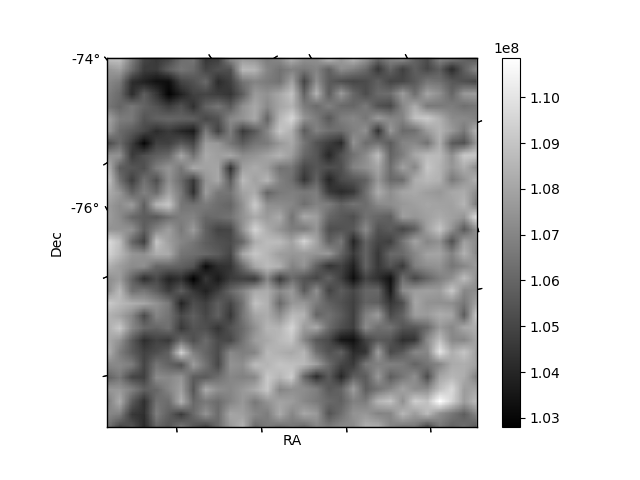
Histogram calculated using DETX and DETY for each event in the final _common_clean file
| Quadrant A | 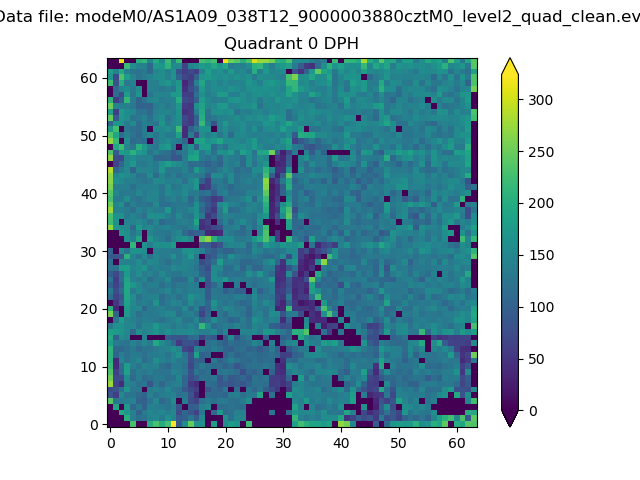 |
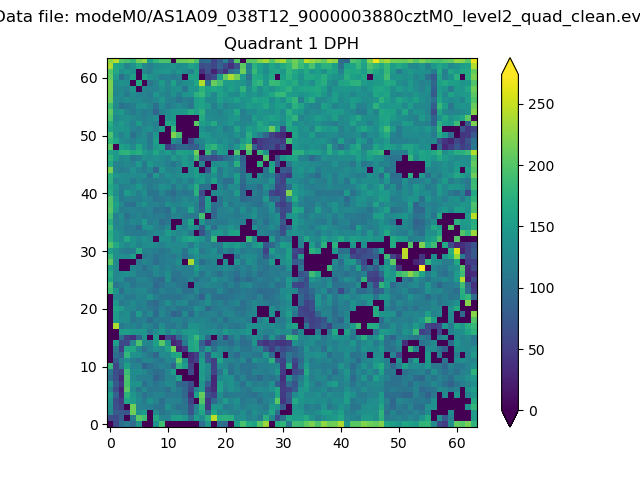 |
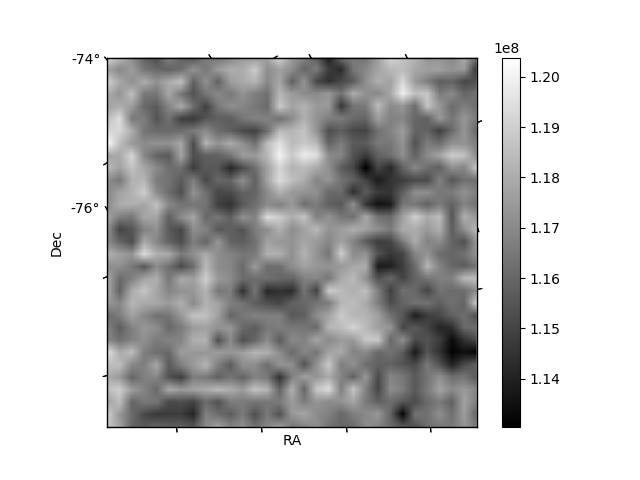
Quadrant B |
|---|---|---|---|
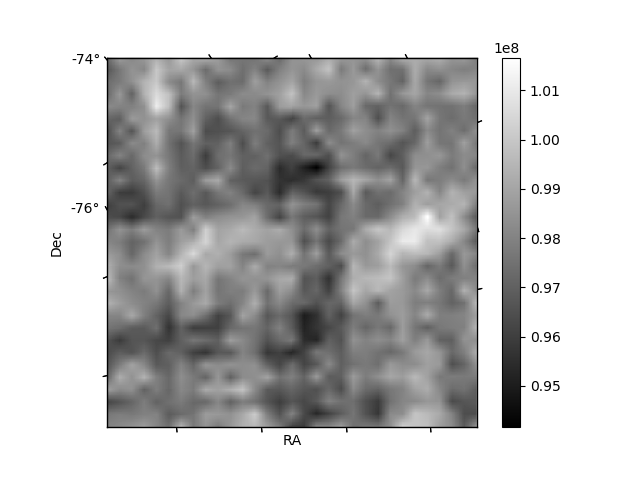
| Quadrant D | 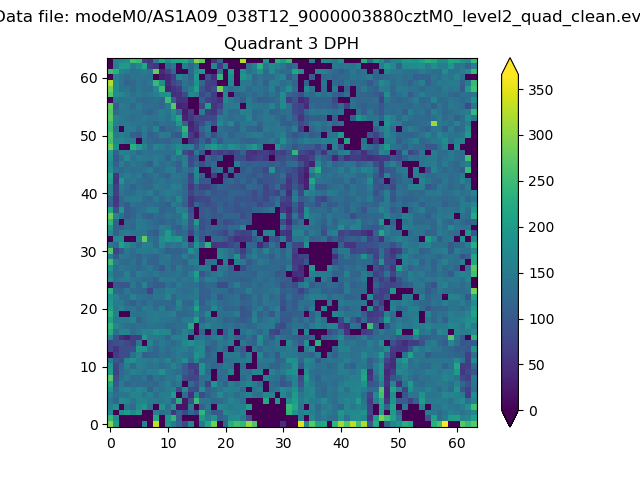 |
 |
Quadrant C |
| Plot type | Count rate plots | Images |
|---|---|---|
| Comparison with Poisson distribution Blue bars denote a histogram of data divided into 1 sec bins. Red curve is a Poisson curve with rate = median count rate of data. |
 |
 |
| Quadrant-wise count rates Data is divided into 100 sec bins |
 |
|
| Module-wise count rates for Quadrant A Data is divided into 100 sec bins |
 |
 |
| Module-wise count rates for Quadrant B Data is divided into 100 sec bins |
 |
 |
| Module-wise count rates for Quadrant C Data is divided into 100 sec bins |
 |
 |
| Module-wise count rates for Quadrant D Data is divided into 100 sec bins |
 |
 |
| Parameter | Plot |
|---|---|
| CZT HV Monitor | 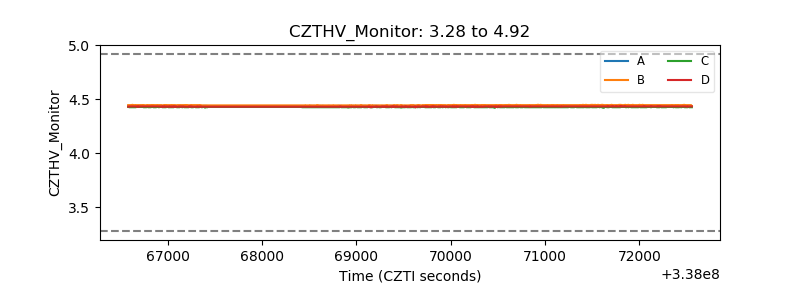 |
| D_VDD | 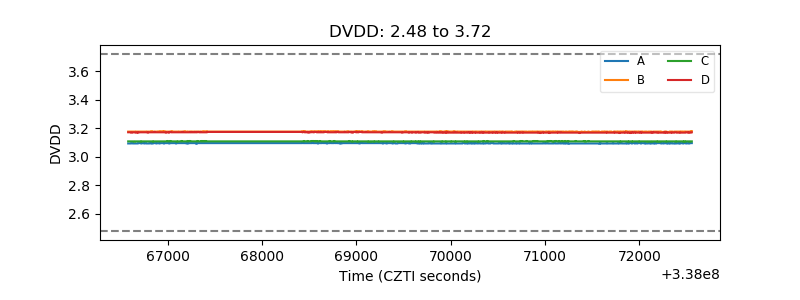 |
| Temperature 1 | 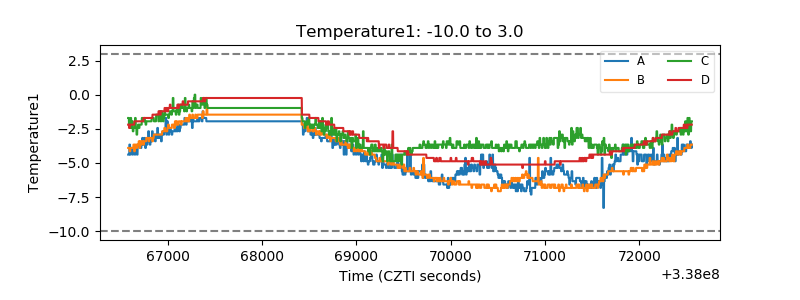 |
| Veto HV Monitor | 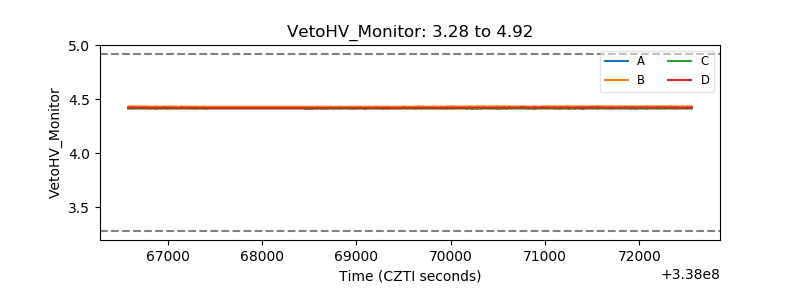 |
| Veto LLD | 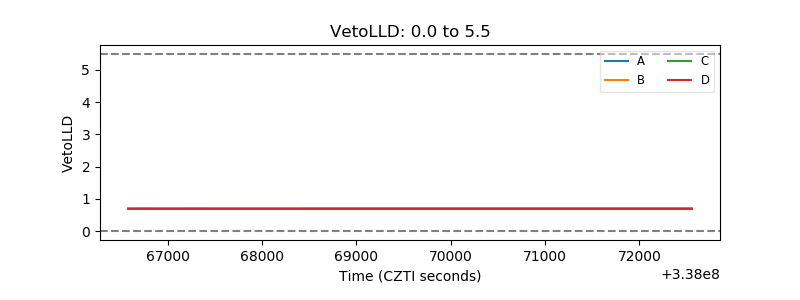 |
| Alpha Counter |  |
| _CPM_Rate | 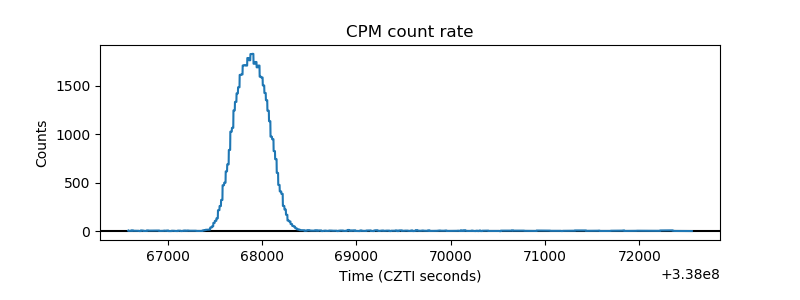 |
| CZT Counter |  |
| +2.5 Volts monitor |  |
| +5 Volts monitor | 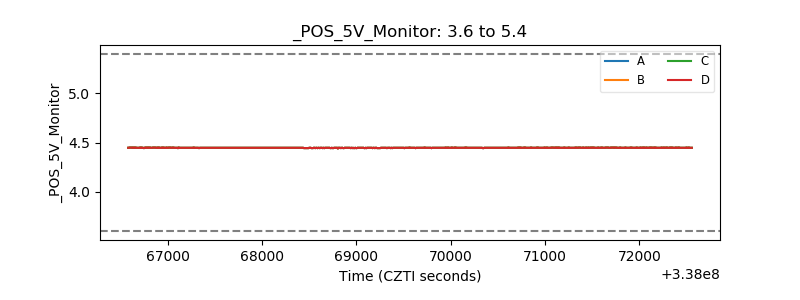 |
| _ROLL_ROT | 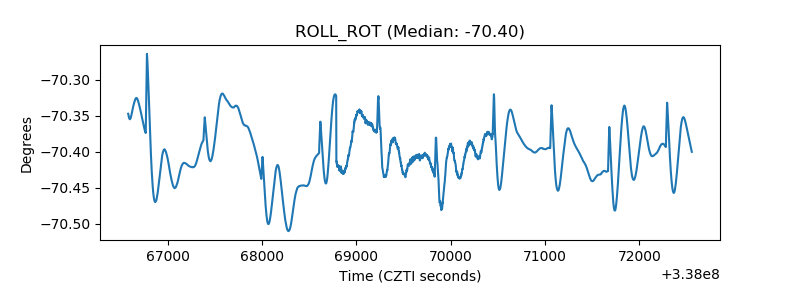 |
| _Roll_DEC | 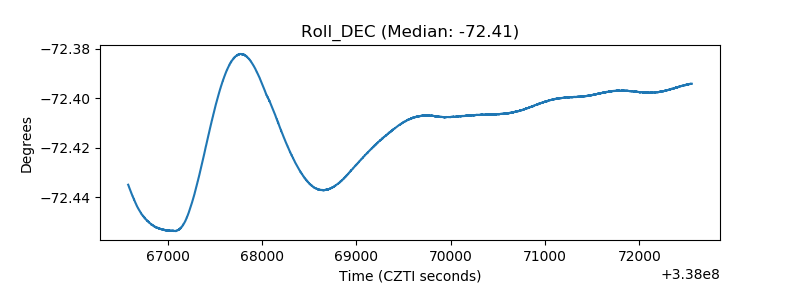 |
| _Roll_RA | 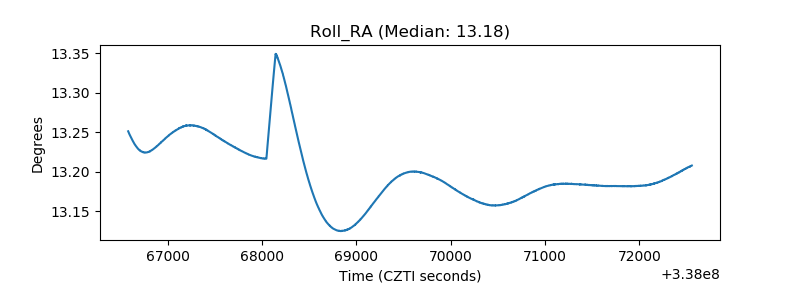 |
| Veto Counter | 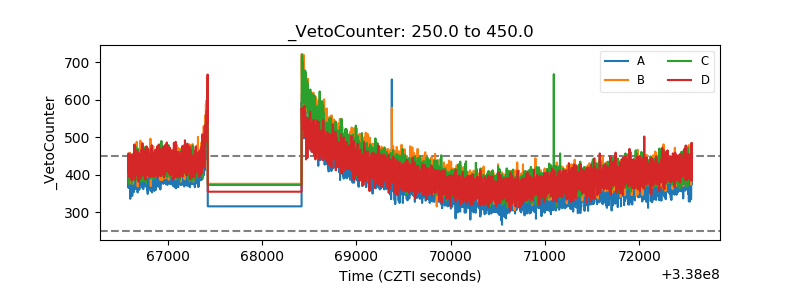 |