| Param | Original file | Final file |
|---|---|---|
| Filename | modeM0/AS1A09_038T12_9000003880_26889cztM0_level2.evt | modeM0/AS1A09_038T12_9000003880_26889cztM0_level2_quad_clean.evt |
| Size (bytes) | 230,212,800 | 33,753,600 |
| Size | 219.5 MB | 32.2 MB |
| Events in quadrant A | 2,238,222 | 208,272 |
| Events in quadrant B | 1,345,863 | 227,783 |
| Events in quadrant C | 1,109,630 | 222,534 |
| Events in quadrant D | 2,130,775 | 207,576 |
| Mode M9 | |||
|---|---|---|---|
| Quadrant | BADHDUFLAG | Total packets | Discarded packets |
| A | 0 | 10 | 0 |
| B | 0 | 10 | 0 |
| C | 0 | 10 | 0 |
| D | 0 | 10 | 0 |
| Mode M0 | |||
|---|---|---|---|
| Quadrant | BADHDUFLAG | Total packets | Discarded packets |
| A | 0 | 8131 | 1 |
| B | 0 | 5362 | 1 |
| C | 0 | 4503 | 1 |
| D | 0 | 7804 | 1 |
| Mode SS | |||
|---|---|---|---|
| Quadrant | BADHDUFLAG | Total packets | Discarded packets |
| A | 0 | 44 | 0 |
| B | 0 | 44 | 0 |
| C | 0 | 44 | 0 |
| D | 0 | 44 | 0 |
| Quadrant | Total seconds | Saturated seconds | Saturation percentage |
|---|---|---|---|
| A | 2150 | 251 | 11.674419% |
| B | 2150 | 73 | 3.395349% |
| C | 2150 | 27 | 1.255814% |
| D | 2150 | 312 | 14.511628% |
Noise dominated data is calculated using 1-second bins in cleaned event files. If a bin has >2000 counts, and if more than 50% of those come from <1% of pixels, then it is considered to be noise-dominated and hence unusable.
| Quadrant | # 1 sec bins | Bins with >0 counts | Bins with >2000 counts | High rate bins dominated by noise | Noise dominated (total time) | Noise dominated (detector-on time) | Marked lightcurve |
|---|---|---|---|---|---|---|---|
| A | 3145 | 2151 | 117 | 117 | 3.72% | 5.44% | 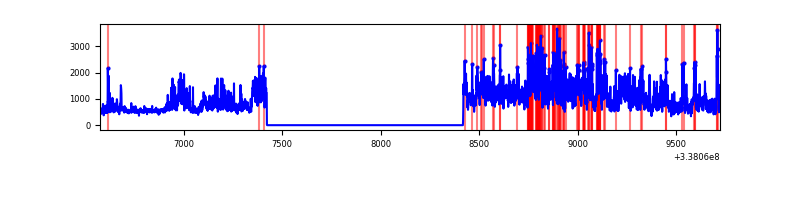 |
| B | 3145 | 2151 | 25 | 25 | 0.79% | 1.16% | 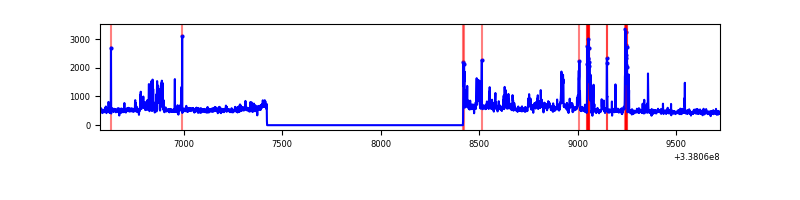 |
| C | 3145 | 2151 | 0 | 0 | 0.00% | 0.00% | 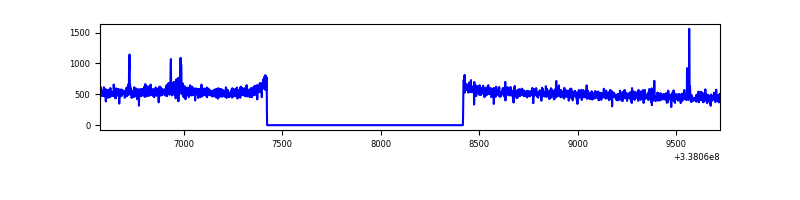 |
| D | 3145 | 2151 | 268 | 268 | 8.52% | 12.46% | 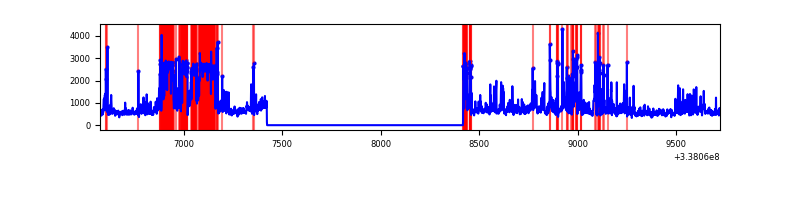 |
Top three noisy pixels from each quadrant. If the there are fewer than three noisy pixels in the level2.evt file, extra rows are filled as -1
| Pixel properties | Quadrant properties | ||||||
|---|---|---|---|---|---|---|---|
| Quadrant | DetID | PixID | Counts | Sigma | Mean | Median | Sigma |
| A | 0 | 13 | 721727 | 12712.22 | 275 | 269 | 56.8 |
| A | 6 | 16 | 452525 | 7968.83 | 275 | 269 | 56.8 |
| A | 13 | 254 | 3607 | 58.81 | 275 | 269 | 56.8 |
| B | 3 | 64 | 120771 | 2165.28 | 281 | 275 | 55.6 |
| B | 0 | 190 | 60399 | 1080.41 | 281 | 275 | 55.6 |
| B | 15 | 33 | 51075 | 912.86 | 281 | 275 | 55.6 |
| C | 14 | 238 | 43493 | 672.29 | 269 | 270 | 64.3 |
| C | 15 | 208 | 13162 | 200.52 | 269 | 270 | 64.3 |
| C | 3 | 233 | 2569 | 35.76 | 269 | 270 | 64.3 |
| D | 1 | 52 | 1070612 | 17633.33 | 252 | 246 | 60.7 |
| D | 2 | 250 | 54059 | 886.52 | 252 | 246 | 60.7 |
| D | 7 | 80 | 18520 | 301.05 | 252 | 246 | 60.7 |
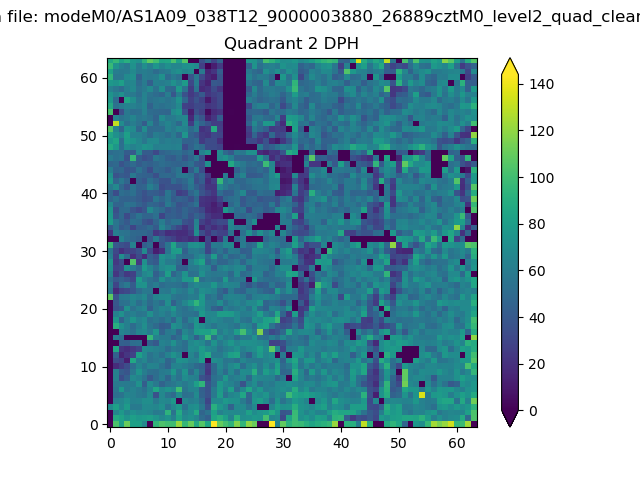
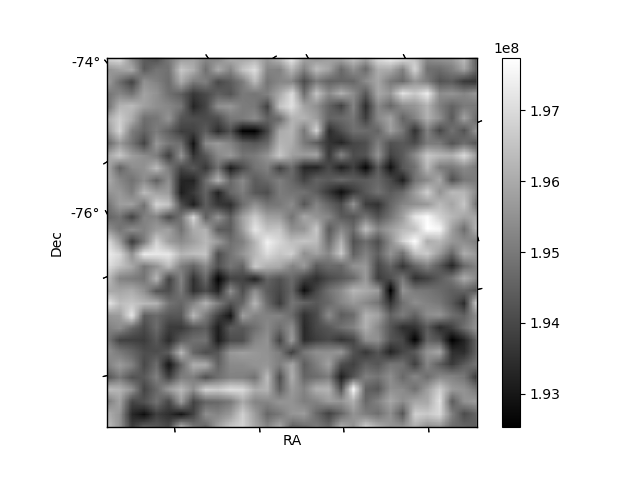
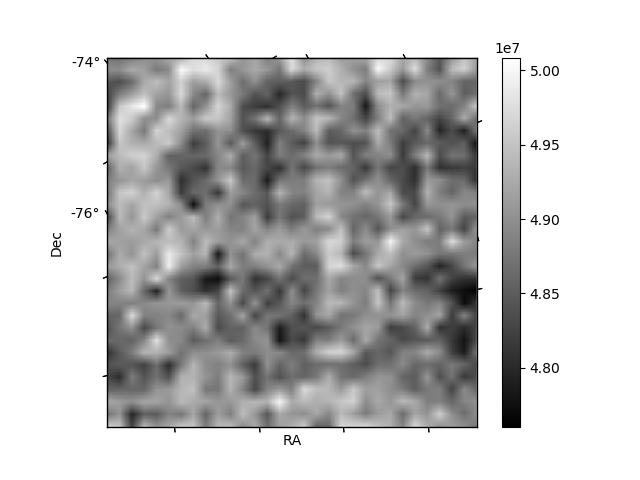
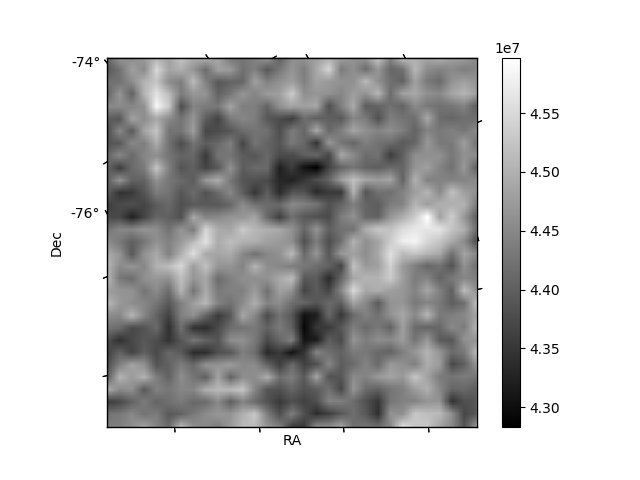
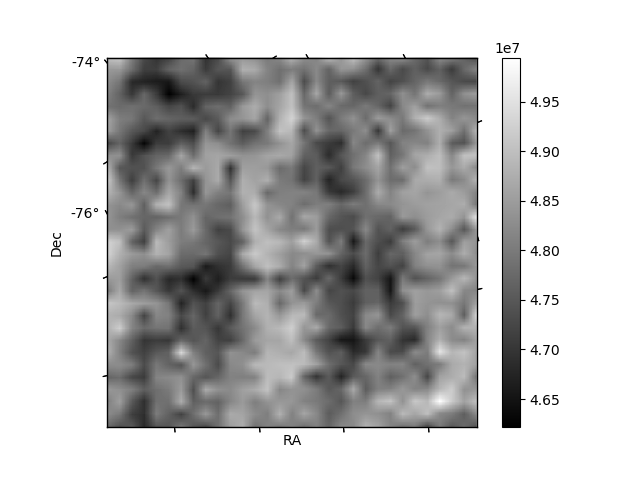
Histogram calculated using DETX and DETY for each event in the final _common_clean file
| Quadrant A | 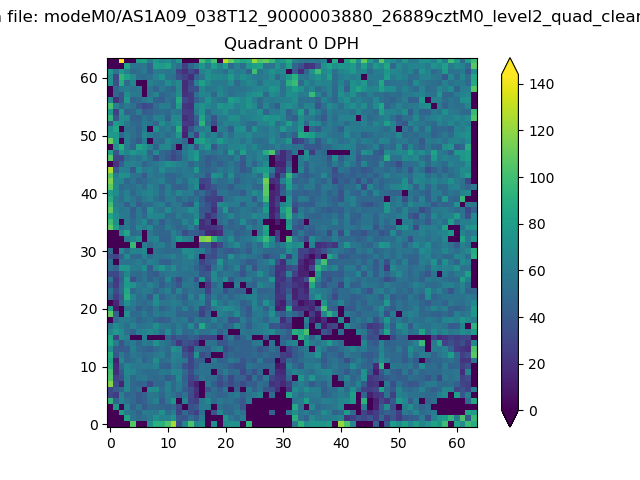 |
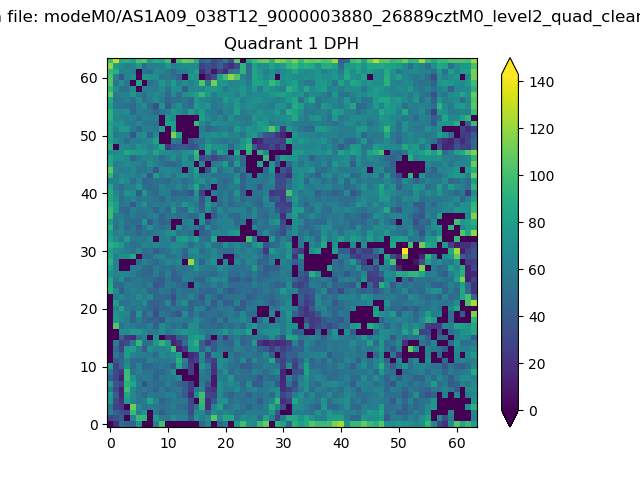 |
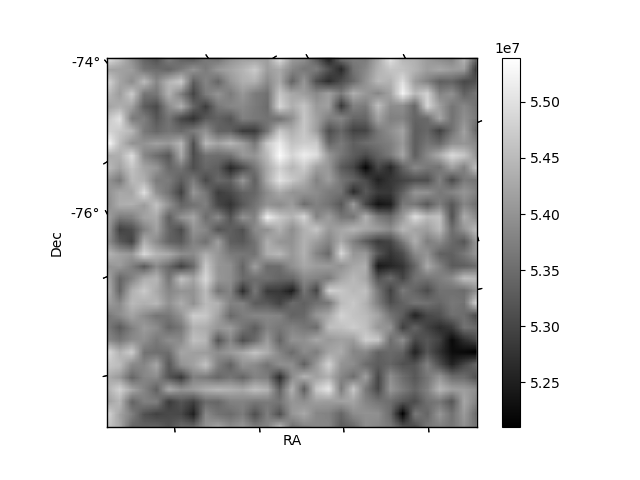
Quadrant B |
|---|---|---|---|
| Quadrant D | 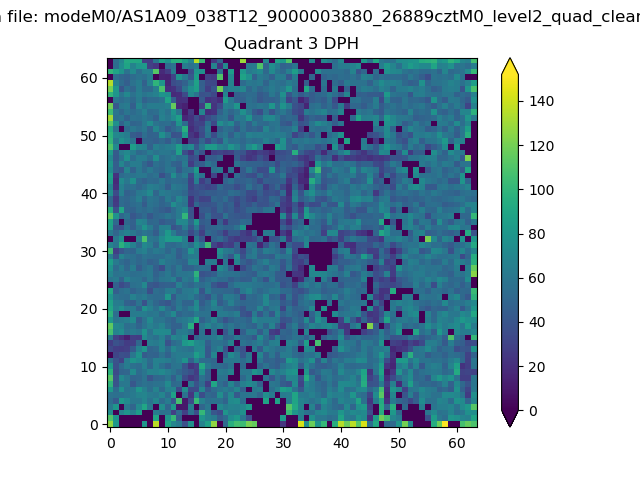 |
 |
Quadrant C |
| Plot type | Count rate plots | Images |
|---|---|---|
| Comparison with Poisson distribution Blue bars denote a histogram of data divided into 1 sec bins. Red curve is a Poisson curve with rate = median count rate of data. |
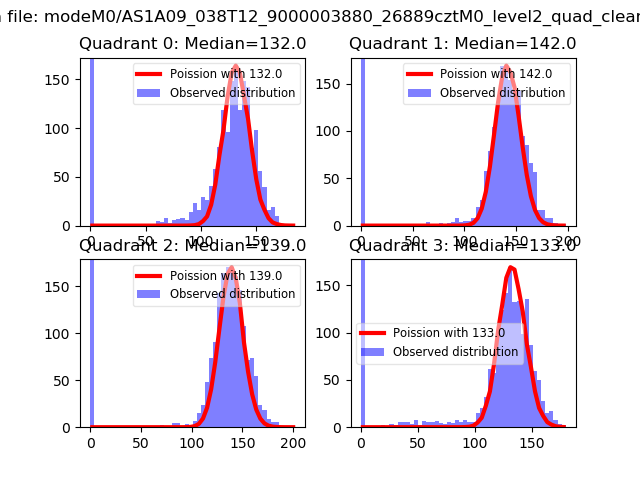 |
 |
| Quadrant-wise count rates Data is divided into 100 sec bins |
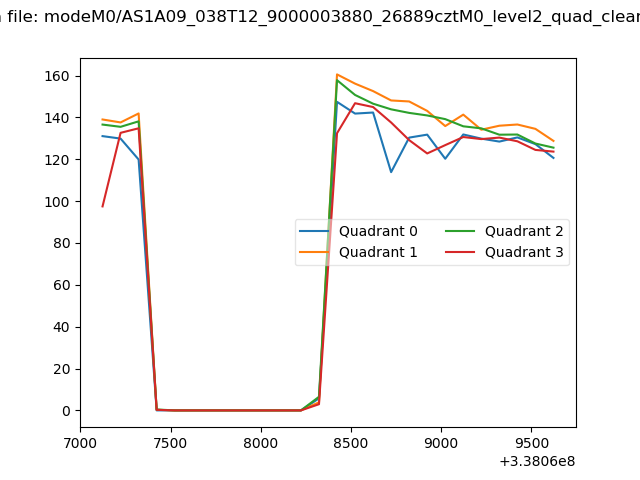 |
|
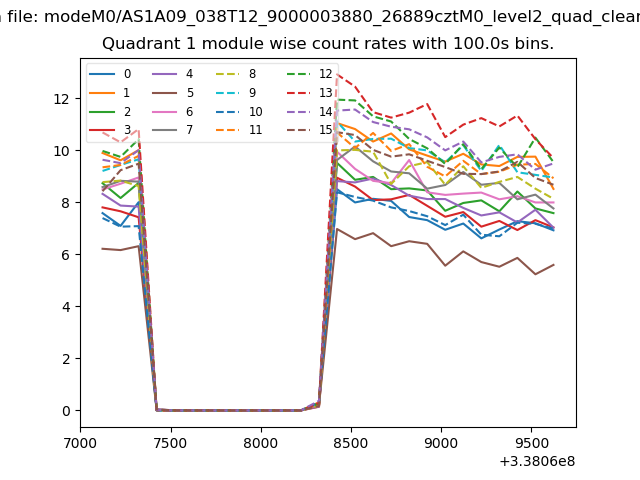
| Module-wise count rates for Quadrant A Data is divided into 100 sec bins |
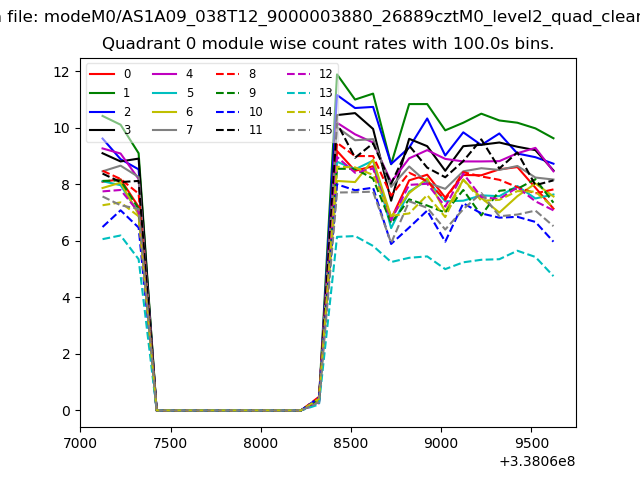 |
 |
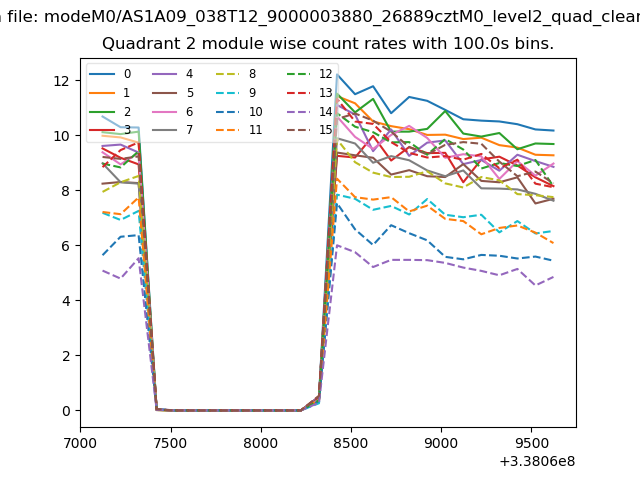
| Module-wise count rates for Quadrant B Data is divided into 100 sec bins |
 |
 |
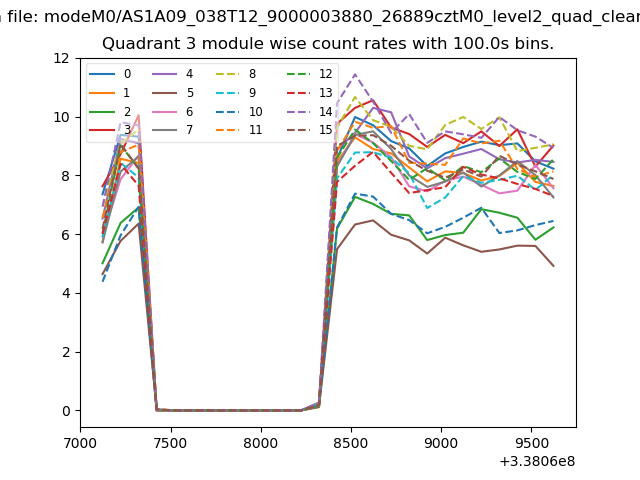
| Module-wise count rates for Quadrant C Data is divided into 100 sec bins |
 |
 |
| Module-wise count rates for Quadrant D Data is divided into 100 sec bins |
 |
 |
| Parameter | Plot |
|---|---|
| CZT HV Monitor | 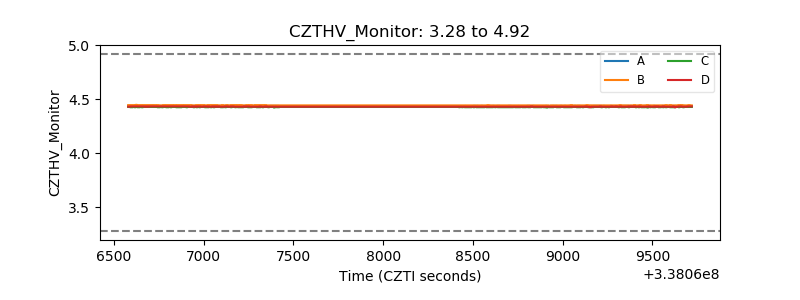 |
| D_VDD | 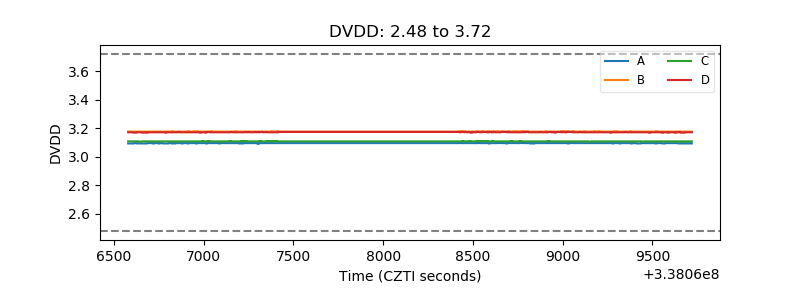 |
| Temperature 1 | 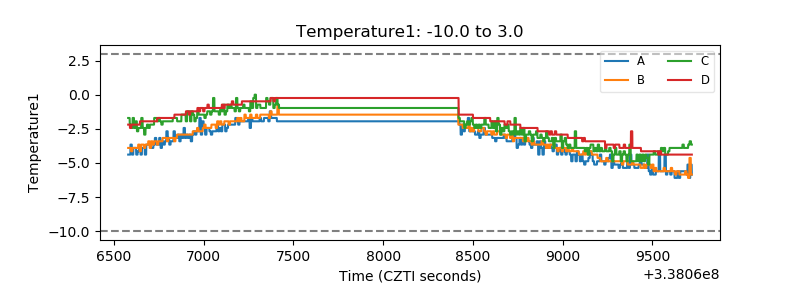 |
| Veto HV Monitor | 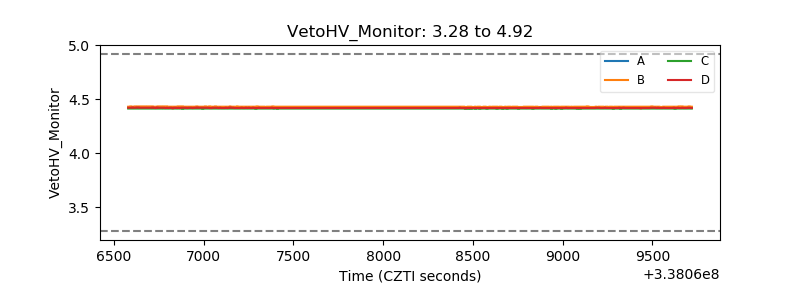 |
| Veto LLD | 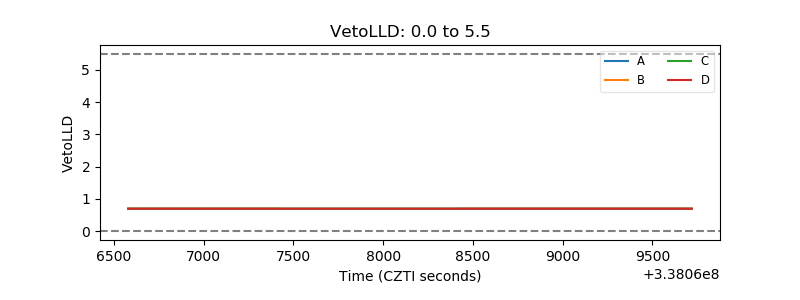 |
| Alpha Counter | 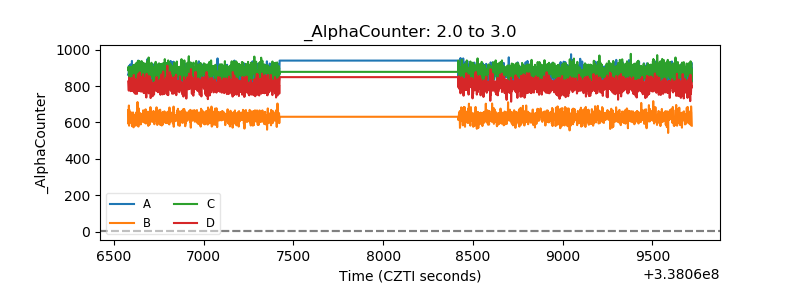 |
| _CPM_Rate | 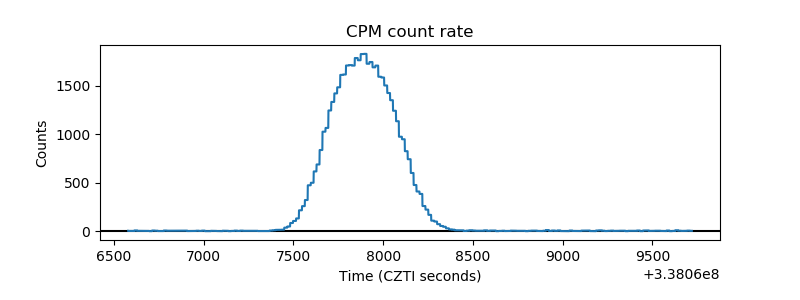 |
| CZT Counter | 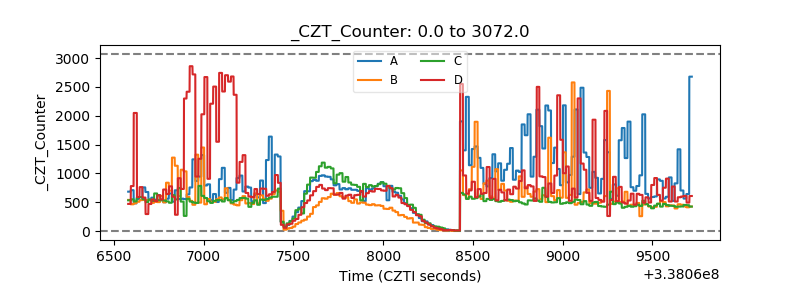 |
| +2.5 Volts monitor |  |
| +5 Volts monitor |  |
| _ROLL_ROT | 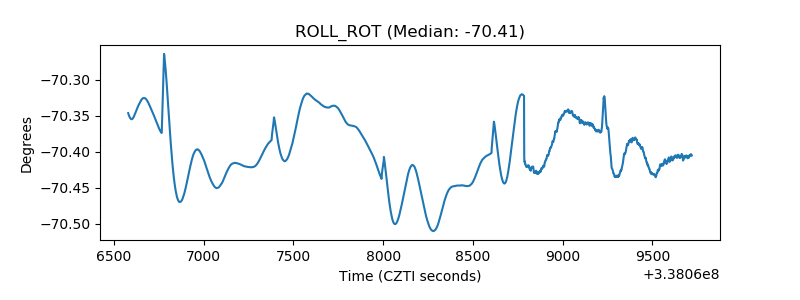 |
| _Roll_DEC | 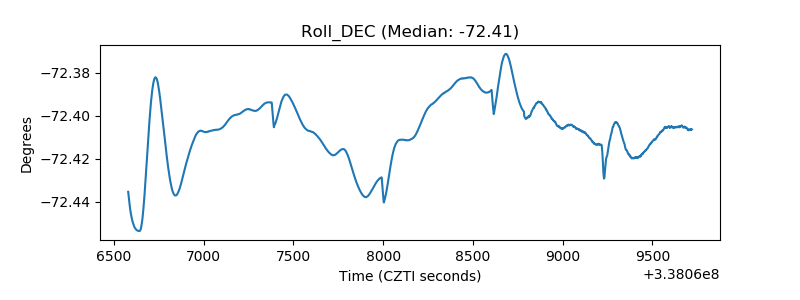 |
| _Roll_RA | 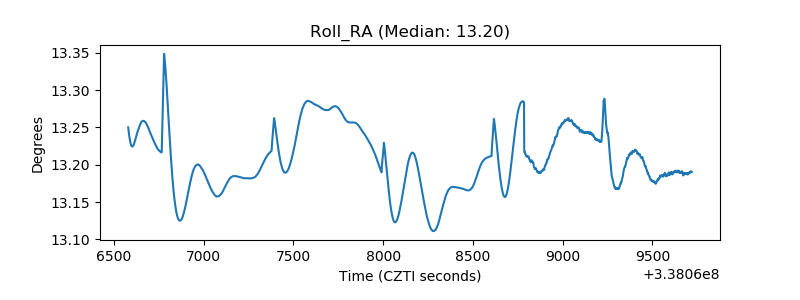 |
| Veto Counter | 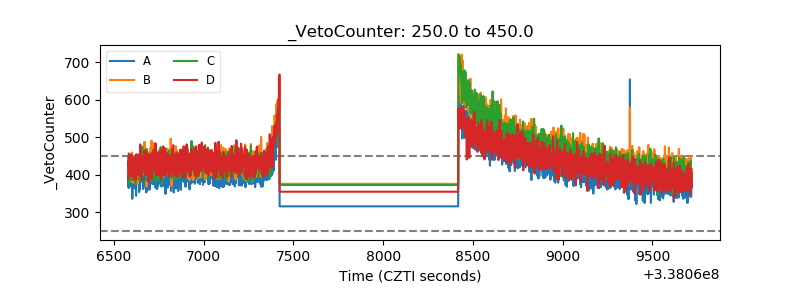 |